39f41db94edbe7c0c6ebb193e14eddad.ppt
- Количество слайдов: 34
Misunderstandings About Oracle Internals The Cost of Oracle Logical I/O Calls Slide 1
Agenda • • • The true cost of a block visit Operational measurements You probably don’t need a hardware upgrade What you should do instead Conclusion Slide 2
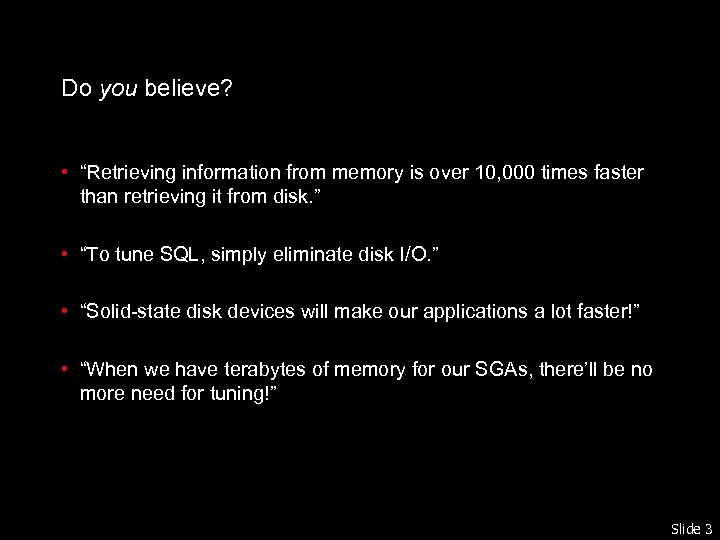
Do you believe? • “Retrieving information from memory is over 10, 000 times faster than retrieving it from disk. ” • “To tune SQL, simply eliminate disk I/O. ” • “Solid-state disk devices will make our applications a lot faster!” • “When we have terabytes of memory for our SGAs, there’ll be no more need for tuning!” Slide 3
Part I Reading from the buffer cache is more expensive than you might think. Slide 4
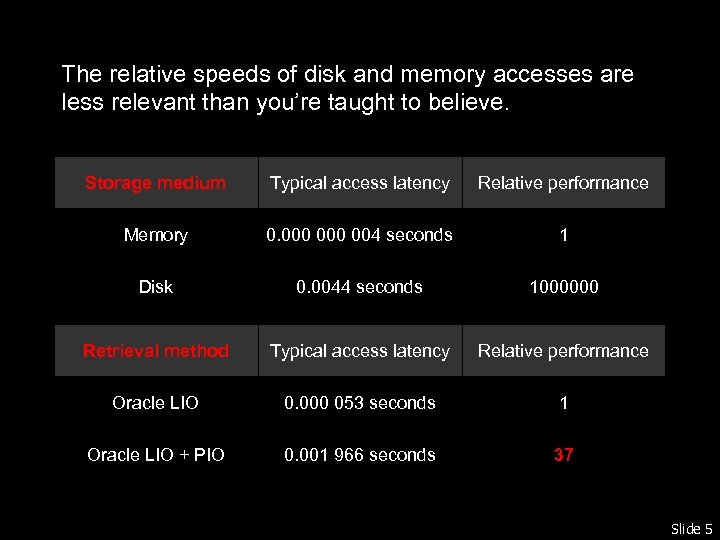
The relative speeds of disk and memory accesses are less relevant than you’re taught to believe. Storage medium Typical access latency Relative performance Memory 0. 000 004 seconds 1 Disk 0. 0044 seconds 1000000 Retrieval method Typical access latency Relative performance Oracle LIO 0. 000 053 seconds 1 Oracle LIO + PIO 0. 001 966 seconds 37 Slide 5
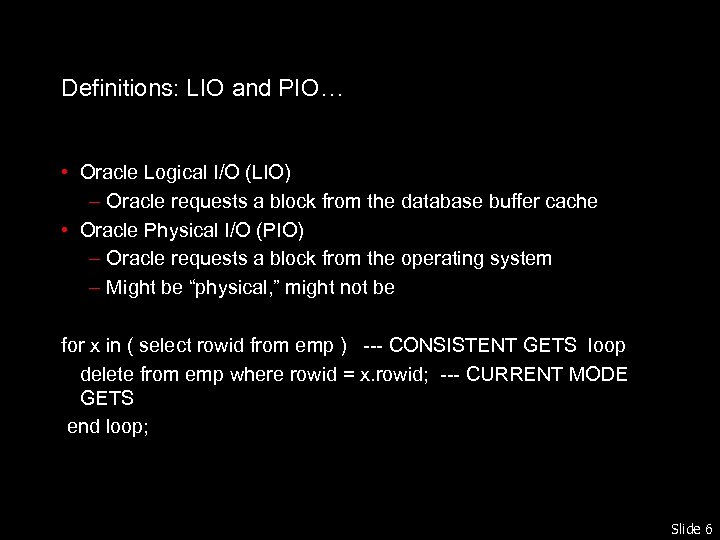
Definitions: LIO and PIO… • Oracle Logical I/O (LIO) – Oracle requests a block from the database buffer cache • Oracle Physical I/O (PIO) – Oracle requests a block from the operating system – Might be “physical, ” might not be for x in ( select rowid from emp ) --- CONSISTENT GETS loop delete from emp where rowid = x. rowid; --- CURRENT MODE GETS end loop; Slide 6
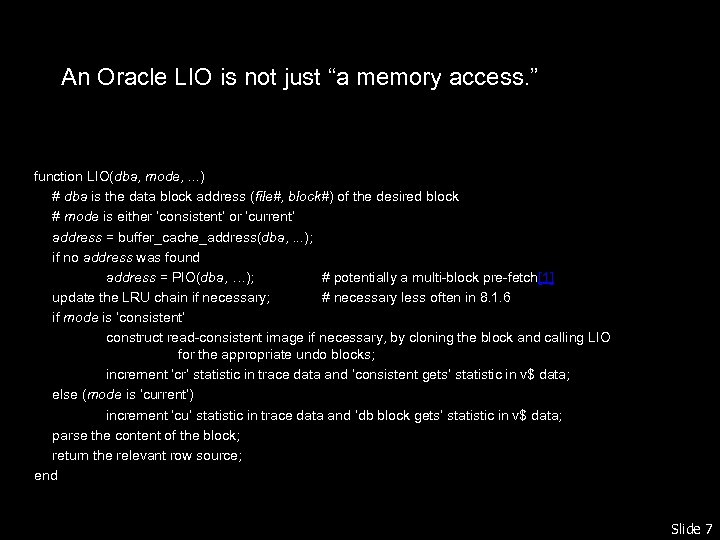
An Oracle LIO is not just “a memory access. ” function LIO(dba, mode, . . . ) # dba is the data block address (file#, block#) of the desired block # mode is either ‘consistent’ or ‘current’ address = buffer_cache_address(dba, . . . ); if no address was found address = PIO(dba, …); # potentially a multi-block pre-fetch[1] update the LRU chain if necessary; # necessary less often in 8. 1. 6 if mode is ‘consistent’ construct read-consistent image if necessary, by cloning the block and calling LIO for the appropriate undo blocks; increment ‘cr’ statistic in trace data and ‘consistent gets’ statistic in v$ data; else (mode is ‘current’) increment ‘cu’ statistic in trace data and ‘db block gets’ statistic in v$ data; parse the content of the block; return the relevant row source; end Slide 7
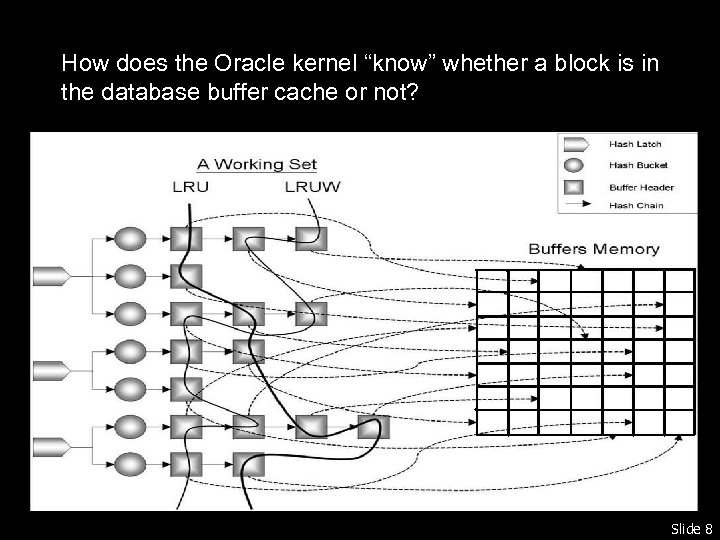
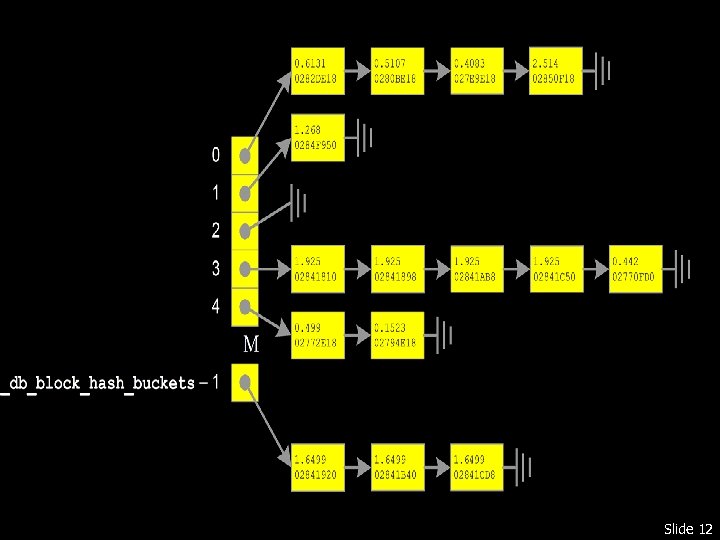
How does the Oracle kernel “know” whether a block is in the database buffer cache or not? Slide 8
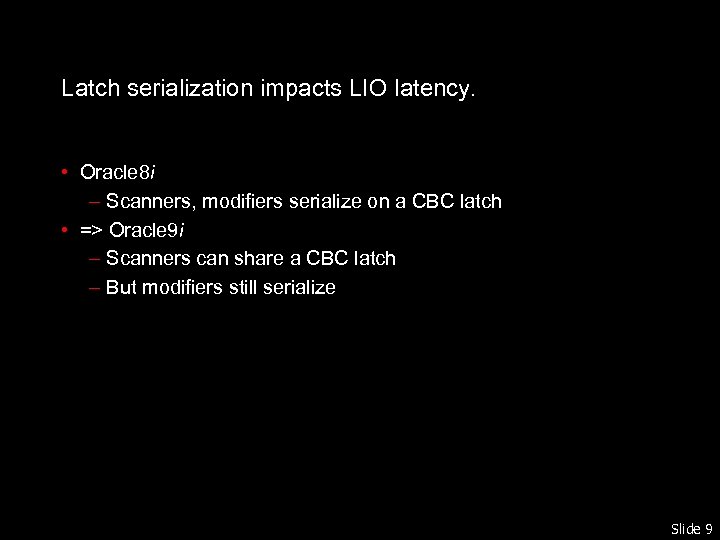
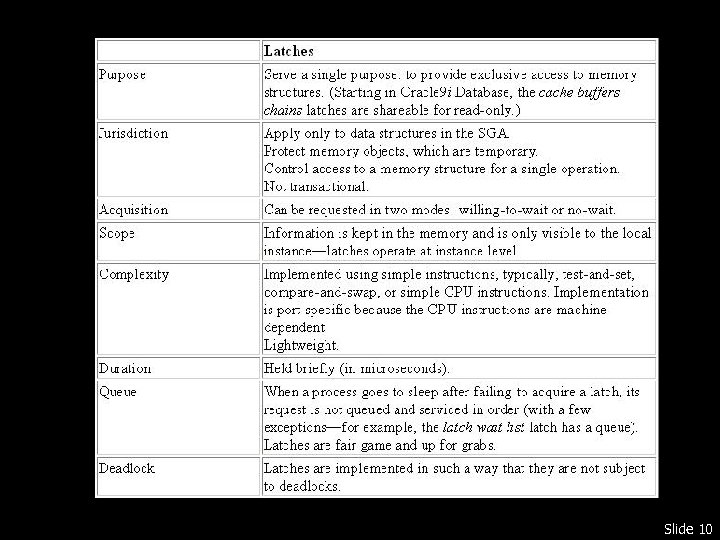
Latch serialization impacts LIO latency. • Oracle 8 i – Scanners, modifiers serialize on a CBC latch • => Oracle 9 i – Scanners can share a CBC latch – But modifiers still serialize Slide 9
Slide 10
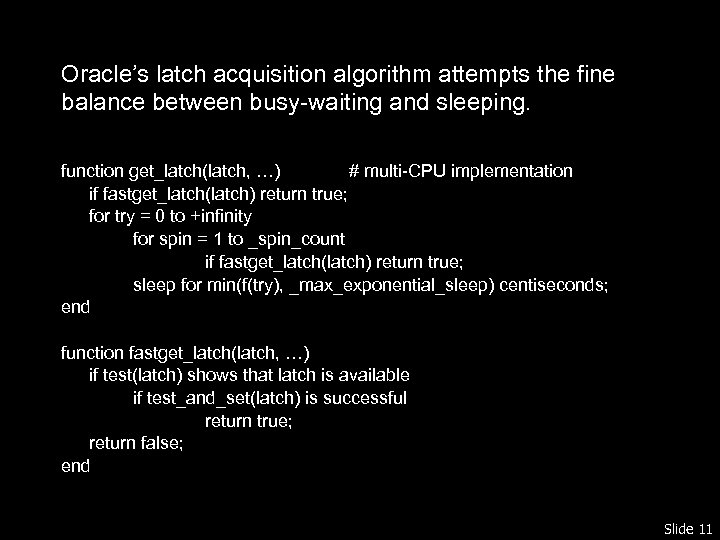
Oracle’s latch acquisition algorithm attempts the fine balance between busy-waiting and sleeping. function get_latch(latch, …) # multi-CPU implementation if fastget_latch(latch) return true; for try = 0 to +infinity for spin = 1 to _spin_count if fastget_latch(latch) return true; sleep for min(f(try), _max_exponential_sleep) centiseconds; end function fastget_latch(latch, …) if test(latch) shows that latch is available if test_and_set(latch) is successful return true; return false; end Slide 11
Slide 12
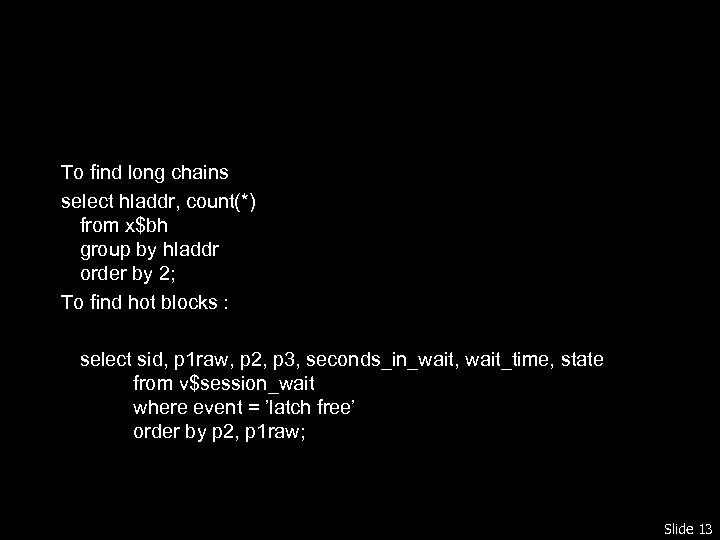
To find long chains select hladdr, count(*) from x$bh group by hladdr order by 2; To find hot blocks : select sid, p 1 raw, p 2, p 3, seconds_in_wait, wait_time, state from v$session_wait where event = ’latch free’ order by p 2, p 1 raw; Slide 13
Part II How to measure LIO and PIO latencies operationally. Slide 14
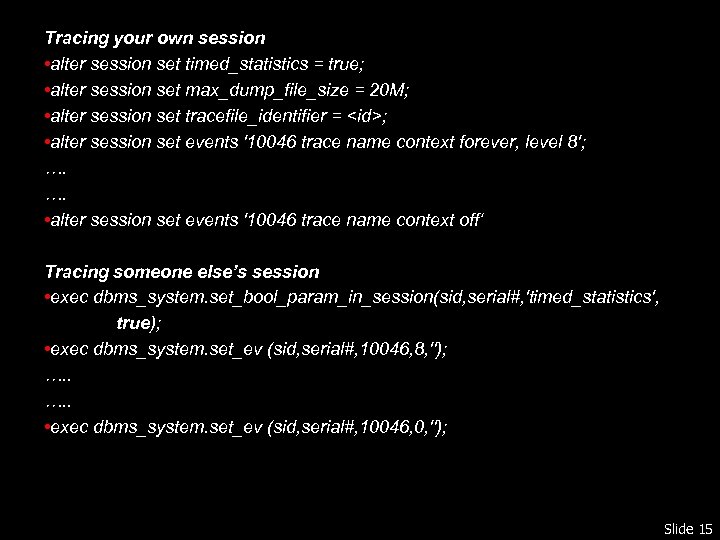
Tracing your own session • alter session set timed_statistics = true; • alter session set max_dump_file_size = 20 M; • alter session set tracefile_identifier = <id>; • alter session set events '10046 trace name context forever, level 8'; …. …. • alter session set events '10046 trace name context off‘ Tracing someone else’s session • exec dbms_system. set_bool_param_in_session(sid, serial#, 'timed_statistics', true); • exec dbms_system. set_ev (sid, serial#, 10046, 8, ''); …. . • exec dbms_system. set_ev (sid, serial#, 10046, 0, ''); Slide 15
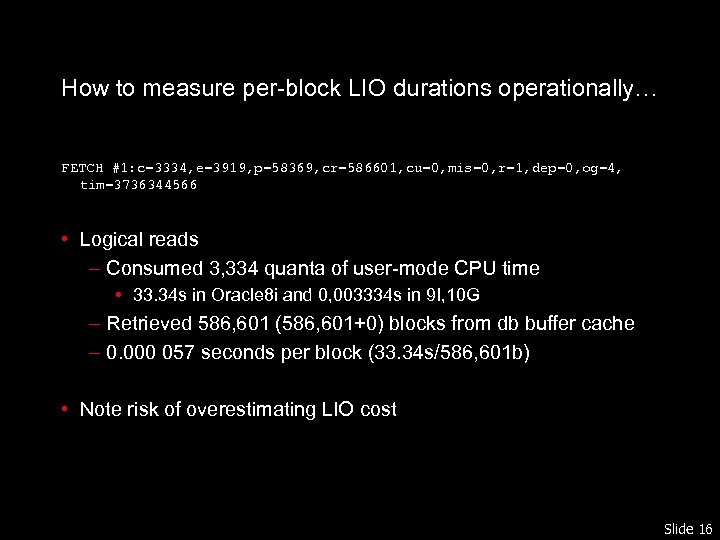
How to measure per-block LIO durations operationally… FETCH #1: c=3334, e=3919, p=58369, cr=586601, cu=0, mis=0, r=1, dep=0, og=4, tim=3736344566 • Logical reads – Consumed 3, 334 quanta of user-mode CPU time • 33. 34 s in Oracle 8 i and 0, 003334 s in 9 I, 10 G – Retrieved 586, 601 (586, 601+0) blocks from db buffer cache – 0. 000 057 seconds per block (33. 34 s/586, 601 b) • Note risk of overestimating LIO cost Slide 16
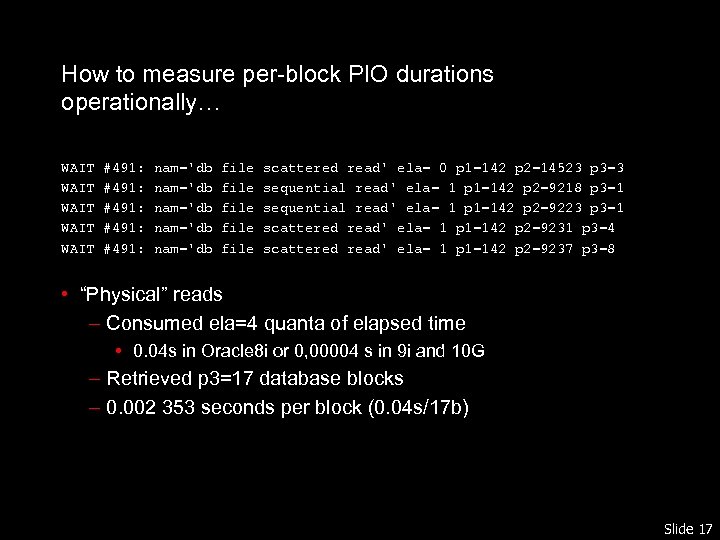
How to measure per-block PIO durations operationally… WAIT WAIT #491: #491: nam='db nam='db file file scattered read' ela= 0 p 1=142 p 2=14523 p 3=3 sequential read' ela= 1 p 1=142 p 2=9218 p 3=1 sequential read' ela= 1 p 1=142 p 2=9223 p 3=1 scattered read' ela= 1 p 1=142 p 2=9231 p 3=4 scattered read' ela= 1 p 1=142 p 2=9237 p 3=8 • “Physical” reads – Consumed ela=4 quanta of elapsed time • 0. 04 s in Oracle 8 i or 0, 00004 s in 9 i and 10 G – Retrieved p 3=17 database blocks – 0. 002 353 seconds per block (0. 04 s/17 b) Slide 17
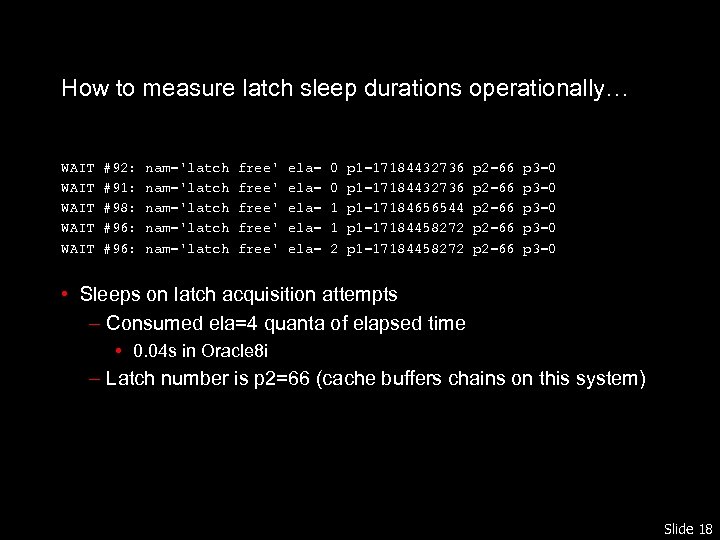
How to measure latch sleep durations operationally… WAIT WAIT #92: #91: #98: #96: nam='latch nam='latch free' free' ela= ela= 0 0 1 1 2 p 1=17184432736 p 1=17184656544 p 1=17184458272 p 2=66 p 2=66 p 3=0 p 3=0 • Sleeps on latch acquisition attempts – Consumed ela=4 quanta of elapsed time • 0. 04 s in Oracle 8 i – Latch number is p 2=66 (cache buffers chains on this system) Slide 18
Part III You probably don’t need faster disk or more memory. Slide 19
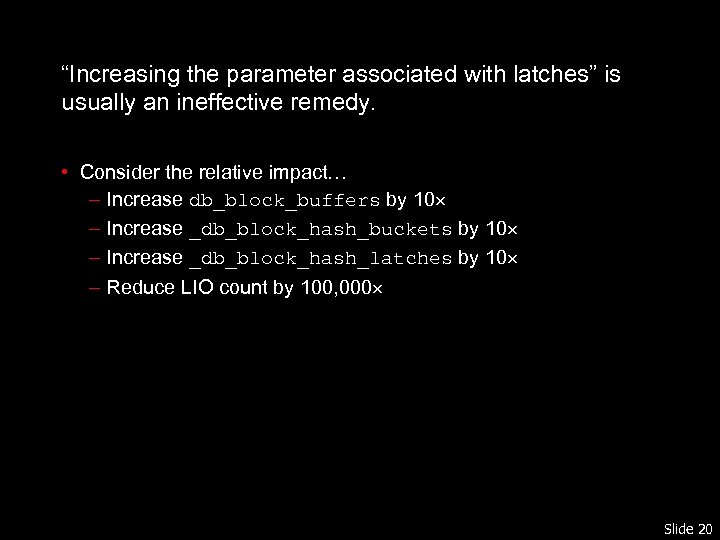
“Increasing the parameter associated with latches” is usually an ineffective remedy. • Consider the relative impact… – Increase db_block_buffers by 10 – Increase _db_block_hash_buckets by 10 – Increase _db_block_hash_latches by 10 – Reduce LIO count by 100, 000 Slide 20
PIOs Might Not Be Your Bottleneck Do you have a physical I/O bottleneck on your system? Chances are that if any of the following is true, then somebody at your business probably thinks that you do: • Your disk utilization figures are high. • Your disk queue lengths are long. • Your average read or write latency is high. If you suspect that you have a physical I/O bottleneck for any of these reasons, do not upgrade your disk subsystem until you figure out how much impact your Oracle PIO latencies have upon user response time. Slide 21
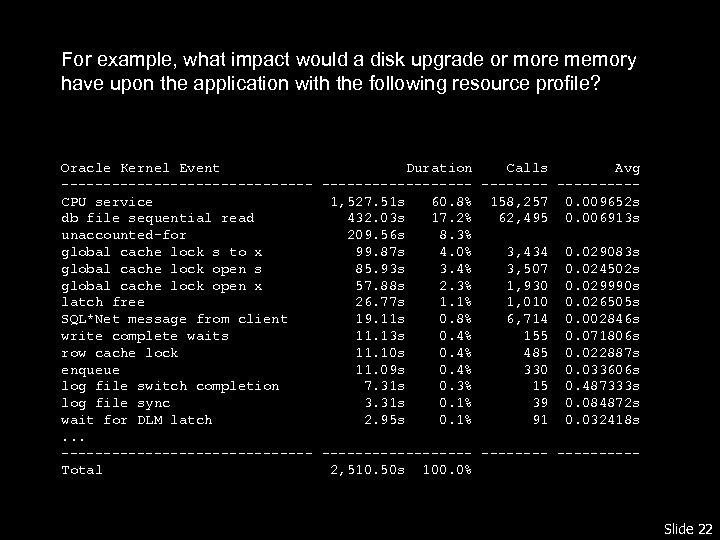
For example, what impact would a disk upgrade or more memory have upon the application with the following resource profile? Oracle Kernel Event Duration Calls Avg --------------- ---------CPU service 1, 527. 51 s 60. 8% 158, 257 0. 009652 s db file sequential read 432. 03 s 17. 2% 62, 495 0. 006913 s unaccounted-for 209. 56 s 8. 3% global cache lock s to x 99. 87 s 4. 0% 3, 434 0. 029083 s global cache lock open s 85. 93 s 3. 4% 3, 507 0. 024502 s global cache lock open x 57. 88 s 2. 3% 1, 930 0. 029990 s latch free 26. 77 s 1. 1% 1, 010 0. 026505 s SQL*Net message from client 19. 11 s 0. 8% 6, 714 0. 002846 s write complete waits 11. 13 s 0. 4% 155 0. 071806 s row cache lock 11. 10 s 0. 4% 485 0. 022887 s enqueue 11. 09 s 0. 4% 330 0. 033606 s log file switch completion 7. 31 s 0. 3% 15 0. 487333 s log file sync 3. 31 s 0. 1% 39 0. 084872 s wait for DLM latch 2. 95 s 0. 1% 91 0. 032418 s. . . --------------- ---------Total 2, 510. 50 s 100. 0% Slide 22
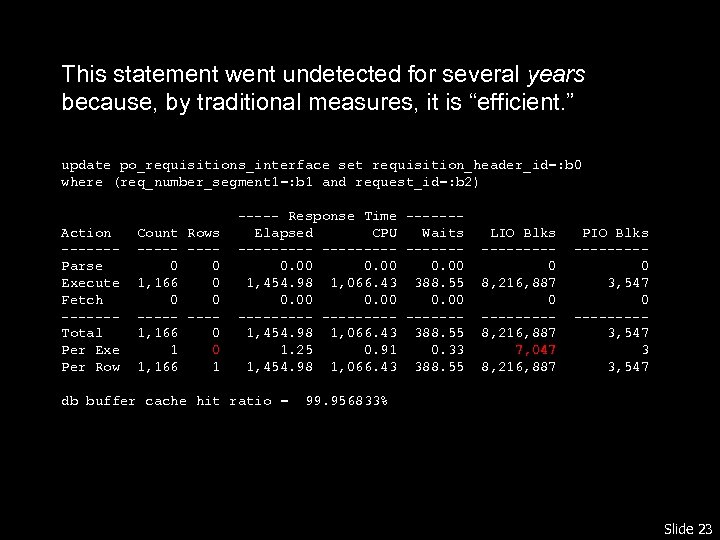
This statement went undetected for several years because, by traditional measures, it is “efficient. ” update po_requisitions_interface set requisition_header_id=: b 0 where (req_number_segment 1=: b 1 and request_id=: b 2) Action ------Parse Execute Fetch ------Total Per Exe Per Row Count Rows ----- ---0 0 1, 166 0 0 0 ----- ---1, 166 0 1, 166 1 ----- Response Time ------Elapsed CPU Waits ---------0. 00 1, 454. 98 1, 066. 43 388. 55 0. 00 ---------1, 454. 98 1, 066. 43 388. 55 1. 25 0. 91 0. 33 1, 454. 98 1, 066. 43 388. 55 db buffer cache hit ratio = LIO Blks ----0 8, 216, 887 0 ----8, 216, 887 7, 047 8, 216, 887 PIO Blks ----0 3, 547 0 ----3, 547 3 3, 547 99. 956833% Slide 23
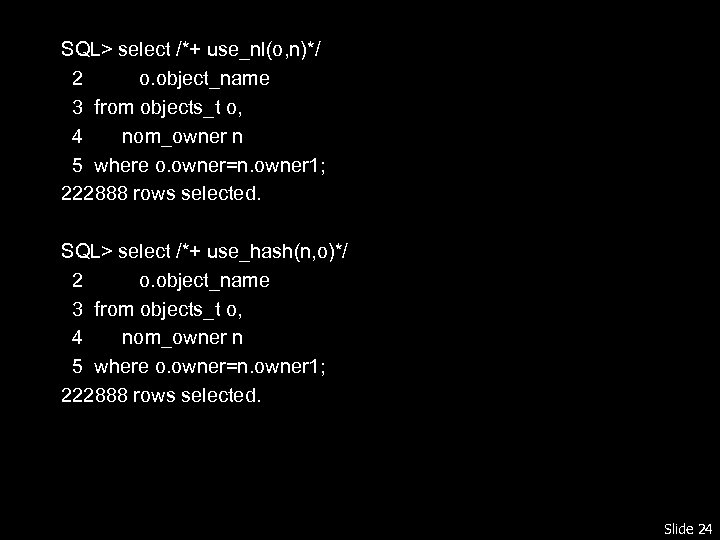
SQL> select /*+ use_nl(o, n)*/ 2 o. object_name 3 from objects_t o, 4 nom_owner n 5 where o. owner=n. owner 1; 222888 rows selected. SQL> select /*+ use_hash(n, o)*/ 2 o. object_name 3 from objects_t o, 4 nom_owner n 5 where o. owner=n. owner 1; 222888 rows selected. Slide 24
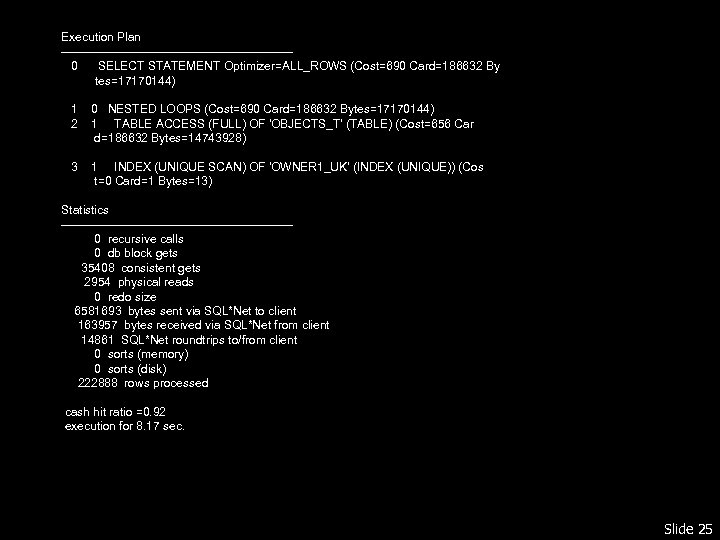
Execution Plan -----------------------------0 SELECT STATEMENT Optimizer=ALL_ROWS (Cost=690 Card=186632 By tes=17170144) 1 2 0 NESTED LOOPS (Cost=690 Card=186632 Bytes=17170144) 1 TABLE ACCESS (FULL) OF 'OBJECTS_T' (TABLE) (Cost=656 Car d=186632 Bytes=14743928) 3 1 INDEX (UNIQUE SCAN) OF 'OWNER 1_UK' (INDEX (UNIQUE)) (Cos t=0 Card=1 Bytes=13) Statistics -----------------------------0 recursive calls 0 db block gets 35408 consistent gets 2954 physical reads 0 redo size 6581693 bytes sent via SQL*Net to client 163957 bytes received via SQL*Net from client 14861 SQL*Net roundtrips to/from client 0 sorts (memory) 0 sorts (disk) 222888 rows processed cash hit ratio =0. 92 execution for 8. 17 sec. Slide 25
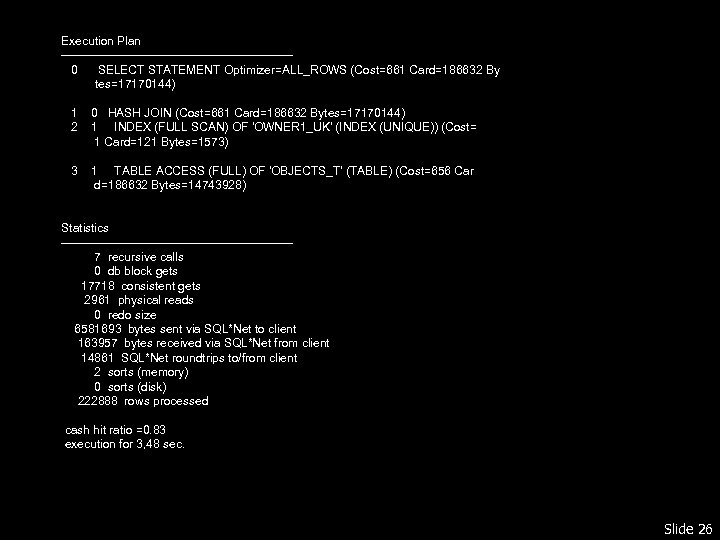
Execution Plan -----------------------------0 SELECT STATEMENT Optimizer=ALL_ROWS (Cost=661 Card=186632 By tes=17170144) 1 2 0 HASH JOIN (Cost=661 Card=186632 Bytes=17170144) 1 INDEX (FULL SCAN) OF 'OWNER 1_UK' (INDEX (UNIQUE)) (Cost= 1 Card=121 Bytes=1573) 3 1 TABLE ACCESS (FULL) OF 'OBJECTS_T' (TABLE) (Cost=656 Car d=186632 Bytes=14743928) Statistics -----------------------------7 recursive calls 0 db block gets 17718 consistent gets 2961 physical reads 0 redo size 6581693 bytes sent via SQL*Net to client 163957 bytes received via SQL*Net from client 14861 SQL*Net roundtrips to/from client 2 sorts (memory) 0 sorts (disk) 222888 rows processed cash hit ratio =0. 83 execution for 3, 48 sec. Slide 26
Part IV How to reduce LIO call frequency. Slide 27
Focus on LIO reduction first. • When you’ve eliminated PIOs, you’re still not done yet • If you begin with LIO reduction, you’ll get more benefit – Most PIOs are motivated by LIOs • However, eliminating LIOs requires actual thought Slide 28
Use the most efficient execution plan, not necessarily the one that your rules of thumb say to use. • A statement’s buffer cache hit ratio is an illegitimate measure of its efficiency • Any “x% of rows returned” index rule of thumb is illegitimate – Not all index range scans are good – Not all full-table scans are bad – Not all nested loops plans are good. Slide 29
Efficient SQL is necessary SQL that puts as little load upon the database as possible. • Eliminate unnecessary work – Filter early – Use arrays – Generate redo only when needed Slide 30
Part V Conclusion: Excessive LIO frequency is a major scalability barrier. Slide 31
When do you need faster disk? • Buy faster disk only when. . . – Disk latency significantly impacts an important program’s response time – And you’ve exhausted less expensive workload reduction opportunities • Invalid motives – Device average I/O latency is higher than you want – Device utilization is higher than you want – PIO count is non-zero Slide 32
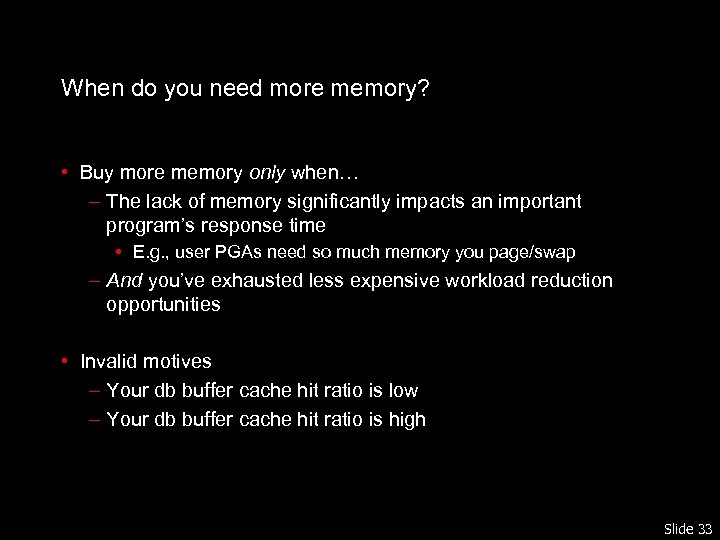
When do you need more memory? • Buy more memory only when… – The lack of memory significantly impacts an important program’s response time • E. g. , user PGAs need so much memory you page/swap – And you’ve exhausted less expensive workload reduction opportunities • Invalid motives – Your db buffer cache hit ratio is low – Your db buffer cache hit ratio is high Slide 33
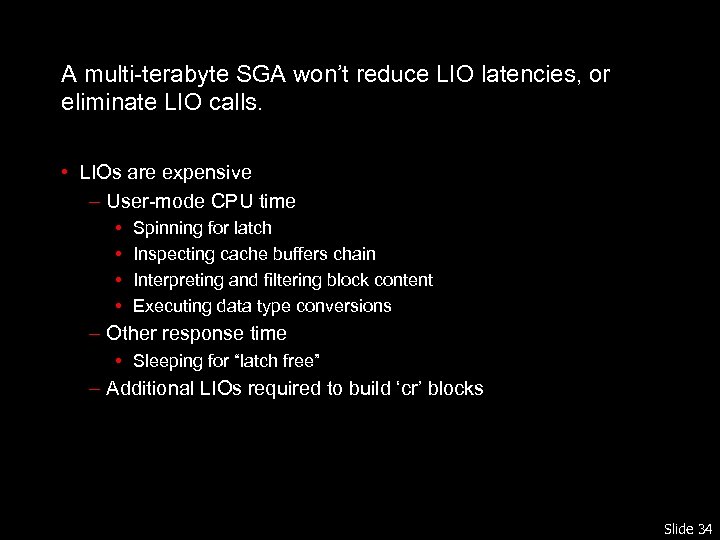
A multi-terabyte SGA won’t reduce LIO latencies, or eliminate LIO calls. • LIOs are expensive – User-mode CPU time • • Spinning for latch Inspecting cache buffers chain Interpreting and filtering block content Executing data type conversions – Other response time • Sleeping for “latch free” – Additional LIOs required to build ‘cr’ blocks Slide 34
39f41db94edbe7c0c6ebb193e14eddad.ppt