3b0256491fdc0cf68ef36b3f5aa74d88.ppt
- Количество слайдов: 49
 Mining Analyzer Data Perry A. Stupp Performance Assurance Practice Manager Computer & Financial Solutions Inc. perry@cfsolutions-inc. com 1 © Copyright Computer & Financial Solutions Inc. - 2004
 Agenda › What is data mining and why do we do it? › The available data sources › Data mining tools and techniques
 What is data mining? › Turning raw data (metrics) into information. – Identifying patterns • When do events occur and why? • How often do values fall in a particular range? – Understanding the relationship between events and data elements • Visual Correlation (Time based) • Statistical Correlation (Volume or movement Based) – Determining the growth of resources • Determining the impact of commands / workloads on system behavior • Extrapolating future resource requirements from past trends. – Finding the cause of problems and identifying leading indicators • Application crashes and hangs, run-away processes, memory leaks – Discovering Applications • Automated identification of discrete instances. • Identifying workload “initiators”
 What data mining isn’t… › For everyone… – It often requires a particular mindset and skill-sets › For every situation… – It can be time consuming We are working diligently to change this – as you will see.
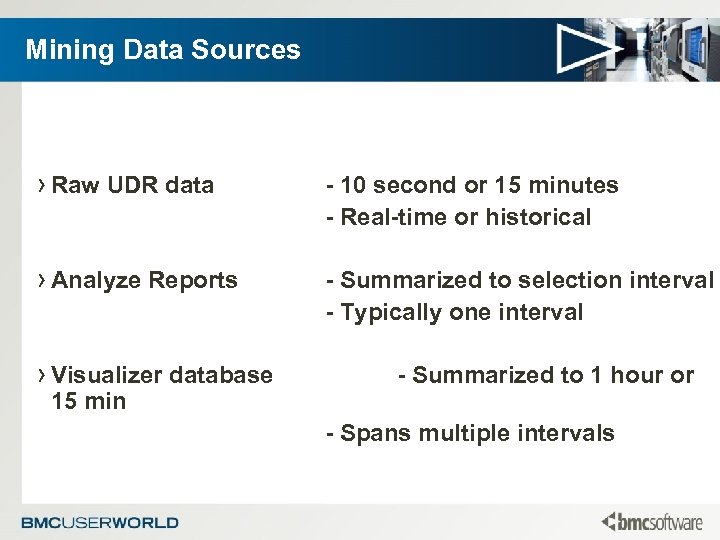 Mining Data Sources › Raw UDR data - 10 second or 15 minutes - Real-time or historical › Analyze Reports - Summarized to selection interval - Typically one interval › Visualizer database 15 min - Summarized to 1 hour or - Spans multiple intervals
 Raw UDR Data › Most comprehensive data source available – More data than most people know what to do with. – Almost everything you to need! – Greatest detail, largest size, least history › Generally best for – Very low level, detailed analysis of raw performance. – Data Validation – Importing new metrics into Perceive › Limitations – Often not time “aligned” – Often requires summarization into larger intervals – Not easily extensible / supported.
 Mining Raw UDR › Best mined with – Unix or Windows console (real-time) – Windows console (historical) – printudr • local or remote – real-time • local – historical – UDRviewer (local) • Great for raw numbers!
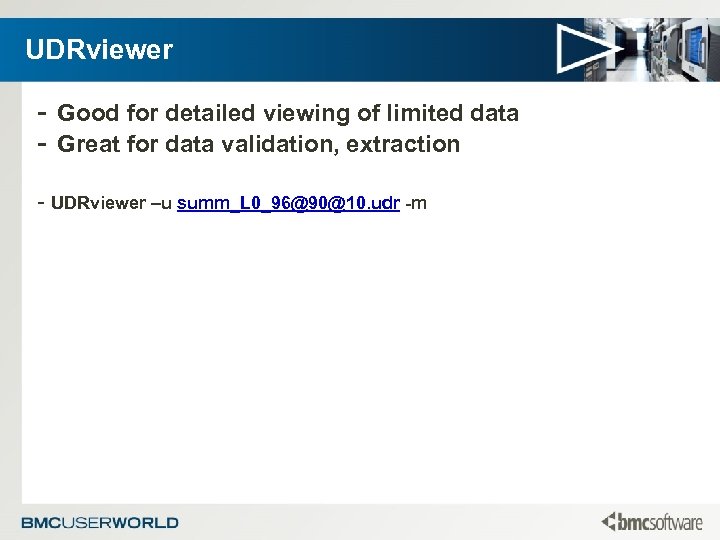 UDRviewer - Good for detailed viewing of limited data - Great for data validation, extraction - UDRviewer –u summ_L 0_96@90@10. udr -m
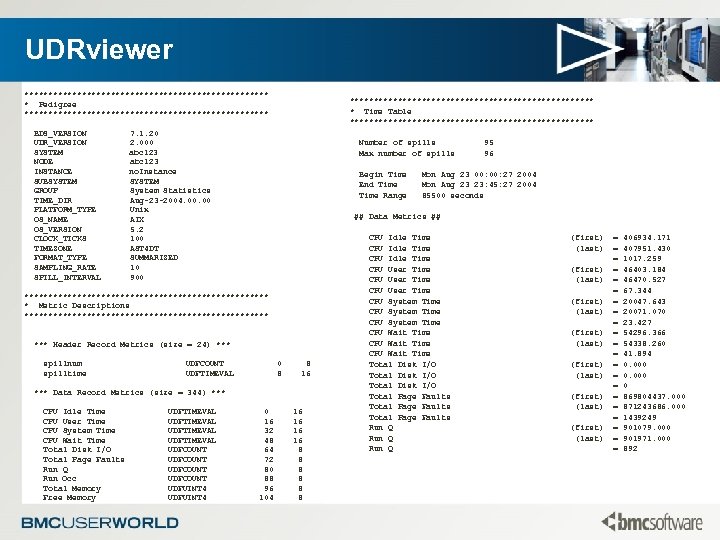 UDRviewer ************************** * Pedigree ************************** BDS_VERSION UDR_VERSION SYSTEM NODE INSTANCE SUBSYSTEM GROUP TIME_DIR PLATFORM_TYPE OS_NAME OS_VERSION CLOCK_TICKS TIMEZONE FORMAT_TYPE SAMPLING_RATE SPILL_INTERVAL ************************** * Time Table ************************** 7. 1. 20 2. 000 abc 123 no. Instance SYSTEM System Statistics Aug-23 -2004. 00 Unix AIX 5. 2 100 AST 4 DT SUMMARIZED 10 900 Number of spills Max number of spills Begin Time End Time Range *** Header Record Metrics (size = 24) *** UDFCOUNT UDFTIMEVAL 0 8 8 16 *** Data Record Metrics (size = 344) *** CPU Idle Time CPU User Time CPU System Time CPU Wait Time Total Disk I/O Total Page Faults Run Q Run Occ Total Memory Free Memory UDFTIMEVAL UDFCOUNT UDFUINT 4 Mon Aug 23 00: 27 2004 Mon Aug 23 23: 45: 27 2004 85500 seconds ## Data Metrics ## ************************** * Metric Descriptions ************************** spillnum spilltime 95 96 0 16 32 48 64 72 80 88 96 104 16 16 8 8 8 CPU Idle Time CPU User Time CPU System Time CPU Wait Time Total Disk I/O Total Page Faults Run Q (first) (last) (first) (last) = = = = = = 406934. 171 407951. 430 1017. 259 46403. 184 46470. 527 67. 344 20047. 643 20071. 070 23. 427 54296. 366 54338. 260 41. 894 0. 000 0 869804437. 000 871243686. 000 1439249 901079. 000 901971. 000 892
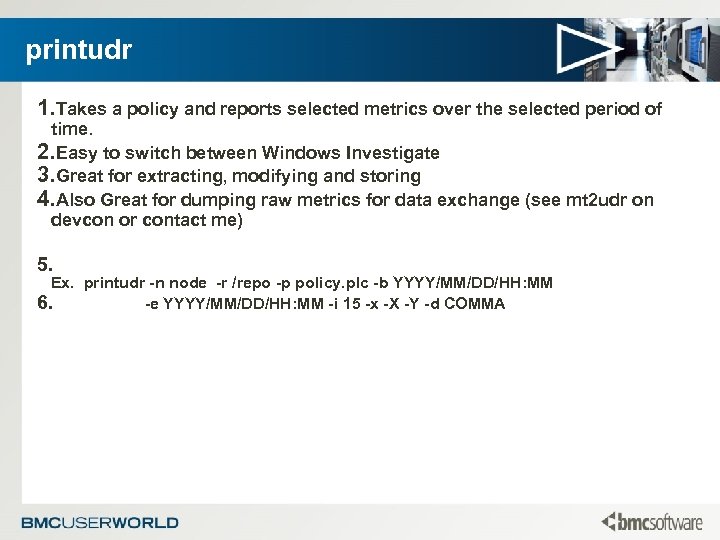 printudr 1. Takes a policy and reports selected metrics over the selected period of time. 2. Easy to switch between Windows Investigate 3. Great for extracting, modifying and storing 4. Also Great for dumping raw metrics for data exchange (see mt 2 udr on devcon or contact me) 5. Ex. printudr -n node -r /repo -p policy. plc -b YYYY/MM/DD/HH: MM 6. -e YYYY/MM/DD/HH: MM -i 15 -x -X -Y -d COMMA
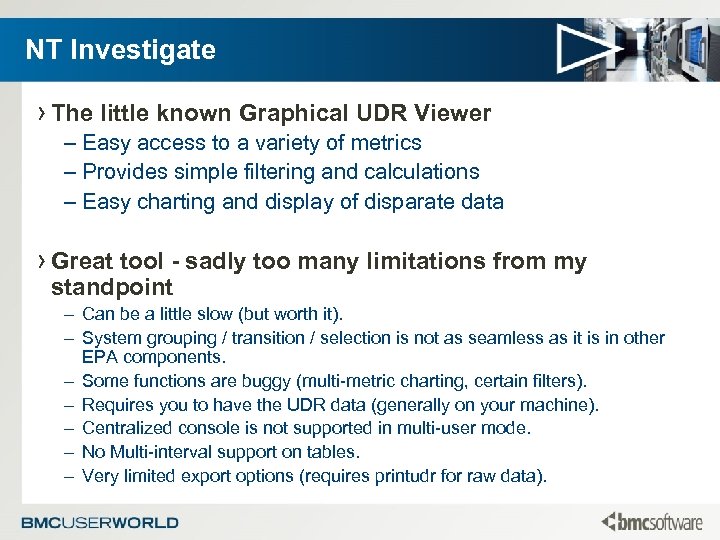 NT Investigate › The little known Graphical UDR Viewer – Easy access to a variety of metrics – Provides simple filtering and calculations – Easy charting and display of disparate data › Great tool - sadly too many limitations from my standpoint – Can be a little slow (but worth it). – System grouping / transition / selection is not as seamless as it is in other EPA components. – Some functions are buggy (multi-metric charting, certain filters). – Requires you to have the UDR data (generally on your machine). – Centralized console is not supported in multi-user mode. – No Multi-interval support on tables. – Very limited export options (requires printudr for raw data).
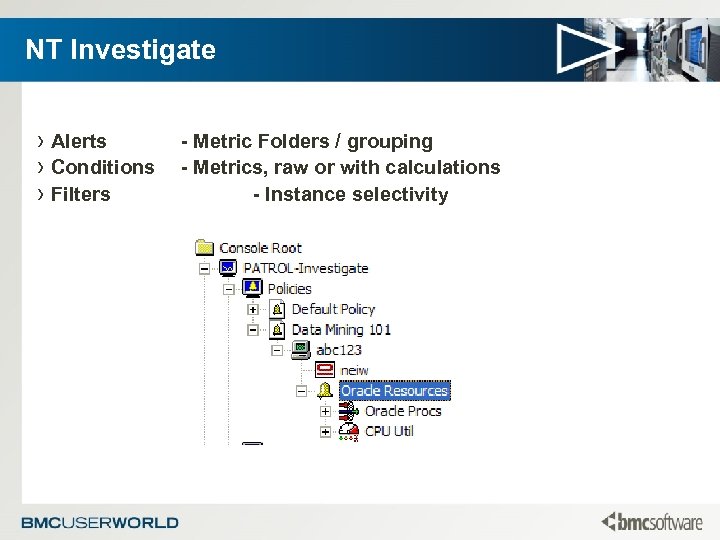 NT Investigate › Alerts › Conditions › Filters - Metric Folders / grouping - Metrics, raw or with calculations - Instance selectivity
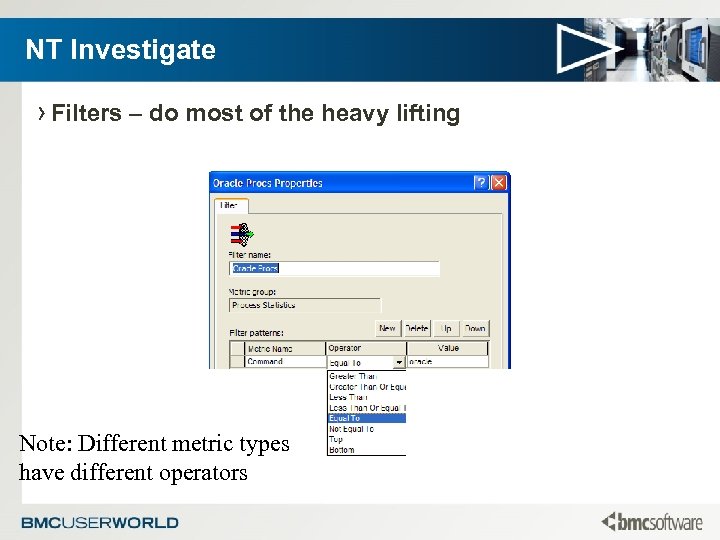 NT Investigate › Filters – do most of the heavy lifting Note: Different metric types have different operators
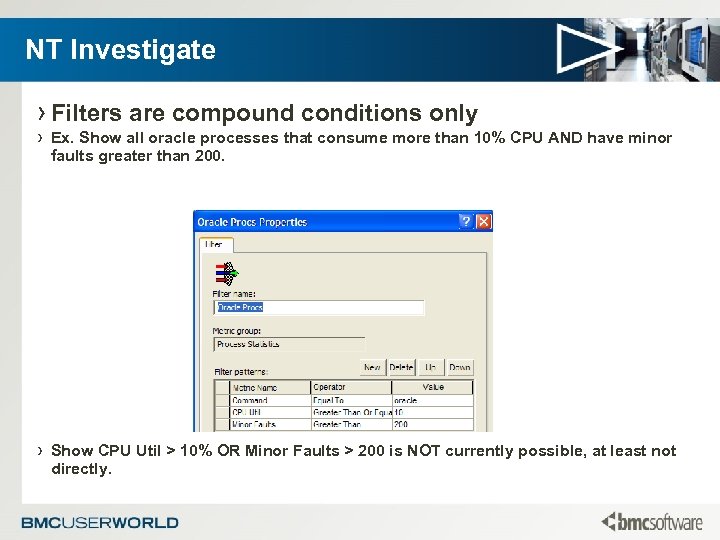 NT Investigate › Filters are compound conditions only › Ex. Show all oracle processes that consume more than 10% CPU AND have minor faults greater than 200. › Show CPU Util > 10% OR Minor Faults > 200 is NOT currently possible, at least not directly.
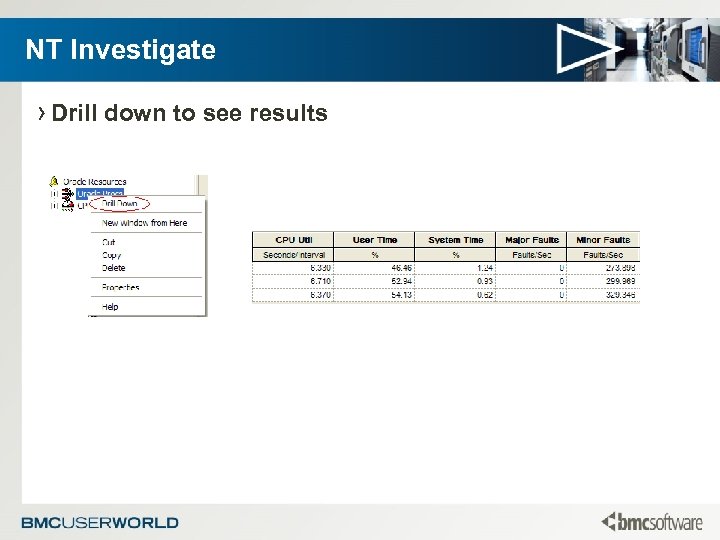 NT Investigate › Drill down to see results
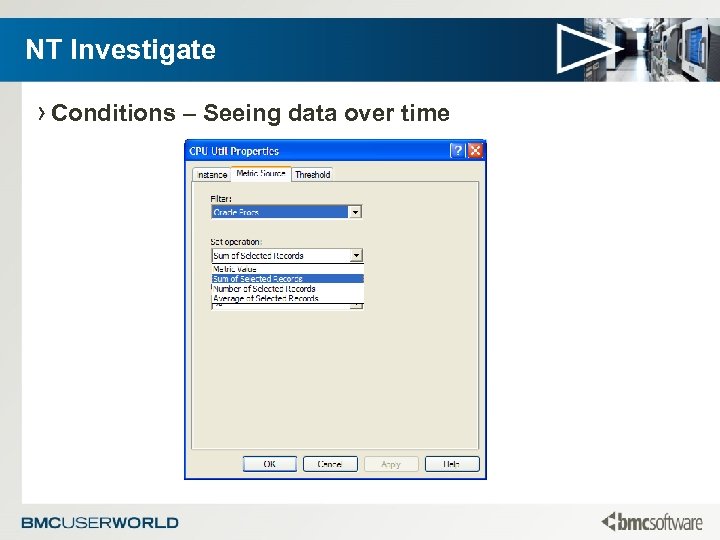 NT Investigate › Conditions – Seeing data over time
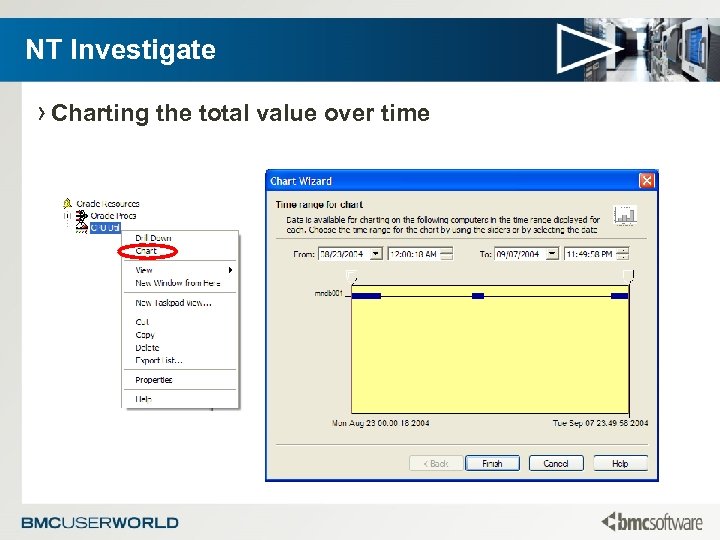 NT Investigate › Charting the total value over time
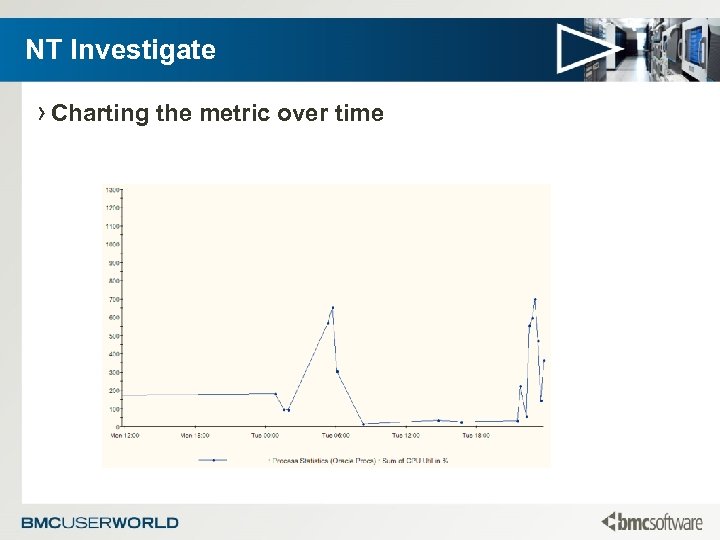 NT Investigate › Charting the metric over time
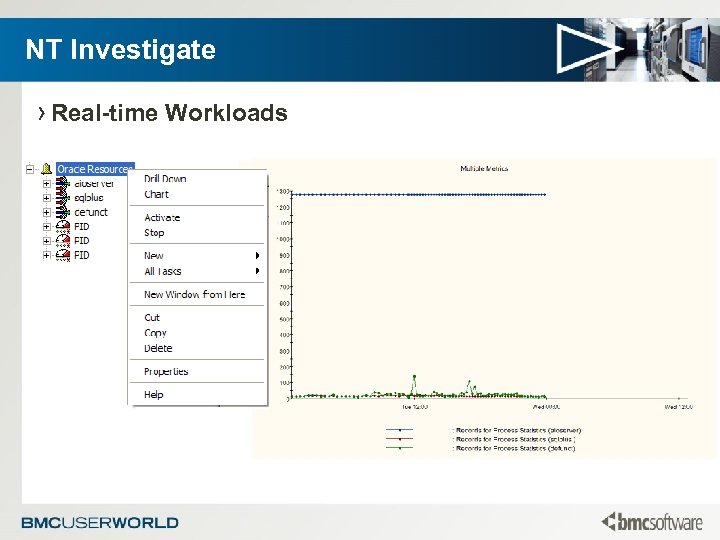 NT Investigate › Real-time Workloads
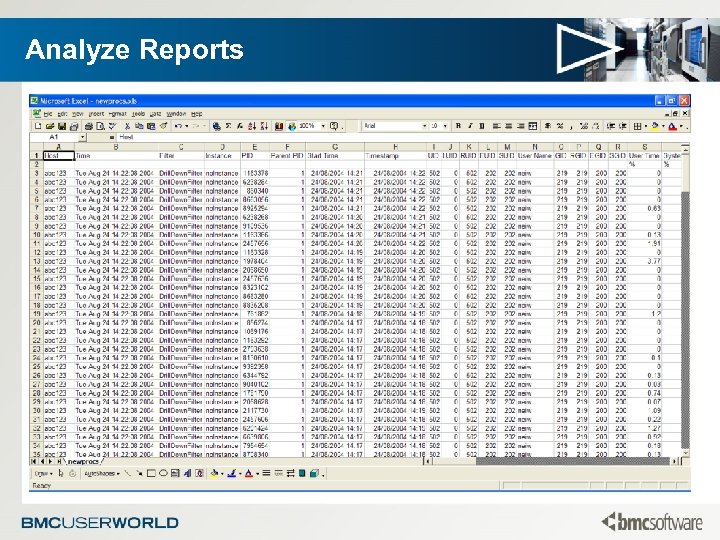
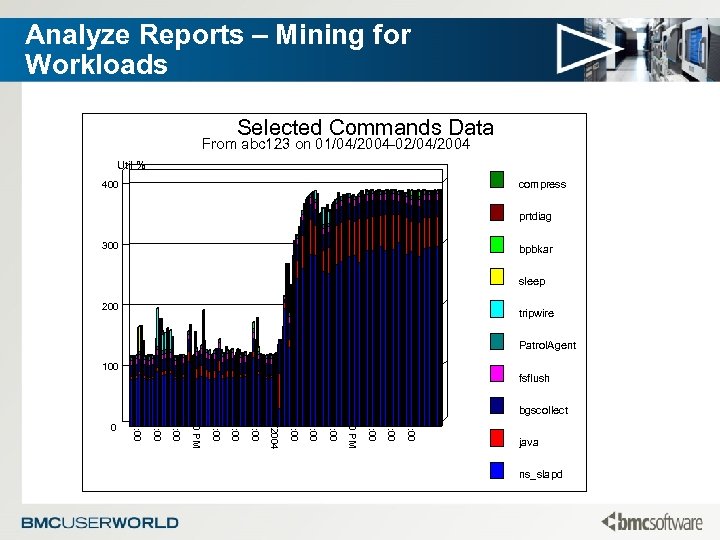
 Analyze Reports › A unique view of summarized data useful for ad-hoc analysis – Packed with valuable information. – Summarized for the selected interval – Metrics are lost but intelligence / expertise is added. – Small in size, generally transient and dependant on UDR › Generally best for – Understanding application behavior – Overall process detail – Discovering workloads › Best mined with – perl, and uhm, perl
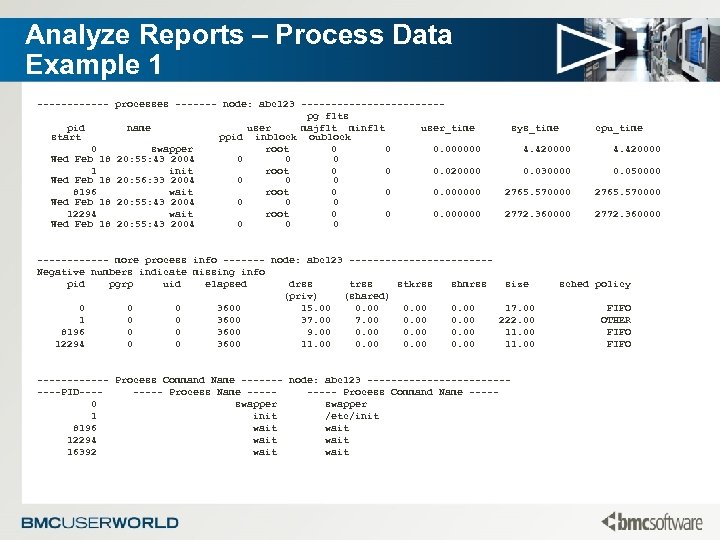 Analyze Reports – Process Data Example 1 ------ processes ------- node: abc 123 ------------pg flts pid name user majflt minflt user_time start ppid inblock oublock 0 swapper root 0 0 0. 000000 Wed Feb 18 20: 55: 43 2004 0 0 0 1 init root 0 0 0. 020000 Wed Feb 18 20: 56: 33 2004 0 0 0 8196 wait root 0 0 0. 000000 Wed Feb 18 20: 55: 43 2004 0 0 0 12294 wait root 0 0 0. 000000 Wed Feb 18 20: 55: 43 2004 0 0 0 sys_time cpu_time 4. 420000 0. 030000 0. 050000 2765. 570000 2772. 360000 ------ more process info ------- node: abc 123 ------------Negative numbers indicate missing info pid pgrp uid elapsed drss trss stkrss shmrss size (priv) (shared) 0 0 0 3600 15. 00 0. 00 17. 00 1 0 0 3600 37. 00 0. 00 222. 00 8196 0 0 3600 9. 00 0. 00 11. 00 12294 0 0 3600 11. 00 0. 00 11. 00 ------ Process Command Name ------- node: abc 123 --------------PID---- Process Name ----- Process Command Name ----0 swapper 1 init /etc/init 8196 wait 12294 wait 16392 wait sched policy FIFO OTHER FIFO
 Analyze Reports
 Analyze Reports – Mining for Workloads Selected Commands Data From abc 123 on 01/04/2004 -02/04/2004 Util % compress 400 prtdiag 300 bpbkar sleep 200 tripwire Patrol. Agent 100 bgscollect 9: 00 6: 00 3: 00 12: 00 PM 9: 00 6: 00 3: 00 04/08/2004 9: 00 6: 00 3: 00 12: 00 PM 9: 00 6: 00 3: 00 0 fsflush java ns_slapd
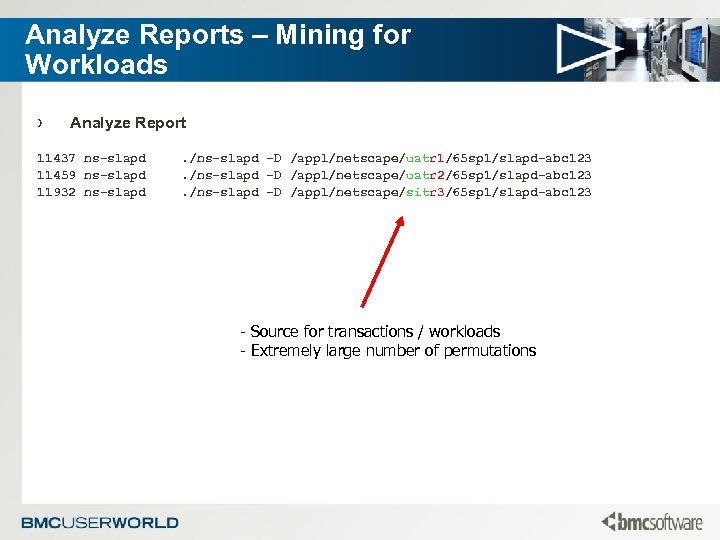 Analyze Reports – Mining for Workloads › Analyze Report 11437 ns-slapd 11459 ns-slapd 11932 ns-slapd . /ns-slapd -D /appl/netscape/uatr 1/65 sp 1/slapd-abc 123. /ns-slapd -D /appl/netscape/uatr 2/65 sp 1/slapd-abc 123. /ns-slapd -D /appl/netscape/sitr 3/65 sp 1/slapd-abc 123 - Source for transactions / workloads - Extremely large number of permutations
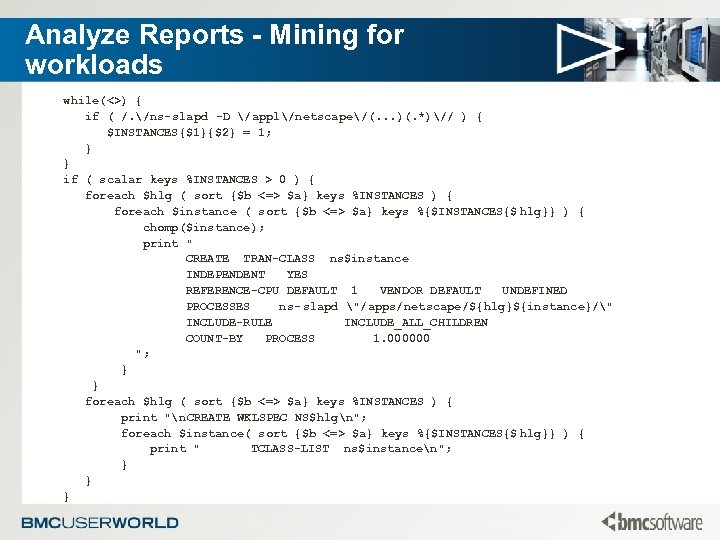 Analyze Reports - Mining for workloads while(<>) { if ( /. /ns-slapd -D /appl/netscape/(. . . )(. *)// ) { $INSTANCES{$1}{$2} = 1; } } if ( scalar keys %INSTANCES > 0 ) { foreach $hlg ( sort {$b <=> $a} keys %INSTANCES ) { foreach $instance ( sort {$b <=> $a} keys %{$INSTANCES{$ hlg}} ) { chomp($instance); print " CREATE TRAN-CLASS ns$instance INDEPENDENT YES REFERENCE-CPU DEFAULT 1 VENDOR DEFAULT UNDEFINED PROCESSES ns- slapd "/apps/netscape/${hlg}${instance}/" INCLUDE-RULE INCLUDE_ALL_CHILDREN COUNT-BY PROCESS 1. 000000 "; } } foreach $hlg ( sort {$b <=> $a} keys %INSTANCES ) { print "n. CREATE WKLSPEC NS$hlgn"; foreach $instance( sort {$b <=> $a} keys %{$INSTANCES{$ hlg}} ) { print " TCLASS-LIST ns$instancen"; } } }
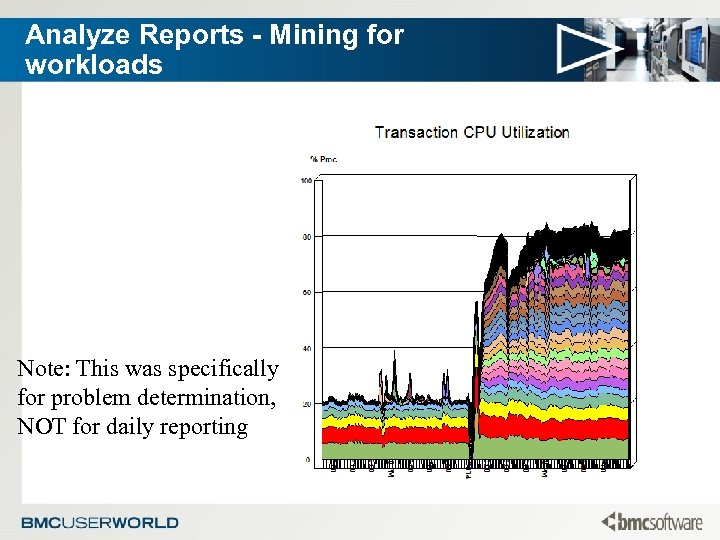 Analyze Reports - Mining for workloads Note: This was specifically for problem determination, NOT for daily reporting
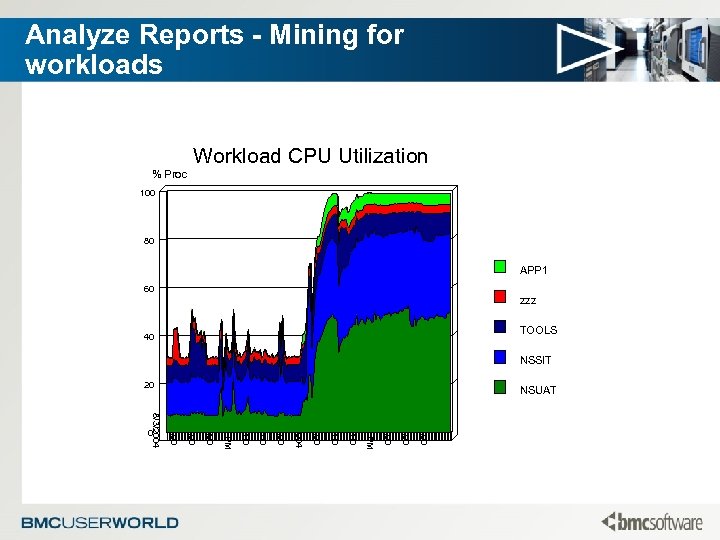 Analyze Reports - Mining for workloads Workload CPU Utilization % Proc 100 80 APP 1 60 zzz TOOLS 40 NSSIT 20 9: 00 6: 00 3: 00 12: 00 PM 9: 00 6: 00 3: 00 8/4/2004 9: 00 6: 00 3: 00 12: 00 PM 9: 00 6: 00 3: 00 8/3/2004 0 NSUAT
 Typical mining data sources › Visualizer database – Typically the greatest amount of history – Higher level information – Summarized / processed in a variety of useful ways. › Best mined with – SQL / Excel / … – Homegrown Web – Other?
 Performance Surveyor Designed from the ground up to provide Performance Assurance Customers with; – ITIL Based Capacity Planning Reports – Powerful and easy to use Data Analysis – Integrated Data Analytics similar to those of SAS® and Excel® without the need to manage an interface between products.
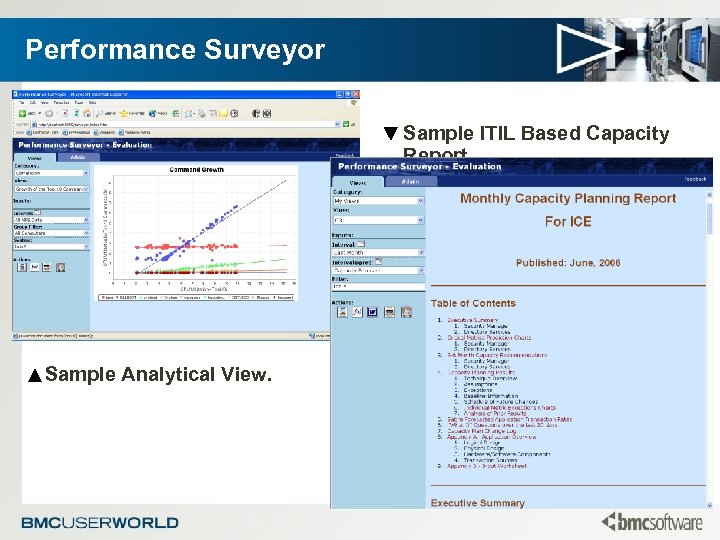 Performance Surveyor ▼ Sample ITIL Based Capacity Report. ▲Sample Analytical View.
 Performance Surveyor Leverages the Perceive infrastructure to provide; – Access to any external data for incorporation into your reports / analysis. – Immediate access to all defined systems, groups and custom intervals. – Simple / seamless access to data regardless of platform or physical location. Extends Perceive into an Analyst’s toolkit by adding; – Out of the box mapping of more than 90% of the Visualizer Schema – Group charts (multiple systems per chart) – Object level data selection (i. e. individual processes, disks, filesystems) – Data transformation functions that allow you to easily filter, calculate, categorize and manipulate data. – Dynamic SQL
 Performance Surveyor › To be effective, data mining needs to be easy to use and repeatable – Every data mining tool, technique and example presented so far has required a certain amount of “ad -hoc” processing to occur. – Each typically requires several time-consuming steps to produce a worthwhile result. – Each tends to be localized on a specific system. – Many require intimate knowledge of data internals (UDR structures, database schemas, etc. . ) – Automated distribution of data is difficult, time consuming and requires resources to maintain. › Surveyor has been designed to simplify this process, create easy to use repeatable templates and, with the help of Publisher, automate the generation and
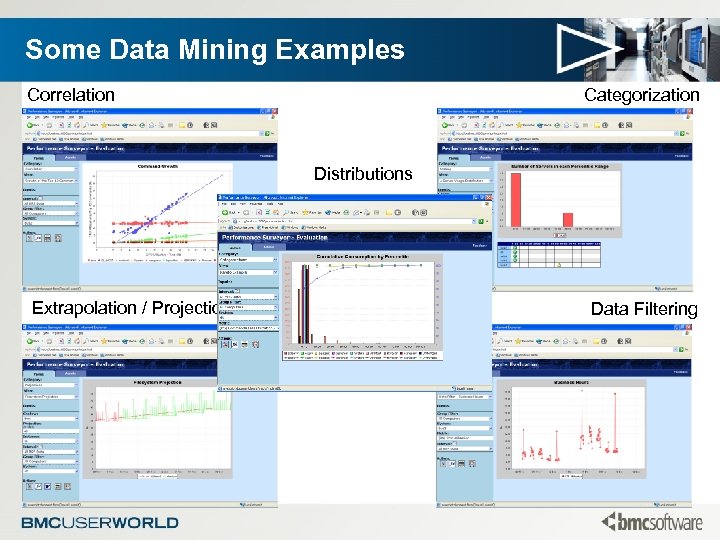 Some Data Mining Examples Correlation Categorization Distributions Extrapolation / Projection Data Filtering
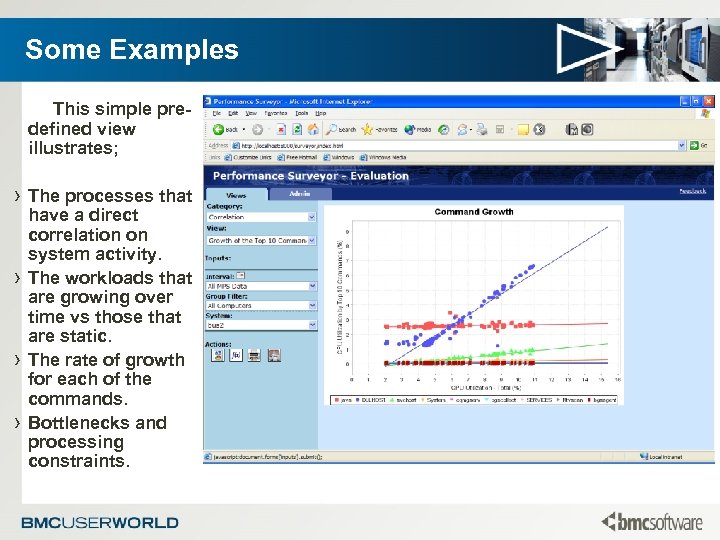 Some Examples This simple predefined view illustrates; › The processes that › › › have a direct correlation on system activity. The workloads that are growing over time vs those that are static. The rate of growth for each of the commands. Bottlenecks and processing constraints.
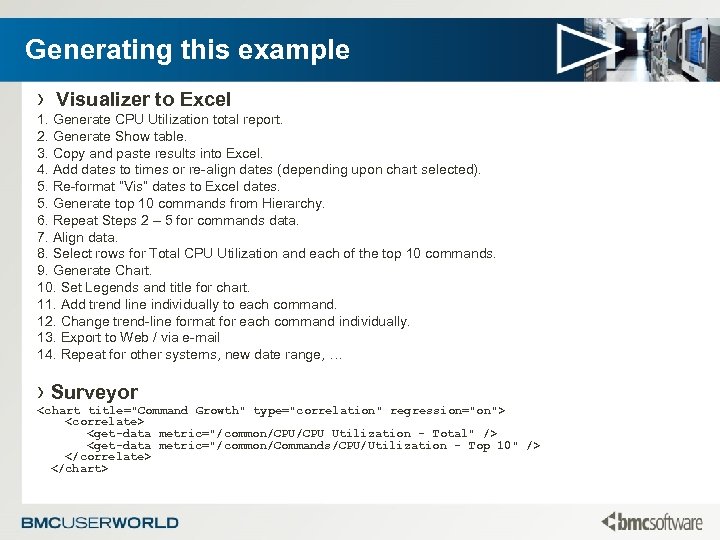 Generating this example › Visualizer to Excel 1. Generate CPU Utilization total report. 2. Generate Show table. 3. Copy and paste results into Excel. 4. Add dates to times or re-align dates (depending upon chart selected). 5. Re-format “Vis” dates to Excel dates. 5. Generate top 10 commands from Hierarchy. 6. Repeat Steps 2 – 5 for commands data. 7. Align data. 8. Select rows for Total CPU Utilization and each of the top 10 commands. 9. Generate Chart. 10. Set Legends and title for chart. 11. Add trend line individually to each command. 12. Change trend-line format for each command individually. 13. Export to Web / via e-mail 14. Repeat for other systems, new date range, … › Surveyor
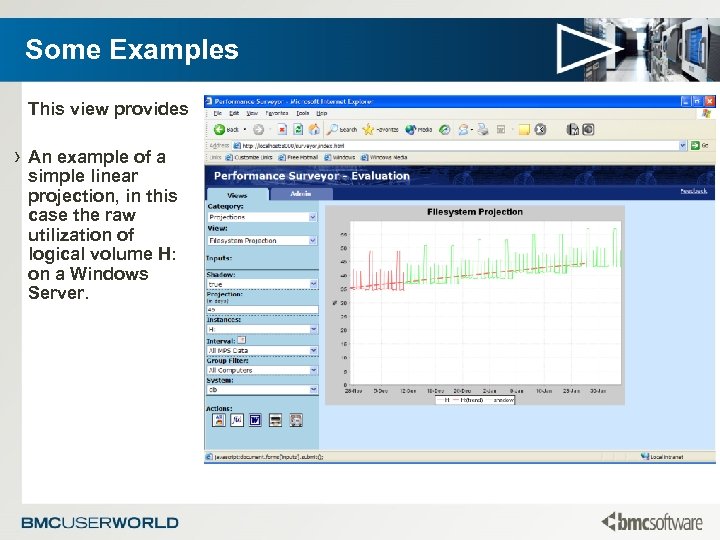 Some Examples This view provides › An example of a simple linear projection, in this case the raw utilization of logical volume H: on a Windows Server.
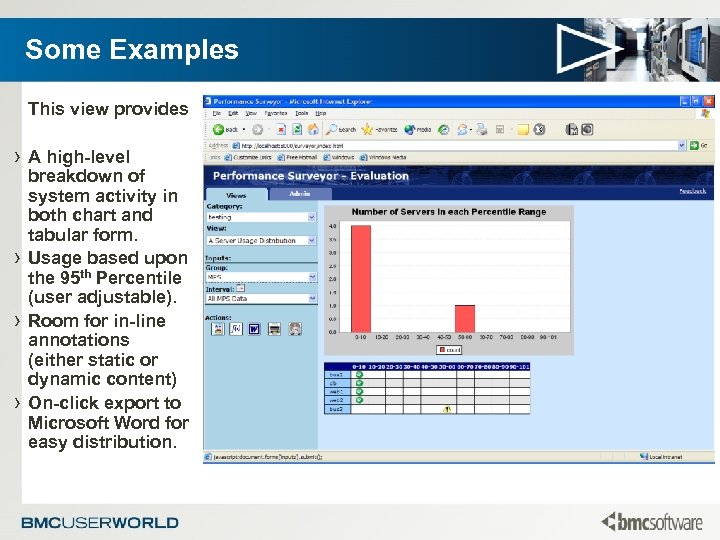 Some Examples This view provides › A high-level › › › breakdown of system activity in both chart and tabular form. Usage based upon the 95 th Percentile (user adjustable). Room for in-line annotations (either static or dynamic content) On-click export to Microsoft Word for easy distribution.
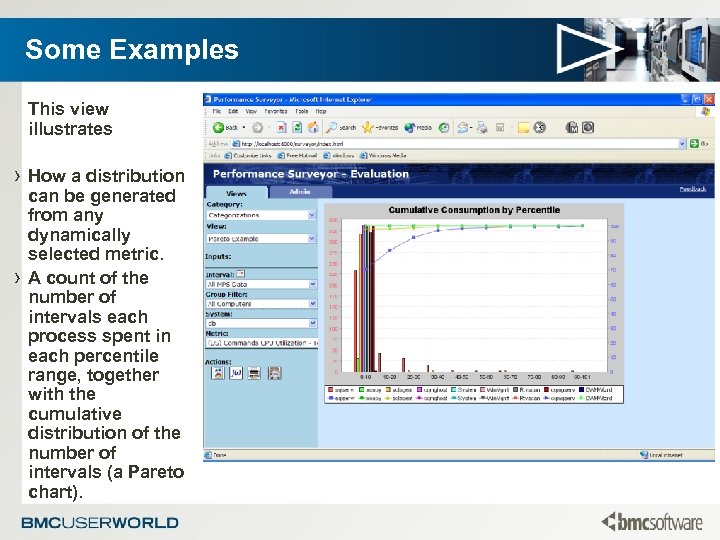 Some Examples This view illustrates › How a distribution › can be generated from any dynamically selected metric. A count of the number of intervals each process spent in each percentile range, together with the cumulative distribution of the number of intervals (a Pareto chart).
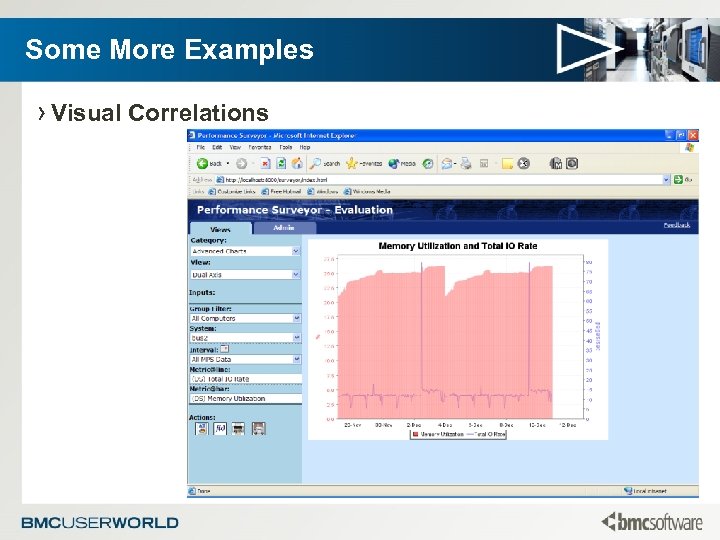 Some More Examples › Visual Correlations
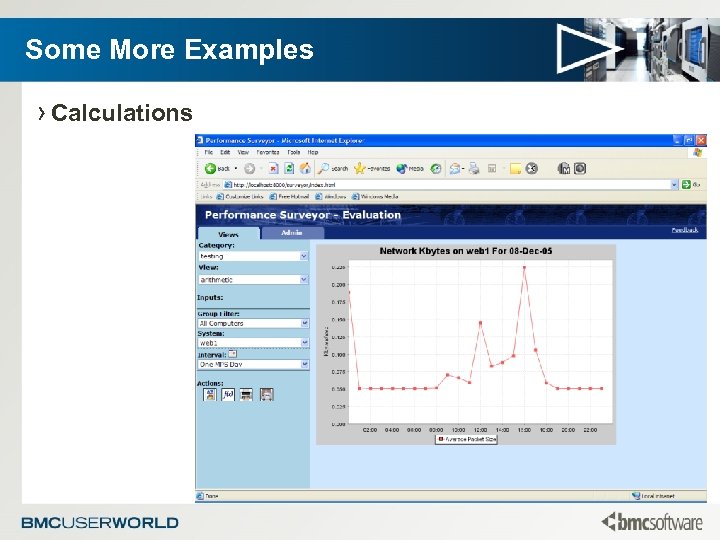 Some More Examples › Calculations
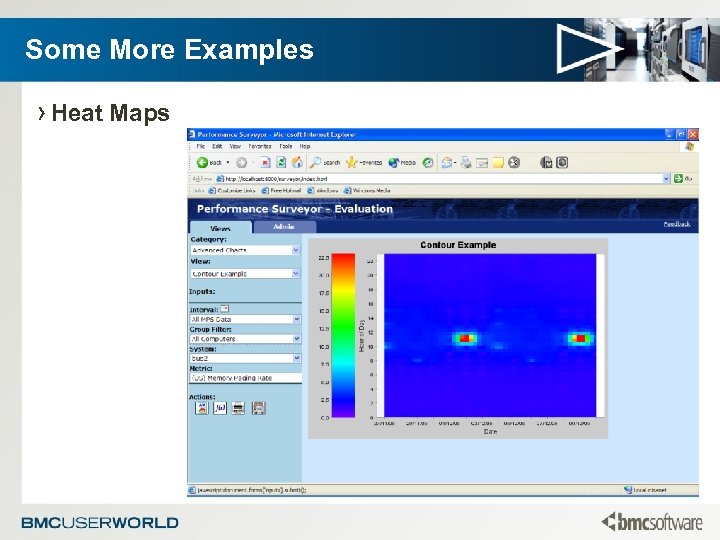 Some More Examples › Heat Maps
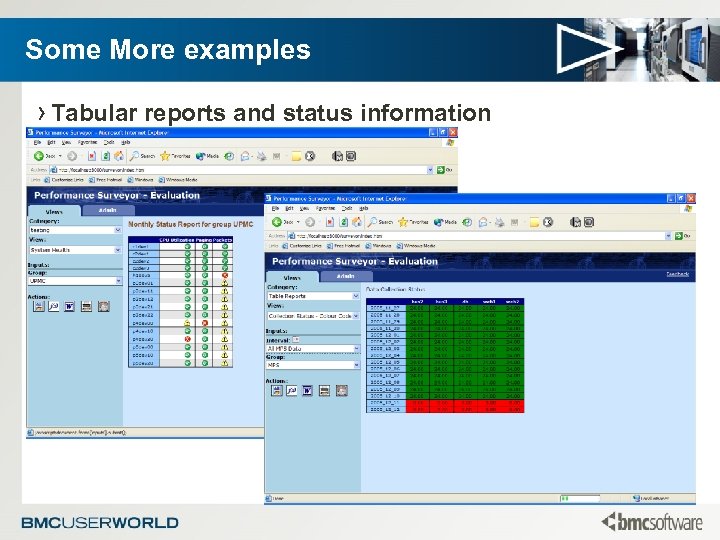 Some More examples › Tabular reports and status information
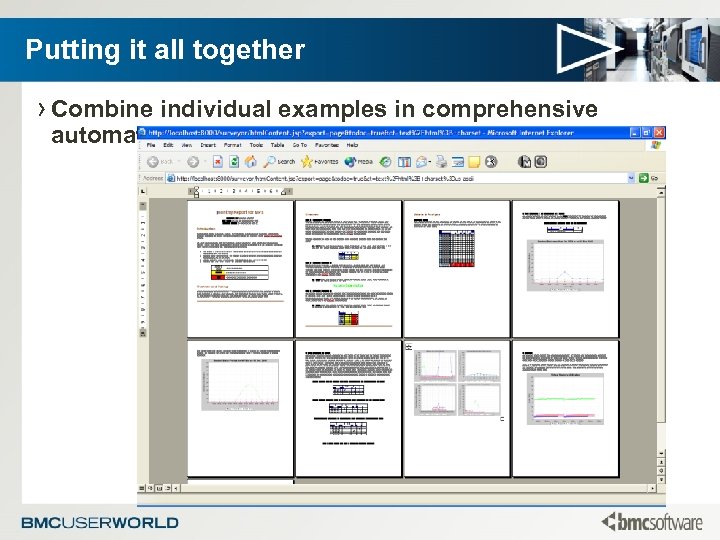 Putting it all together › Combine individual examples in comprehensive automated reports!
 Looking forward › Configuration Management information is increasingly becoming a critical factor in any data analysis / data mining and reporting initiative. › Managed properly the CMDB provides important contextual information such as; – Where are things located and when was it there? – Clusters - Which systems work together and how? – What type of processing is taking place and when does it occur? – What are the real transaction volumes? – What is the true processing capacity of the system? – Who uses it and why? › There are many products, many standards and many implementations. – Surveyor is flexible enough to work with any approach that you chose. We are actively working with customers for ways to incorporate this
 Conclusion › There are many data sources to mine each with their own strengths and weaknesses. › It is important to understand the available data, it’s unique characteristics and suitability to be mined for different purposes. › Sadly there isn’t a single tool that can mine everything but it is a good, albeit ambitious, goal. › Having a tool like Surveyor will help you to streamline your analysis allowing you to get through more data more quickly, thoroughly and more often. We hope that you’ll take the time to do an extended free trial of the solution.
 For more information › Please feel free to contact me directly perry@cfsolutions-inc. com › Go to or refer to Boyd Stowe’s User World presentation DISII-101 › Via devcon http: //devcon. bmc. com/phpbb 2/index. php? c=9


