

be1ebe777790160a4a324253bce6d9b2.ppt
- Количество слайдов: 62
 Mineral Resources l l Society and standard of living critically dependent upon availability of mineral and energy resources Mineral resources here, energy in the next chapter
 A few of the many mineral products in the typical American home
 Mineral Resources Use of minerals in the US > than 18, 000 lbs person each year
 Mineral Resources l l Infrastructure of manufacturing, transportation equipment, etc. F Capital, material, energy for manufacture and transportation Much of history (including wars) can be explained in terms of haves and have-nots with respect to mineral and energy wealth
 Flow diagram of non-fuel mineral resources & their role in US economy Value of processed materials = $351 Billion (310 domestic + 41 imported) = ~ 5% of GDP, but GDP would be much lower without it
 Mineral Resources are all around us, but too dispersed to be of any value l Economic implications! F Never completely run out of anything F Simply become too expensive to produce Mineral deposits when concentrated by various geologic processes since Earth created ~ 4. 5 Ga l
 Very valuable minerals- dispersed, but worth scavanging Example: Kimberlite pipes and") Igneous Processes 1) Very valuable minerals- dispersed, but worth scavanging Example: Kimberlite pipes and diamonds
Igneous Processes 1) Very valuable minerals- dispersed, but worth scavanging Example: Kimberlite pipes and diamonds
 Igneous Concentration Mechanisms: a) Crystal settling") Igneous Processes 2) Igneous Concentration Mechanisms: a) Crystal settling
Igneous Processes 2) Igneous Concentration Mechanisms: a) Crystal settling
 Igneous Concentration Mechanisms: b) Concentrating in residual liquids as magma crystallizes") Igneous Processes 2) Igneous Concentration Mechanisms: b) Concentrating in residual liquids as magma crystallizes Water and many rare elements don’t incorporate in common minerals Remain and concentrate in late melts at the top of a pluton Often the water pressure in the late melts builds to the point that it fractures the overlying rock and material escapes as hydrothermal fluids
Igneous Processes 2) Igneous Concentration Mechanisms: b) Concentrating in residual liquids as magma crystallizes Water and many rare elements don’t incorporate in common minerals Remain and concentrate in late melts at the top of a pluton Often the water pressure in the late melts builds to the point that it fractures the overlying rock and material escapes as hydrothermal fluids
 Igneous Concentration Mechanisms: b) Concentrating in residual liquids Examples: F Pegmatites:") Igneous Processes 2) Igneous Concentration Mechanisms: b) Concentrating in residual liquids Examples: F Pegmatites: Water-rich melts with concentrations of otherwise rare elements: gems, Li (batteries), Be, REE (semiconductors) F Hydrothermal Cu, Ag, Hg, Pb, Zn. . s Porphry Cu at subduction zones late fluids veins and cracks or more permeating s Massive sulfide Cu: at mid-ocean ridges (now found where subducted, uplifted, and eroded)
Igneous Processes 2) Igneous Concentration Mechanisms: b) Concentrating in residual liquids Examples: F Pegmatites: Water-rich melts with concentrations of otherwise rare elements: gems, Li (batteries), Be, REE (semiconductors) F Hydrothermal Cu, Ag, Hg, Pb, Zn. . s Porphry Cu at subduction zones late fluids veins and cracks or more permeating s Massive sulfide Cu: at mid-ocean ridges (now found where subducted, uplifted, and eroded)
 8 cm tourmaline crystals from pegmatite Contact metamorphic deposits A typical cupola area at the roof of a pluton 5 mm gold from a hydrothermal deposit
 “Black smoker” on the East Pacific Rise: Fe-Cu-Zn sulfide precipitates Massive sulfides occur at mid-ocean ridges where recirculating seawater helps withdraw ore and concentrates it as it cools again when it reaches the seabed
 slivers of oceanic crust l Exploration techniques use models F Plate tectonics is a very useful model s s l Subduction zones locate porphry Cu Massive sulfides may be found where oceanic crust slivers onto continents Also use geophysics and geochemistry to locate ores Porphry Cu deposits in the Americas
 Metamorphic Concentration Mechanisms: Contact metamorphism occurs at the contact between hot") Metamorphic Processes 3) Metamorphic Concentration Mechanisms: Contact metamorphism occurs at the contact between hot magma and cool country rocks replacement ores (include Cu, W, Sn, Pb, Zn…) Fluorite (Ca. F 2) Calcite (Ca. CO 3) Sphalerite (Zn. S) Scheelite (Ca. WO 4) Replacement ore of the Tem-Piute Mine, Nevada. Mined for tungsten.
Metamorphic Processes 3) Metamorphic Concentration Mechanisms: Contact metamorphism occurs at the contact between hot magma and cool country rocks replacement ores (include Cu, W, Sn, Pb, Zn…) Fluorite (Ca. F 2) Calcite (Ca. CO 3) Sphalerite (Zn. S) Scheelite (Ca. WO 4) Replacement ore of the Tem-Piute Mine, Nevada. Mined for tungsten.
 Metamorphic Concentration Mechanisms: Regional metamorphism occurs over broad areas due to") Metamorphic Processes 3) Metamorphic Concentration Mechanisms: Regional metamorphism occurs over broad areas due to mountain-building processes local concentrations of talc, graphite, asbestos, garnet & corundum (abrasives) Fist-sized garnets created by regional metamorphism, Gore Mt, New York. Mined for sandpaper.
Metamorphic Processes 3) Metamorphic Concentration Mechanisms: Regional metamorphism occurs over broad areas due to mountain-building processes local concentrations of talc, graphite, asbestos, garnet & corundum (abrasives) Fist-sized garnets created by regional metamorphism, Gore Mt, New York. Mined for sandpaper.
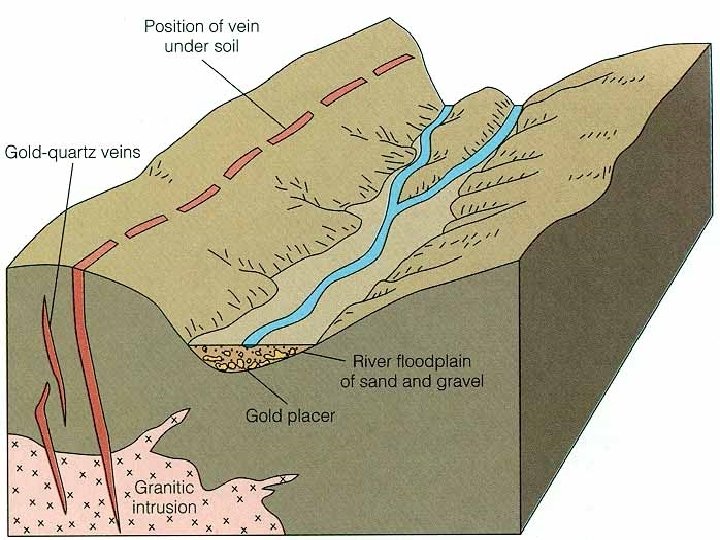
 Sedimentary Concentration Mechanisms: Clastic processes involve transport and deposition: Sand gravel") Sedimentary Processes 4) Sedimentary Concentration Mechanisms: Clastic processes involve transport and deposition: Sand gravel (big $$) from old river channels, glacial deposits, deltas F Placer deposits of weathering-resistant and heavy minerals (Au, Ag, diamond, garnet) F Gold nugget, California (2 cm) Placer diamonds, Namibia (3 cm across)
Sedimentary Processes 4) Sedimentary Concentration Mechanisms: Clastic processes involve transport and deposition: Sand gravel (big $$) from old river channels, glacial deposits, deltas F Placer deposits of weathering-resistant and heavy minerals (Au, Ag, diamond, garnet) F Gold nugget, California (2 cm) Placer diamonds, Namibia (3 cm across)
 California’s gold rush of the 1848 -1880: Numbers are thousands of ft 2 of rock debris washed down from the hills or accumulated in the bay Record nugget was 162 lbs of pure gold One miner recovered 30 lbs of gold from 4 ft 2 in a month Miners at the Volcano camp sometimes found $370 worth of gold in a single panful
 Sedimentary Concentration Mechanisms: Precipitates: Marine: limestone, phosphate, Precambrian Fe ores (over") Sedimentary Processes 4) Sedimentary Concentration Mechanisms: Precipitates: Marine: limestone, phosphate, Precambrian Fe ores (over 700, 000 yrs ago when more oxidizing atmosphere), Mn nodules, evaporites (salt, gypsum) plus K, B, some metal-rich brines F Fresh-water precipitates are rarely economic F
Sedimentary Processes 4) Sedimentary Concentration Mechanisms: Precipitates: Marine: limestone, phosphate, Precambrian Fe ores (over 700, 000 yrs ago when more oxidizing atmosphere), Mn nodules, evaporites (salt, gypsum) plus K, B, some metal-rich brines F Fresh-water precipitates are rarely economic F
 Figure 14 -8: Marine evaporite deposits of the USA
 Sedimentary Concentration Mechanisms: Biological deposits: Phosphate = fish bones and teeth,") Sedimentary Processes 4) Sedimentary Concentration Mechanisms: Biological deposits: Phosphate = fish bones and teeth, guano fertilizers F Diatomaceous earth & many limestones F Weathering: Bauxite = Al in zone of leaching in laterites (highly leached tropical soils) F Supergene enrichment of Cu F
Sedimentary Processes 4) Sedimentary Concentration Mechanisms: Biological deposits: Phosphate = fish bones and teeth, guano fertilizers F Diatomaceous earth & many limestones F Weathering: Bauxite = Al in zone of leaching in laterites (highly leached tropical soils) F Supergene enrichment of Cu F
 Mineral Resources The time-frame of resources is important l Non-renewable resources are created on our time-scale (won’t add much in next 10 Ma) F No sustained yield like crops, timber… “Resources” = useful materials that can be extracted and made into a useful commodity at a profit (either now or in the reasonable future) l “Reserves” = that portion of a resource that is identified and currently available (legally and economically extractable at the time of evaluation) Resources thus = reserves + sub-economic + speculative estimates l
 Figure 14. 2: USGS classification of mineral resources Identified Economic Reserves Marginally Economic Marginal Reserves Undiscovered In known districts Hypothetical Resources In undiscovered districts or forms Speculative Resources Subeconomic Resources Increasing degree of geological assurance
 Mineral Resources Consumption, Resources, and Availability The typical evolution curve for a non-renewable resource
 (2) time Growth stages: 1) Demand increases") production rate Consumption, Resources, and Availability (1) (2) time Growth stages: 1) Demand increases exponentially For non-renewable resources: 2) Deplete the easy to find, highly concentrated and shallow resources Much depends on our ability to keep these resources in production
production rate Consumption, Resources, and Availability (1) (2) time Growth stages: 1) Demand increases exponentially For non-renewable resources: 2) Deplete the easy to find, highly concentrated and shallow resources Much depends on our ability to keep these resources in production
 Consumption, Resources, and Availability When do we do when we run out? ? 17 Average Crustal Rocks 16 15 High-U Granites 14 Black Shales 13 Log Rock Tonnage 12 Phosphoria Formation 11 10 Original Rich U finds 9 8 7 6 5 4 3 Grade vs. Quantity of Uranium in the upper km of crust in the USA Probable Richest Ore 2 1 0 0. 1 1 10 0. 01 100 0. 1 1, 000 1 10 100 % 10, 000 ppm Uranium Concentration
 Foreign sources In USA") Availability and Demand of 32 “Critical” Non-fuel Mineral Commodities (1978) Foreign sources In USA Reserves/Cumulative Commodity (% Imported) Demand 1978 -2000 % Produced Demand (tons) US Chromium Manganese Cobalt Titanium Columbium Tin Platinum Group Antimony Nickel Aluminum Asbestos Fluorine Zinc Silver Gold Tungsten Potash Cadmium World < 0. 1 9. 5 USSR 41, South Africa 15 0 500, 000 0 1, 300, 000 0 4. 6 Gabon 29, Brazil 18 0 8, 600 0 1. 2 Zaire 62 0 750 0 1. 2 Malaysia, Thailand, Canada 0 2, 600 0 > 10 Brazil 57, Canada 14 0 50, 000 0. 1 1. 5 Malaysia 50, Bolivia 18 0 3 South Africa 74, USSR 8 0. 2 65 6 6 16, 000 170, 000 0. 1 < 0. 1 1. 8 2. 2 South Africa 38, Bolivia 16 Canada 56, New Caledonia 9 8 5, 300, 000 < 0. 1 5. 8 Jamaica 28, Austalia 23 16 580, 000 0. 2 0. 5 Canada 94, South Africa 4 18 550, 000 0. 1 0. 4 Mexico 59, South Africa 17 31 1, 000 0. 6 0. 8 Canada 42, Mexico 6 33 3, 500 0. 4 0. 5 Canada 46, Mexico 24 0. 6 1. 1 Canada 14, USSR 33 38 39 8, 700 5, 900, 000 0. 4 0. 9 1. 4 > 10 Canada 25, Bolivia 19 Canada 95, Israel 3 39 5, 100 1. 1 Mexico 59, South Africa 17
Availability and Demand of 32 “Critical” Non-fuel Mineral Commodities (1978) Foreign sources In USA Reserves/Cumulative Commodity (% Imported) Demand 1978 -2000 % Produced Demand (tons) US Chromium Manganese Cobalt Titanium Columbium Tin Platinum Group Antimony Nickel Aluminum Asbestos Fluorine Zinc Silver Gold Tungsten Potash Cadmium World < 0. 1 9. 5 USSR 41, South Africa 15 0 500, 000 0 1, 300, 000 0 4. 6 Gabon 29, Brazil 18 0 8, 600 0 1. 2 Zaire 62 0 750 0 1. 2 Malaysia, Thailand, Canada 0 2, 600 0 > 10 Brazil 57, Canada 14 0 50, 000 0. 1 1. 5 Malaysia 50, Bolivia 18 0 3 South Africa 74, USSR 8 0. 2 65 6 6 16, 000 170, 000 0. 1 < 0. 1 1. 8 2. 2 South Africa 38, Bolivia 16 Canada 56, New Caledonia 9 8 5, 300, 000 < 0. 1 5. 8 Jamaica 28, Austalia 23 16 580, 000 0. 2 0. 5 Canada 94, South Africa 4 18 550, 000 0. 1 0. 4 Mexico 59, South Africa 17 31 1, 000 0. 6 0. 8 Canada 42, Mexico 6 33 3, 500 0. 4 0. 5 Canada 46, Mexico 24 0. 6 1. 1 Canada 14, USSR 33 38 39 8, 700 5, 900, 000 0. 4 0. 9 1. 4 > 10 Canada 25, Bolivia 19 Canada 95, Israel 3 39 5, 100 1. 1 Mexico 59, South Africa 17
 Foreign sources In USA") Availability and Demand of 32 “Critical” Non-fuel Mineral Commodities (1978) Foreign sources In USA Reserves/Cumulative Commodity (% Imported) Demand 1978 -2000 % Produced Demand (tons) US Selenium Berylluim Mercury Titanium Iron Barite Lead Vanadium Copper Sulfur Rare Earths Lithium Phosphate Molybdenum World 42 43 500 63 1. 9 3. 1 3. 5 > 10 Canada 46, Mexico 24 Brazil 56, Argentina 21 43 48 2, 000 460, 000 0. 3 1. 4 0. 9 4. 1 Algeria 31, Spain 31 Australia 48, Canada 22 58 87, 000 1. 5 5. 1 Canada 39, Japan 17 60 2, 500, 000 1. 3 Peru 28, Ireland 22 76 700, 000 1. 1 Canada 27, Mexico 26 76 6, 300 0. 2 7. 8 South Africa 54, Chile 26 77 1, 700, 000 1. 5 1. 6 Canada 24, Chile 24 90 13, 000 0. 5 0. 9 Canada 59, Mexico 39 90 144 18, 000 3, 900 9. 3 2. 8 8. 0 - Australia 43, Malaysia 32 180 34, 000 3. 6 6. 5 200 30, 000 2. 9 2. 1 • Only 12 have cumulative demand < domestic supplies by 2000 • Only last 3 does US produce as much as we consume in US each year (Li, P, Mo) • Reserves of > ½ used up by 2020
Availability and Demand of 32 “Critical” Non-fuel Mineral Commodities (1978) Foreign sources In USA Reserves/Cumulative Commodity (% Imported) Demand 1978 -2000 % Produced Demand (tons) US Selenium Berylluim Mercury Titanium Iron Barite Lead Vanadium Copper Sulfur Rare Earths Lithium Phosphate Molybdenum World 42 43 500 63 1. 9 3. 1 3. 5 > 10 Canada 46, Mexico 24 Brazil 56, Argentina 21 43 48 2, 000 460, 000 0. 3 1. 4 0. 9 4. 1 Algeria 31, Spain 31 Australia 48, Canada 22 58 87, 000 1. 5 5. 1 Canada 39, Japan 17 60 2, 500, 000 1. 3 Peru 28, Ireland 22 76 700, 000 1. 1 Canada 27, Mexico 26 76 6, 300 0. 2 7. 8 South Africa 54, Chile 26 77 1, 700, 000 1. 5 1. 6 Canada 24, Chile 24 90 13, 000 0. 5 0. 9 Canada 59, Mexico 39 90 144 18, 000 3, 900 9. 3 2. 8 8. 0 - Australia 43, Malaysia 32 180 34, 000 3. 6 6. 5 200 30, 000 2. 9 2. 1 • Only 12 have cumulative demand < domestic supplies by 2000 • Only last 3 does US produce as much as we consume in US each year (Li, P, Mo) • Reserves of > ½ used up by 2020
 Consumption, Resources, and Availability When do we do when we run out? ? Search harder, dig deeper, find more (and pay more) F Import (foreign debt and dependence) F Find a substitute (synthetics replace metals, cotton…) F Conserve (use less or be more efficient) F Recycle (OK for metals, glass, but has limits) F Steal somebody else’s (war) F Do without F
 Environmental Impacts of Mineral Consumption, Mining, and Processing l Processing of a typical metal sulfide ore (copper, lead, zinc, molybdenum. . . )
 Environmental Impacts of Mineral Consumption, Mining, and Processing l Surface mining open pits like Bingham Canyon near Salt Lake (or Helena, MT) Bingham Canyon open pit Cu sulfide mine, Utah The World’s largest hole in the ground
 Environmental Impacts of Mineral Consumption, Mining, and Processing l Surface mining Mining ruptures the weathered barrier and exposes the interior to the environment
 Environmental Impacts of Mineral Consumption, Mining, and Processing l Sub-surface mining less impact on site, but still exposes ore to water
 Environmental Impacts of Mineral Consumption, Mining, and Processing l Materials are relatively toxic when exposed at the surface F F F Water weathering, solution toxic metals + sulfuric acid into surface & groundwater environment Est. 550, 000 abandoned mines in USA contaminate 19, 000 rivers and streams Collapse of old excavations poses a serious threat as well Acidic and Fe-rich water from an abandoned subsurface tunnel pours into Beartrap Creek, which flows into the prime trout waters of the Blackfoot River, Montana
 Mine tailings, Bingham Canyon open pit Cu mine, Utah
 White streaks of zinc leached from a tailings pile and redeposited downslope. Colorado.
 Mining Pollution Smelting releases SO 2 to the atmosphere creating acid rain Ducktown TN Sudbury, Ontario
 Mining Pollution Strip Mining- remove shallow surface cover and deposit such as coal, Fe, Mn, or phosphate that extends over a broad area
 Mining Pollution Adverse effects include: F Removal of soil F Exposing ore F Polluting water F Disrupting drainages F Asthetics Strip phosphate mine. Florida Contaminated water from a strip coal mine, Illinois
 Dredging- excavation, sifting, and redepositing of sediment as remove placer minerals
 Dredging rarely exposes fresh toxic ore, but severely disrupts a river valley or bed
 Pad must be lined Note dam
 Keeping cyanide from entering the groundwater system is of critical importance Heap-leach pad extracting gold, Winnemucca, Nevada
 Minimizing the impact of mineral development l Environmental regulation Most degradation is due to past mining practices that are now illegal in 1 st world F US smelters have stringent air quality standards F Water pollution containment and land reclamation plans F
 l Created the Office") Mining Reclamation 1977 Surface Mining Control and Reclamation Act (SMCRA) l Created the Office of Surface Mining and several branches in mining states l Establishes standards and funds federal and state agencies l Coordinated federal and state efforts to regulate pollution, subsidence, and restoration of affected lands for coal mining F F Non-coal still left to individual states Once states set up SMCRA standards they may apply them to non-coal and use SMCRA funds as they see fit
Mining Reclamation 1977 Surface Mining Control and Reclamation Act (SMCRA) l Created the Office of Surface Mining and several branches in mining states l Establishes standards and funds federal and state agencies l Coordinated federal and state efforts to regulate pollution, subsidence, and restoration of affected lands for coal mining F F Non-coal still left to individual states Once states set up SMCRA standards they may apply them to non-coal and use SMCRA funds as they see fit
 Mining Reclamation l l Clean Air Act and Clean Water Act too, because these are public commons (note Tragedy of…) NEPA applies to activities on federal lands only USFS administers mining reclamation on National Forests Some abandoned mines are bad enough to qualify as Superfund sites
 Mining Reclamation Steps in Surface Mine Reclamation l If possible: Before begin, peel back and store soil
 Mining Reclamation Steps in Surface Mine Reclamation l Drainage control and diversion at disturbed area
 Steps in Surface Mine Reclamation l Add or replace topsoil and immediate seeding with rapidly growing species, such as rye grass
 Steps in Surface Mine Reclamation l After initial grass dies back, permanent species take over. Can use as habitat, grazing, etc.
 Dredge Area Reclamation
 Ducktown Tennessee: Superfund Site
 Ducktown Tennessee: Superfund Site
 Ducktown Tennessee: Superfund Site
 Ducktown Tennessee: Superfund Site
 to") Minimizing the impact of mineral development l Biotechnology Use microbes (some genetically engineered) to oxidize, absorb, or leach pollutants F Bioassisted leaching uses critters to liberate metals for chemical leaching F Also use microbes to neutralize acid mine drainage F
Minimizing the impact of mineral development l Biotechnology Use microbes (some genetically engineered) to oxidize, absorb, or leach pollutants F Bioassisted leaching uses critters to liberate metals for chemical leaching F Also use microbes to neutralize acid mine drainage F
 Recycling of Mineral Resources
 Recycling of Mineral Resources Scrap metal
 Recycling of Mineral Resources Urban Ore F Landfills may contain useful materials F Palo Alto: ash from incineration of sewage sludge contained 30 ppm Au, 660 ppm Ag, 8000 ppm Cu, and 6. 6% P F Not all cities are like this, of course, but we may find inexpensive ways to process low grade ores, since processing the sewage anyway