453c7532220e030f14fc1bddbe27fe42.ppt
- Количество слайдов: 25
 Micro. RNA Targets Prediction and Analysis
 Small RNAs play important roles The Nobel Prize in Physiology or Medicine for 2006 Andrew Z. Fire and Craig C. Mello for their discovery of "RNA interference – gene silencing by double-stranded RNA"
 How micro. RNA regulates the target m. RNA genes • Micro. RNAs are ~22 nt noncoding small RNAs that influence m. RNA stability and translation. • Lin-4 (Lee et al. 1993) • Let-7 (Reihart et al, 2000)
 There are three problems • How to find micro. RNA genes? • Given a micro. RNA gene, how to find its targets? • Target-driven approach: – Xie et al. (2005) analyzed conserved motifs that are overrepresented in 3’ UTRs of genes – Found out they are complementing the seed sequences of known micro. RNAs. – They predicted 120 new mi. RNA candidates in human.
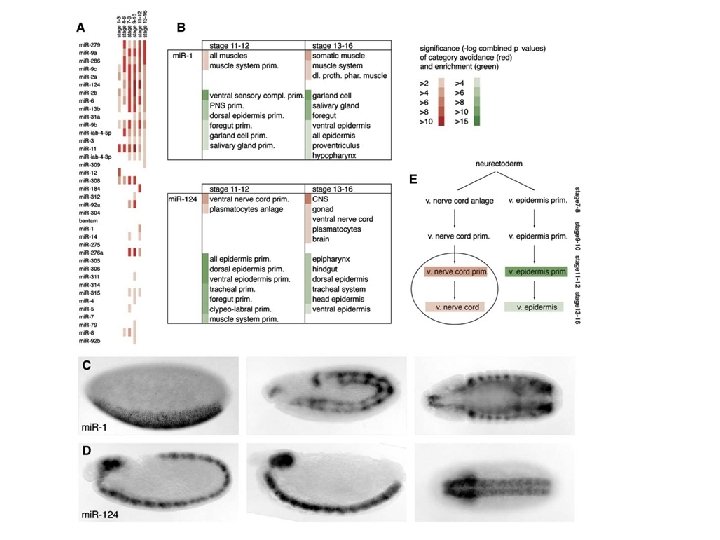
 How to find micro. RNA genes? • Biological approach – Small-RNA-cloning to identify new small RNAs • Most Micro. RNA genes are tissuespecific mi. R-124 a is restricted to the brain and spinal cord in fish and mouse or to the ventral nerve cord in fly mi. R-1 is restricted to the muscles and the hart in mouse
") Computational approaches to find micro. RNA genes • Mi. Rscan (Lim, et al. 2003) – Scan to find conserved hairpin structures in both C. elegans and C. briggsae. – Using known micro. RNA genes (50) as training set.
Computational approaches to find micro. RNA genes • Mi. Rscan (Lim, et al. 2003) – Scan to find conserved hairpin structures in both C. elegans and C. briggsae. – Using known micro. RNA genes (50) as training set.
 Mi. Rscan predicted results • • • Blue: distribution of Mi. Rscan score of 35, 697 sequences Red: training set Yellow and purple are verified by cloning or other evidence.
 can be also used to detect") Other approaches • RNAz (Washietl et al. 2005) can be also used to detect mic. RNAs.
Other approaches • RNAz (Washietl et al. 2005) can be also used to detect mic. RNAs.
 How to find Micro. RNA targets? • Micro. RNA targets are located in 3’ UTRs, and complementing mature micro. RNAs – For plants, the targets have a high degree of sequence complementarity. – But for animals, not this case. – It is short (~21 nt) – If we allow G-U pairs, mismatches, gaps (bulges), we will find a lot false positives using standard alignment algorithms. – How to remove the false positives?
 How to make more accurate predictions? • Incorporating m. RNA UTR structure to predict micro. RNA targets (Robins et al. 2005) – Make sure the predicted target “accessible”. – Not forming basing pairing its self.
 Other properties of micro. RNA targets • Micro. RNA targets conserve across species. (Stark et al. 2003) • Tends to appear in a cluster. For lins, comparison is between C. elegans and C. briggsae. For hid, comparison is between D. melanogaster and D. pseudoobscura.
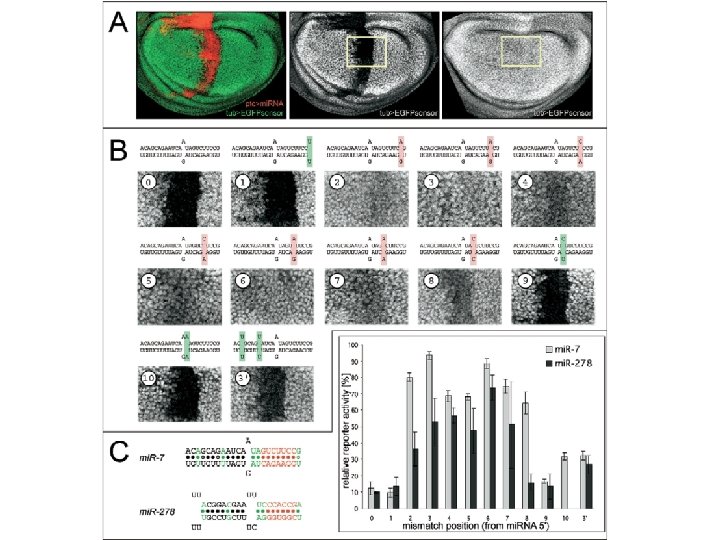
 Another property of micro. RNA targets • Sequence conservations of target sites – Better complementary to the 5’ ends of the mi. RNAs.
 Another property of micro. RNA targets • Strong binding on mi. RNA 5’ end. (Doench and Sharp 2004) • Micro. RNA and targets form simple helices structure – It is not a complex secondary structure. – It also has relatively good energy.
 Most target predictions methods try to use these properties • “mi. Randa” Enright et al. Genome Biology 2003 • Use a weight scheme that rewards complementary pairs at the 5’ ends do the micro. RNA.
 Given a micro. RNA that is conserved in") Targetscan (Lewis et al. Cell 2003) Given a micro. RNA that is conserved in multiple species and a set of orthologous 3’ UTR sequences: 1. Use 7 nt segment of the mi. RNA as the ‘micro. RNA seed’ to find the perfect complementary motifs in the UTR regions. 2. Extend each seeds to find the best energy 3. Assign a Z score. 4. Rank Give a rank (Ri) according to that species. 5. Repeat above process. 6. Keep those genes for which Zi > Z_c and Ri < R_c.
Targetscan (Lewis et al. Cell 2003) Given a micro. RNA that is conserved in multiple species and a set of orthologous 3’ UTR sequences: 1. Use 7 nt segment of the mi. RNA as the ‘micro. RNA seed’ to find the perfect complementary motifs in the UTR regions. 2. Extend each seeds to find the best energy 3. Assign a Z score. 4. Rank Give a rank (Ri) according to that species. 5. Repeat above process. 6. Keep those genes for which Zi > Z_c and Ri < R_c.
 Profile based target search (Stark et al. Plos Biology 2003 1. 2. 3. 4. Building profiles for each micro. RNA family (using HMMer) for first 8 residues, allowing for G: U mismatches. Only search conserved 3’ UTRs (in two fly genomes) using the profiles. Sequence matches are extended to mi. RNA length + 5 nt. Compute the energy using the Mfold and provide the z-scores.
") Three Classes of micro. RNA Target Sites (Brennecke et al. Plos Biology 2005)
Three Classes of micro. RNA Target Sites (Brennecke et al. Plos Biology 2005)
 • Find all 8 –") Seed based target search (Stark et al. Cell 2005) • Find all 8 – 4 mers complementary to the 5’ end of mi. RNA. – For 8 mers, allow one gap – For 7 mers, allow one mismatch • • For each match, we extract the 3’ adjacent sequence from the both genomes (two fly genomes). Predict the base-pairing and compute the energies. Use the worse one. – 8 mers with G-U pair or loop on the target site, energy of 3’ side >= 50% – 8 mers with one mismatch or loop the micro. RNA site 7 mers with a G-U pair, 6 mers, energy of 3’ side >= 60% – 5 mers, energy of 3’ side >= 70% – 4 mers, energy of 3’ side >= 80% • Normalize the 5’ and 3’ energy to get the Z scores.
Seed based target search (Stark et al. Cell 2005) • Find all 8 – 4 mers complementary to the 5’ end of mi. RNA. – For 8 mers, allow one gap – For 7 mers, allow one mismatch • • For each match, we extract the 3’ adjacent sequence from the both genomes (two fly genomes). Predict the base-pairing and compute the energies. Use the worse one. – 8 mers with G-U pair or loop on the target site, energy of 3’ side >= 50% – 8 mers with one mismatch or loop the micro. RNA site 7 mers with a G-U pair, 6 mers, energy of 3’ side >= 60% – 5 mers, energy of 3’ side >= 70% – 4 mers, energy of 3’ side >= 80% • Normalize the 5’ and 3’ energy to get the Z scores.
 • Based on the statistical") Seed based target search (Stark et al. Cell 2005) • Based on the statistical signal, 5’ scores are weighted: – 8 mers 2. 8× – 7 mers 2× – 6 mers by 1. 2× • • • 5’ and 3’ scores are added to get final scores for each sites. The UTR score is the sum of all sites (nonoverlapping seeds). Shuffled micro. RNA controls. – Use 10 shuffled micro. RNA for each the 39 cloned 5’ non-redundant mi. RNAs. – So that the shuffled sequences have an equal number Genome-wide occurrences of matches (+/-15%) in the D. melanogaster 3’UTR. Of conserved 5’ seed matches – Targets were predicted for shuffled micro. RNAs using the same methods.
Seed based target search (Stark et al. Cell 2005) • Based on the statistical signal, 5’ scores are weighted: – 8 mers 2. 8× – 7 mers 2× – 6 mers by 1. 2× • • • 5’ and 3’ scores are added to get final scores for each sites. The UTR score is the sum of all sites (nonoverlapping seeds). Shuffled micro. RNA controls. – Use 10 shuffled micro. RNA for each the 39 cloned 5’ non-redundant mi. RNAs. – So that the shuffled sequences have an equal number Genome-wide occurrences of matches (+/-15%) in the D. melanogaster 3’UTR. Of conserved 5’ seed matches – Targets were predicted for shuffled micro. RNAs using the same methods.
 Summary of Target Validation 8/9 are validated by reporter assay. Performance on 133 experimentally text micro. RNA target pairs: • 72 functional • 62 not • 50/62 predicted by the program. • Compared with 34/62 predicted by Stark et al. 2003
 Interesting Properties of micro. RNA targets • Clusters of micro. RNA targets – Extensive cooccurrence of the sites for different micro. RNAs in target 3’ UTRs.
 Presence and absence of target sites correlate with gene function
 Target site density of Target and Antitarget 3’UTRs • The explanation of significant site avoidance is that antitarget genes are required in the mi. RNA-expressing cells and mi. RNA-mediated repression would be detrimental.