
Methods Looking back 600 million years Atmospheric


")


lecture_dec22_methods.pptx
- Размер: 13.8 Мб
- Автор:
- Количество слайдов: 36
Описание презентации Methods Looking back 600 million years Atmospheric по слайдам
Methods
Looking back 600 million years Atmospheric Carbon Dioxide was likely 18 times today’s concentration, during the Cambrian period when life’s diversity was at its greatest expansion (red circle). It was 4 times the current level when the dinosaurs were killed by an asteroid. The only other extended time CO 2 was low, (like today) was a period 300 million years ago. In the big picture we are now in a low CO 2 period. The 20 th century increase shows as an insignificant dot at this scale. Do we risk runaway greenhouse warming if our CO 2 concentration gets too high? CO 2 has been scarce the last 2 million years. Also, it has never significantly driven temperature before. Venus may have runaway greenhouse warming, but its CO 2 , at 96. 5% is 2, 500 times the level of CO 2 in the earth’s atmosphere. No w
Looking Back 1800 years A CO 2 Measurement Proxy From stomatal density in fossil pine needles
Another CO 2 Measurement Method 4 Chemical method: data for 1810 to 1962 period.
Green dashed — Fairing of early, directly-measured CO 2 Red — chemical method Blue — Mauna Loa modern measurements The ‘Basic’ CO 2 Chart Now takes on a different look
Dashed green — early direct measurements Green — stomatal density in fossil pine needles Black — ice cores, 4 locations Red — chemical method Blue — modern, Mauna Loa direct measurements Summary: CO 2 Data for the last 1800 years Data from early & modern measurements, Ice core, chemical and pine needles. 6 This chart informs illustrates (five data sources) the significant scatter seen in the various methods for CO 2 historical data. 360 260 CO 2 Concentration ~ ppm 1000 Year
Now, to put Atmospheric CO 2 in Perspective This shows CO 2 in its proper role as a trace gas, not something that has to be immediately eliminated. 00. 5% 0. 1%0. 2%0. 3% 0. 4% 1000 AD 2000 AD 0 CO 2 %, indoors, in an average house. Normal human CO 2 limits for a confined space. Industry, submarine or ISS space station (13 times the current atmosphere). C O 2 — % o f A tm o sp h e re Note: Above 30% (780 times the current global atmosphere), CO 2 causes death in humans. Note: Water Vapor (a greenhouse gas) varies up to 4. 0% (100 times CO 2 ). 7 Average atmospheric CO 2 content, during development of plant and animal life on earth (approximately 8 times current). Also, an ‘optimum’ level for species diversity, crop yields and tree growth. Atmospheric Carbon Dioxide Gas, CO 2 — Current CO 2 0. 038%. Red — Chemical measurement + Mauna Loa data. Green — from stomatal density in pine needles. Black — ice core data. Dashed — early measurements.
The Greenland ice core data show it has been consistently warmer for the last 11, 000 years. Today’s climate is not even close to being the “warmest on record”. From: http: //www. c 3 headlines. com/ 8 Russian Vostok ice cores, Antarctica Maximum, 8, 000 years ago Present temperature and last century warming. Note the wild variances in temperatures during thousands of years of constant CO 2 levels (green data).
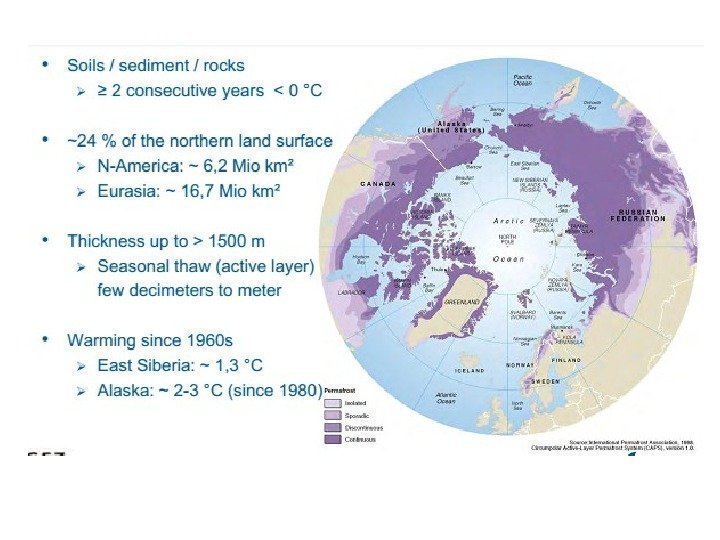
Brown et al. , 1998, revised February 2001 Photo by Günter Stoof, Aug 2016 а) б) в) г)
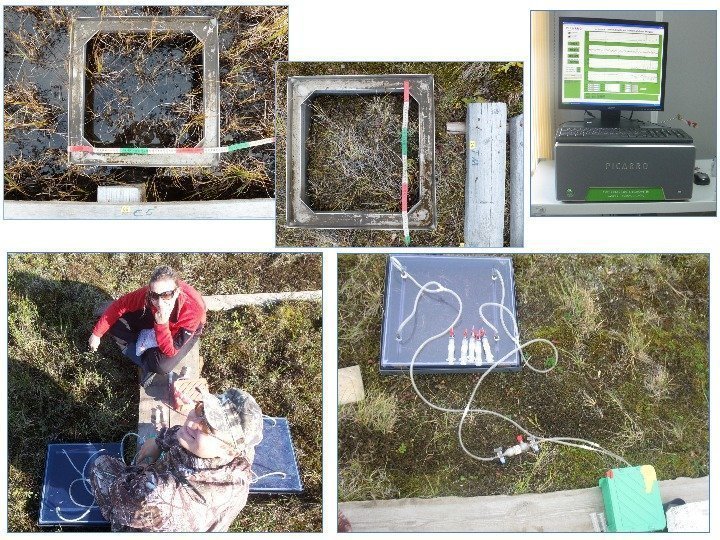
Ivakhov V. (photos and chamber)
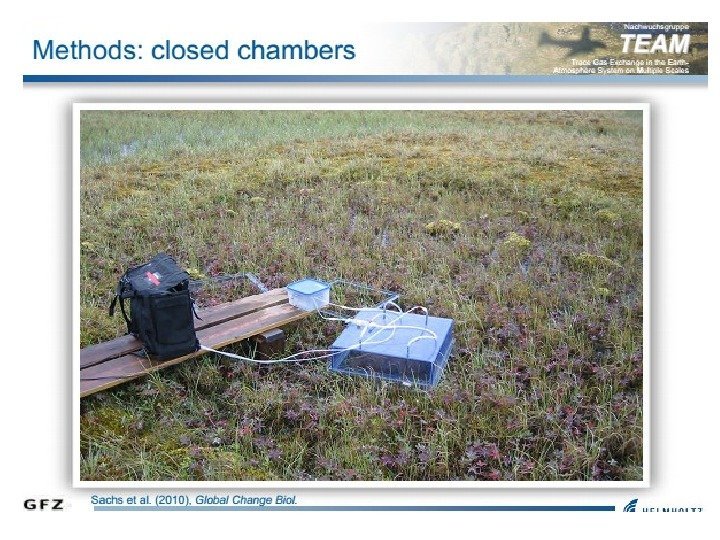
p u m ps e p t u mg a s c o l l e c t i n g t u b e c h a m b e r s t e e l f r a m e p e r m a f r o s t a c t i v e — l a y e r w a t e r f i l l e d g u t t e r T y g o n t u b i n glysimeter with a tube for collecting waterorganic matter in a net bag
Cross section through the floating emission chambers with the underwater chambers for trapping gas bubbles rising from the ponds bottom.
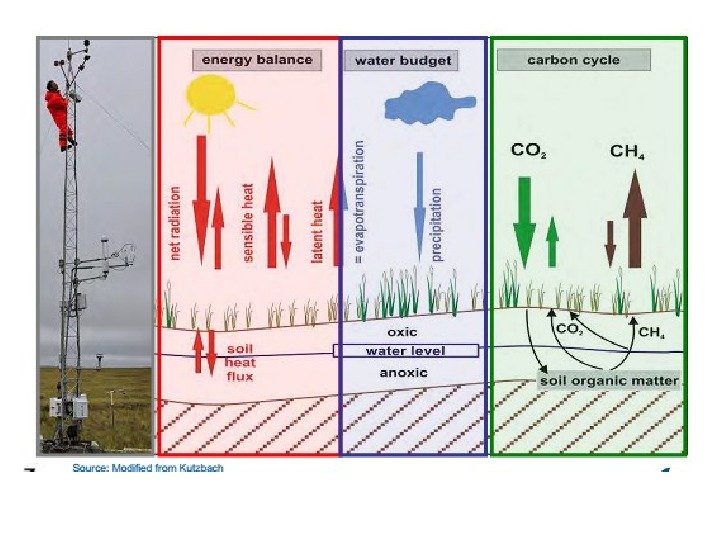
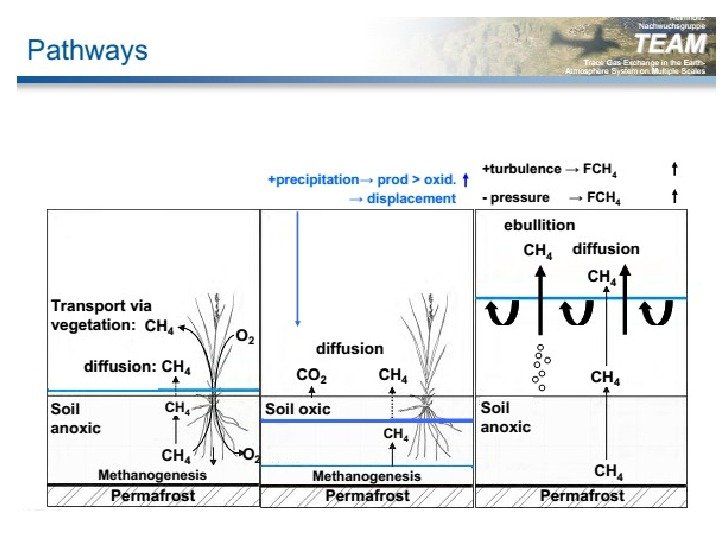
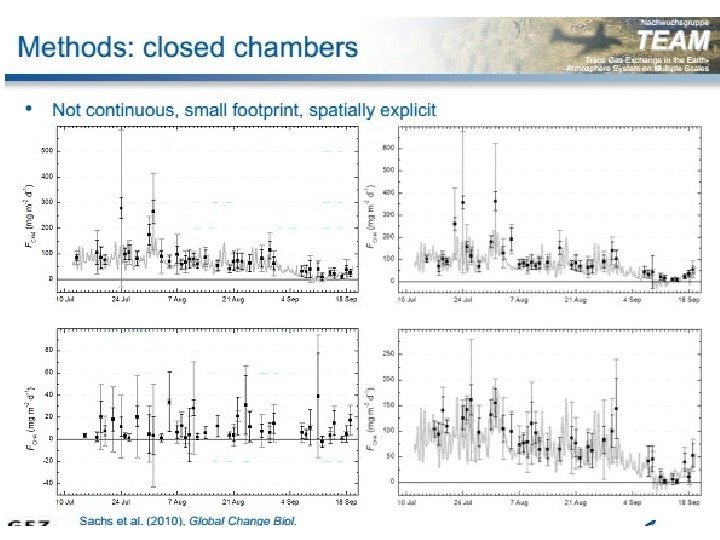
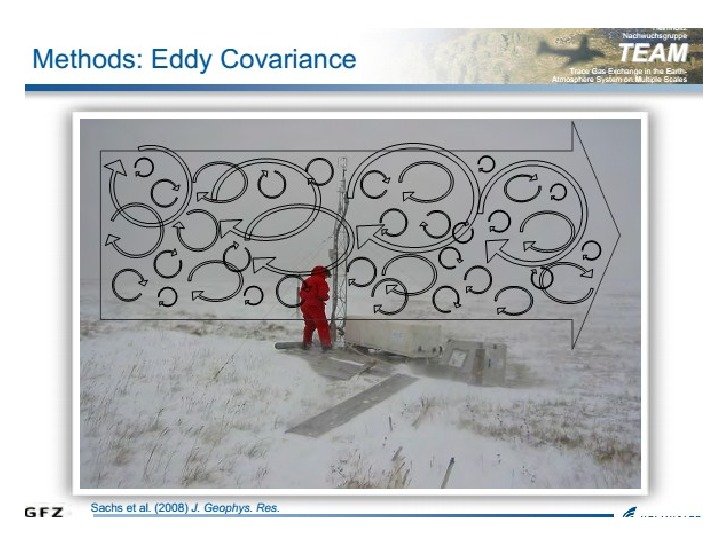
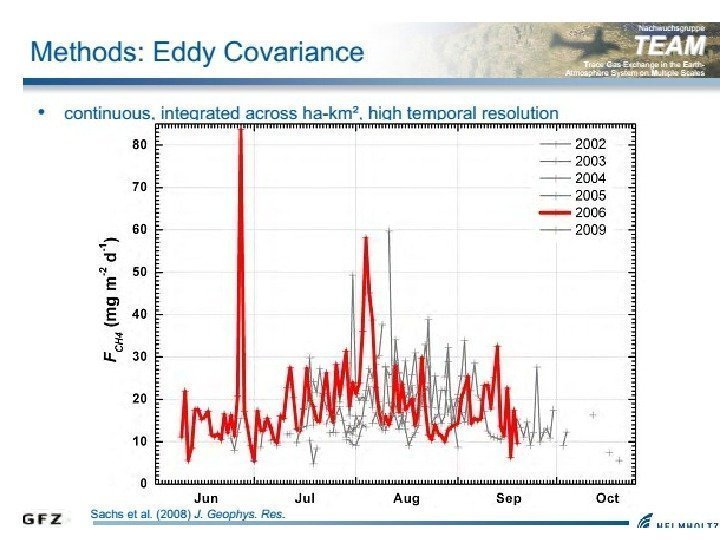
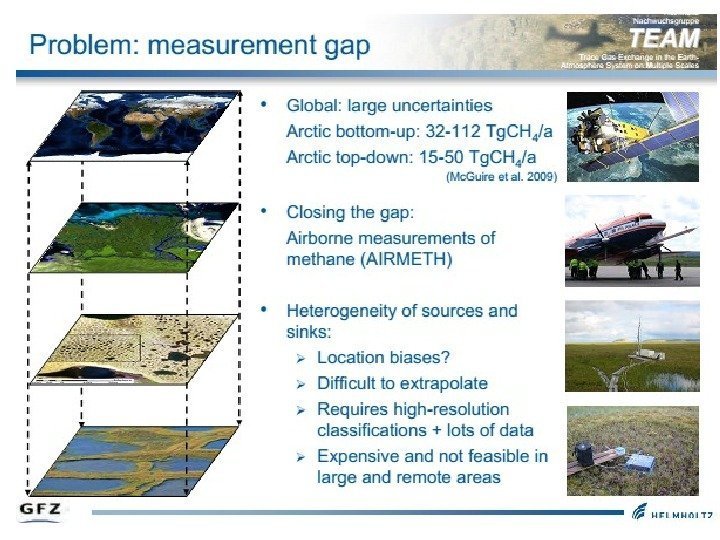
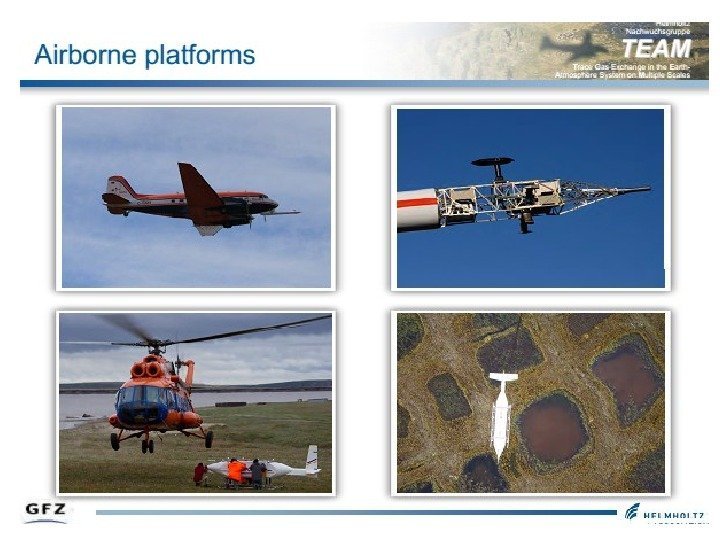
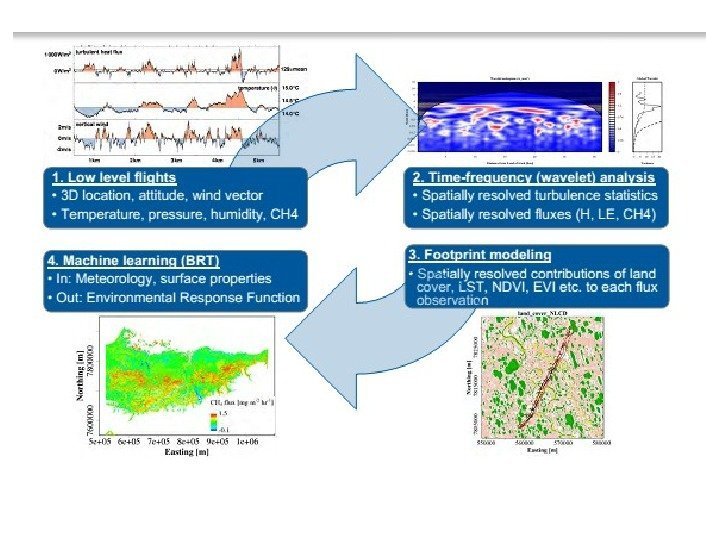
Methods: Chamber Eddy covariance Satelite Aircraf
Questions 1. Why are CH 4 and N 2 O more effective greenhouse gases than CO 2 ? 2. Which GHG are more important in permafrost ecosystems? 3. Do all aerosol particles lead to atmospheric cooling? Why? 4. The effect of warming will not be uniform everywhere. Why higher latitudes are more sensitive? 5. Describe all possible feedbacks of temperature increasing in continuous permafrost region. 6. If a gas (ore a substance) were found to have significant anthropogenic emissions, what would you want to know about it before assessing if it could be a greenhouse gas?
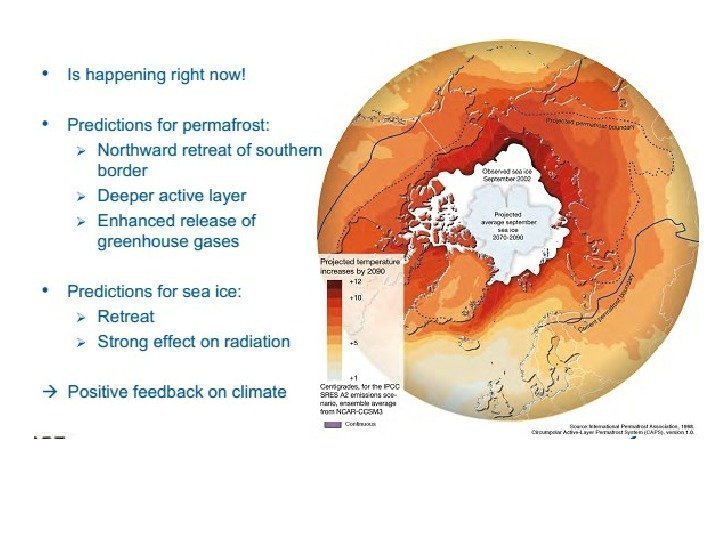
The degree of warming will not be uniform everywhere higher latitudes are more sensitive Source: IP