32b6e69cdeaa6841616a8d67610ac637.ppt
- Количество слайдов: 38


Mental Well Being & Neighborhood Socioeconomic Context: Comparing Measures of Mental Health in a Multiethnic Urban Environment Chris M. Coombe 1, Amy J. Schulz 1, Barbara A. Israel 1, Denise White-Perkins 2, Graciela Mentz 1, and Sheryl Shellman Weir 1 1. University of Michigan School of Public Health 2. Henry Ford Health System On behalf of The Healthy Environments Partnership (www. hepdetroit. com) Partial support for this research provided by the National Institute of Environmental Health Sciences #RO 1 ES 10936

Study Objective To compare the effects of different aspects of neighborhood socioeconomic context on several dimensions of mental health.

Healthy Environments Partnership Steering Committee l l l l Brightmoor Community Center Detroit Department of Health & Wellness Promotion Detroit Hispanic Development Corporation Friends of Parkside Henry Ford Health System/AIMHI Rebuilding Communities Incorporated University of Michigan School of Public Health Community members

Healthy Environments Partnership: Uses community based participatory research to examine and address aspects of the social and physical environments that contribute to racial, ethnic and socioeconomic disparities in health.

Community Based Participatory Research l Engages partners from academic, public health and community perspectives in all aspects of the research process.

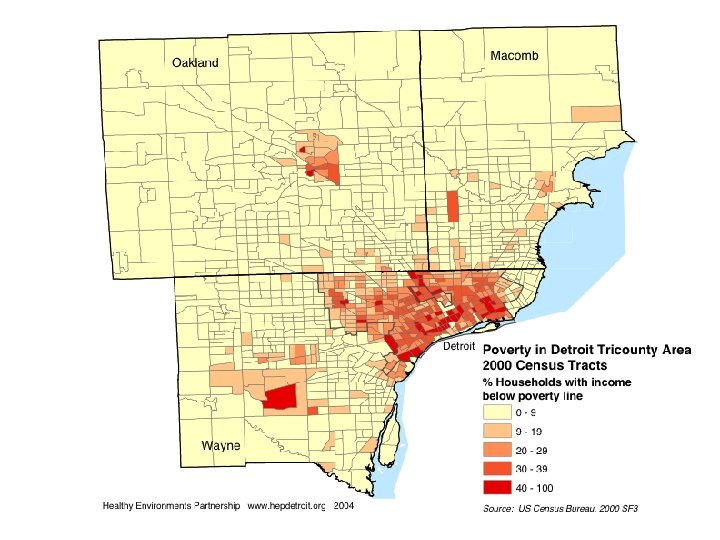
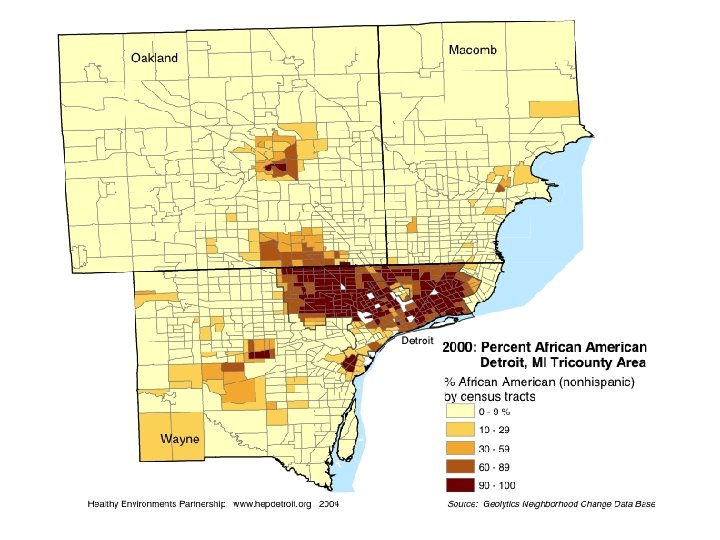
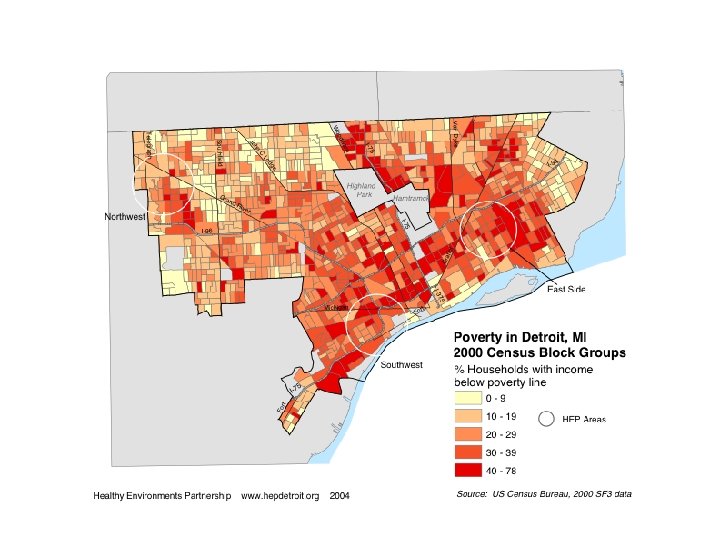
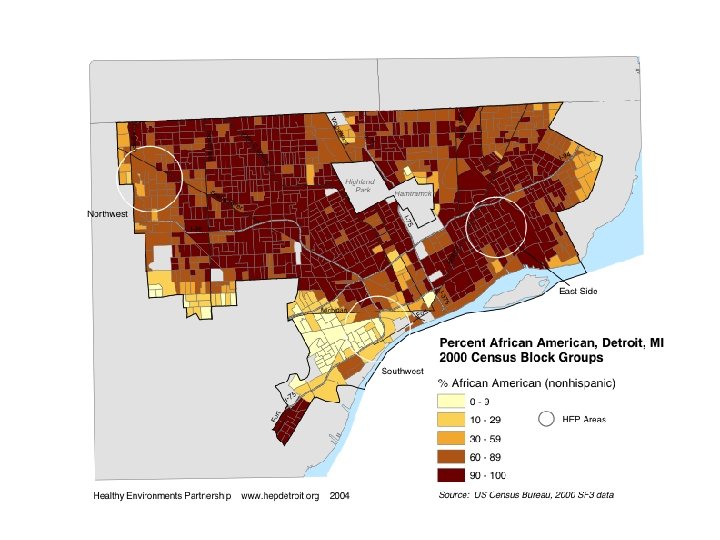
Detroit, Michigan l Historically vibrant, prosperous city l Regional economic restructuring and pervasive racism – Racial residential segregation – Concentration of wealth and poverty 1950 2000 Population (million) 1. 8 16. 2 . 9 82. 3 % African American

Fundamental Determinants of Health… l “… involve access to resources, resources that help individuals avoid disease and their negative consequences. ” – Link and Phelan 1995

Research Objective To compare the effects of neighborhood residential socioeconomic context on 3 dimensions of mental health: Life Satisfaction Depressive Symptoms Major Depression
 Individual Level (N = 919): HEP Community Survey – Stratified,")
Methods: Multilevel Modeling (HLM) Individual Level (N = 919): HEP Community Survey – Stratified, multi-stage probability sample Neighborhood Level (J = 69): U. S. Census Summary File 3 – Block Group level
 Latino 22 Household income – –")
Characteristics of Sample Percent: African American White (non-Hispanic) Latino 22 Household income – – < $10, 000 27 10 – 19, 999 20 – 39, 999 $40, 000 and over 56 18 27 29 16 Homeowner 49 Length of residence neighborhood Mean age 46 years 17 years (mean)
 14 Latino 15 0")
Characteristics of Neighborhoods Percent Range African American 68 White (non-Hispanic) 14 Latino 15 0 – 84 0 - 100 0 - 72 Residential Stability 57 Middle income composition Poverty 30 6 – 58 Concentrated Poverty (>40%) 21 - 88 32 7 - 77 Median Household Income $27, 419 $10, 583 – 83, 115 16% (19 BGs)

Mental Health Outcomes l Life Satisfaction l Symptoms l Major of Depression Depressive Disorder (12 month)

Life Satisfaction – Looking back over your life, how satisfied would you say you are with your life overall? Percent • • Not satisfied at all 2. 8 Not very satisfied 8. 1 Somewhat satisfied 50. 5 Very satisfied 38. 5
* l Mean of 11 questions on")
Symptoms of Depression Center for Epidemiologic Studies (CES-D)* l Mean of 11 questions on scale of 1 – 5 (always – never) l Mean = 2. 62 *Radloff, 1977

Major Depressive Disorder Diagnosable depression within previous 12 months – Composite International Diagnostic Interview (UM-CIDI), World Health Organization l Prevalence: – National* – HEP survey *Williams et. al. , 2007 African American 5. 9 18. 1 White 6. 9 21. 8

Individual Covariates l l l l l Age Gender Race Latino ethnicity Marital status Education Household income Number of persons in household Homeownership Length of residence in neighborhood

Neighborhood Measures Middle Income and Above Mean Range Household income > $40, 00032% 2 - 77% Poverty 30% 6 - 58% Household income below poverty Residential Stability 57% 21 -88% Percent residents living in same house 5 years earlier

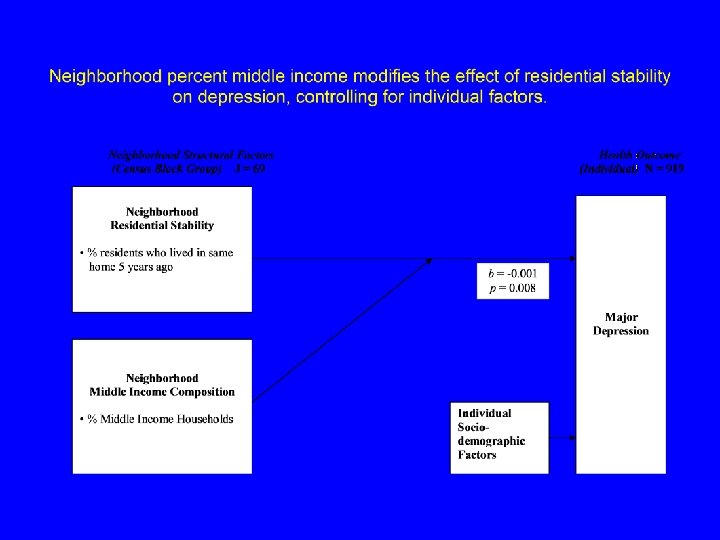
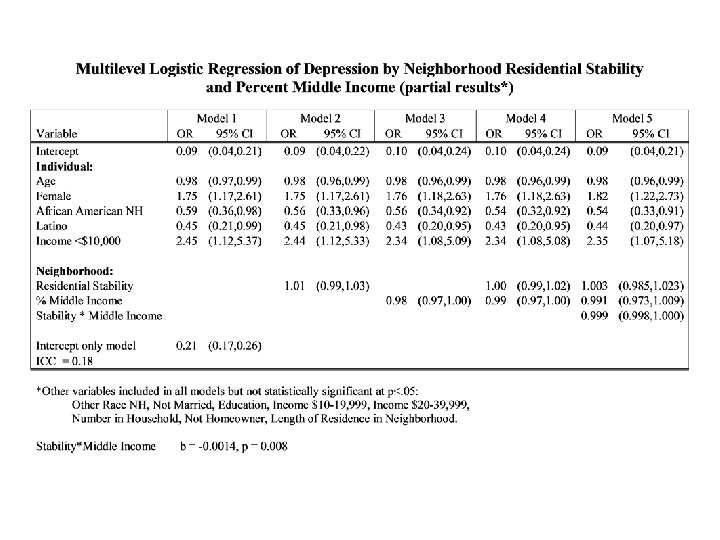
Results: Effects of Interaction of Neighborhood Income and Stability Neighborhood effects l Life Satisfaction ns l Depressive Symptoms ns l Major Depression Significant p=0. 008 Results similar for Neighborhood Middle Income and Poverty: Middle income stronger effect

Proportion of Total Variance that is at the Neighborhood Level ICC Design Effect l Life Satisfaction 0. 07 1. 86 l Depressive Symptoms 0. 03 1. 37 l Major Depression 0. 18 3. 21 Intraclass Correlation = Level 2 variance / Total variance Design Effect = 1 + (average cluster size x ICC)

Predicted Probability of Depression for High Risk Group by Neighborhood Stability for High, Medium, and Low Percent Middle Income Neighborhoods

Why These Effects in High Turnover Neighborhoods? High Turnover, Middle Income: l Disinvestment—Deteriorating infrastructure, declining property values l Powerlessness, hopelessness, acute stress High Turnover, Low Income: l Neighborhood for “transition” l Hopefulness, resiliency l Availability of economic buffers—services, rental housing, jobs

Why Major Depression but not Depressive Symptoms or Life Satisfaction? l Chronic exposure to stressful daily residential environments l Cumulative effects of chronic and acute stressors l May be more sensitive, more variation at the local level l Composition

Limitations & Strengths Cross-sectional l Measures l – Life satisfaction – Residential stability does not include loss – Middle income composition $40, 000 and above How neighborhood structural features interact l Small area level, low-income disinvested city l Identified high prevalence of major depression l

Implications l Need for research on mechanisms l Treatment and structural interventions targeting specific neighborhood conditions l Regeneration of neighborhoods that includes economic support and mobility for lower income residents, while attracting and retaining middle income residents


Multilevel Logistic Regression of Major Depression on Neighborhood Stability and Percent Middle Income

Residential Stability l One end of a continuum of flux or continuity of people living in a neighborhood l Proportion of residents living in same house five years earlier l Long considered beneficial to health through ties that can generate social, psychological, organizational, political, and economic resources

Conceptual Model of Social Determinants of Neighborhood Residential Environments on Depression in Detroit, Michigan

Summary of Results
")
Detroit City Population Change, 1950 -2000 Percent African American 16. 2 1950 Pop. (million) 1. 8 1960 1. 6 28. 9 1970 1. 5 43. 7 1980 1. 2 63. 0 1990 2000 1. 0 0. 9 75. 7 82. 3

Community–Based Participatory Research l Engages partners from academic, public health and community perspectives in all aspects of process, including: – – – Identification of research questions Data collection methods and processes Interpretation of results Dissemination of results Decisions about how to apply results to address health concerns
32b6e69cdeaa6841616a8d67610ac637.ppt