

7b93397d4d1ecde52e6f50dfb5b9960a.ppt
- Количество слайдов: 43
 Measurement of pulmonary gas exchange in the ICU. Stephen Rees Center for Model-based Medical Decision Support, Department of Health Science and Technology, Aalborg University. Disclosure: Board- member and minority share holder of Mermaid Care, who produce the ALPE system.
 Our goal: To see if well know physiological models can be useful in clinical practice. • Poor ventilator therapy increases mortality (ARDSNet. Ventilation with lower tidal volumes as compared with traditional tidal volumes for acute lung injury and the acute respiratory distress syndrome. NEJM 2000; 342. ) • Standardization helps, if used. Young et al. Ventilation of patients with acute lung injury and acute respiratory distress syndrome: has new evidence changed current practice? Crit. Care Med 2004; 32: 1260 -5. Esteban et al. Evolution of mechanical ventilation in response to clinical research. Am J Respir Crit Care Med 2008; 177: 170 -8. • Automation can achieve standardization • Current automated mechanical ventilator tools do not apply physiological models.
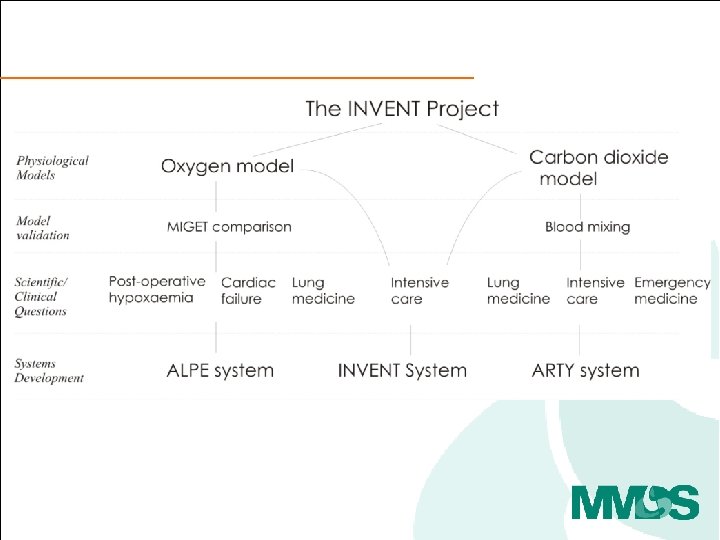
 INVENT approach – physiological models
 INVENT approach – physiological models Find me the ventilator settings for this individual giving simulations which clinically preferred.
 Why was this path interesting to pursue? • How is pulmonary gas exchange measured today? • How could pulmonary gas exchange be measured? • How might these measurements be used in clinical practice?
 • How is pulmonary gas exchange measured today? • How could pulmonary gas exchange be measured? • How might these measurements be used in clinical practice?
 How is pulmonary gas exchange measured today? Clinical The Pa. O 2/Fi. O 2 ratio • Used in the definition of ALI, ARDS • Sensitive to changes in Fi. O 2 30% of the patients change disease classification. • Poor quantification of gas exchange D S Karbing et al. Variation in the Pa. O 2/Fi. O 2 ratio with Fi. O 2: Mathematical and experimental description, and clinical relevance. Critical Care. 2007; 11(6): R 118.
 How is pulmonary gas exchange measured today? Clinical Experimental The Pa. O 2/Fi. O 2 ratio The Multiple Inert Gas Elimination Technique (MIGET) • Used in the definition of ALI, ARDS. • Sensitive to changes in Fi. O 2 30% of the patients change disease classification. • The basis of our understanding of ventilation/perfusion distribution in the lungs. • Complex – requiring tracer gases and gas chromatography. • Poor quantification of gas exchange. D S Karbing et al. Variation in the Pa. O 2/Fi. O 2 ratio with Fi. O 2: Mathematical and experimental description, and clinical relevance. Critical Care. 2007; 11(6): R 118. Wagner PD, Saltzman HA, West JB. Measurement of continuous distributions of ventilation-perfusion ratios: theory. J Appl Physiol. 1974 May; 36(5): 588 -99
 Data analysed using a 50 compartment model. To give ventilation and perfusion distributions.
 Is there an effective, useful, compromise in measurement of pulmonary gas exchange. CLINICAL STANDARD Arterial Pa. O 2, Pa. O 2/ Fi. O 2 ratio, Effective shunt. EXPERIMENTAL STANDARD MIGET ”Simple measures lack discrimination while complex measurements are infeasible in clinical care…. (the authors)… seek a middle ground” Assessment of gas exchange in lung disease: balancing accuracy against feasibility. Wagner PD. Critical Care. 2007; 11(6): 182.
 is • How is pulmonary gas exchange measured today? • How can pulmonary gas exchange be measured using the ALPE technology? • How might these measurements be used in clinical practice?
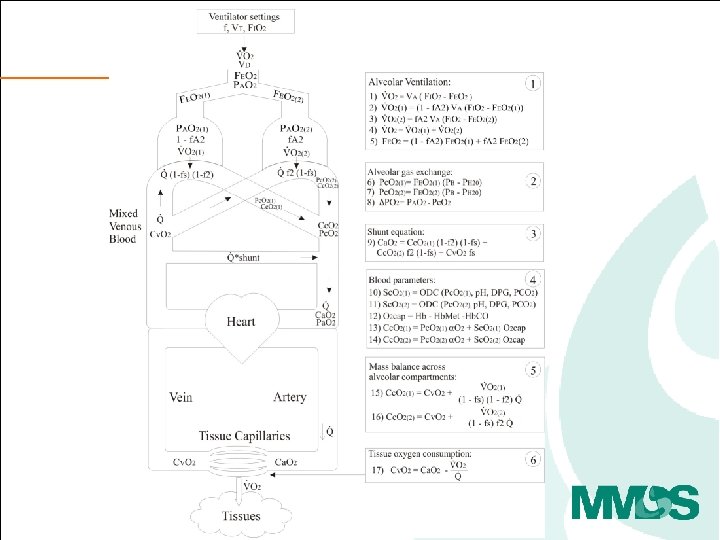
 The principle and procedure • Variation of FIO 2 and measurement of ventilatory flow, gasses, Sp. O 2 plus a single blood gas, can be used to calculate pulmonary shunt, low V/Q and high V/Q. • Three to five step changes in FIO 2, each to steady state. • Model analysis and parameter estimation.
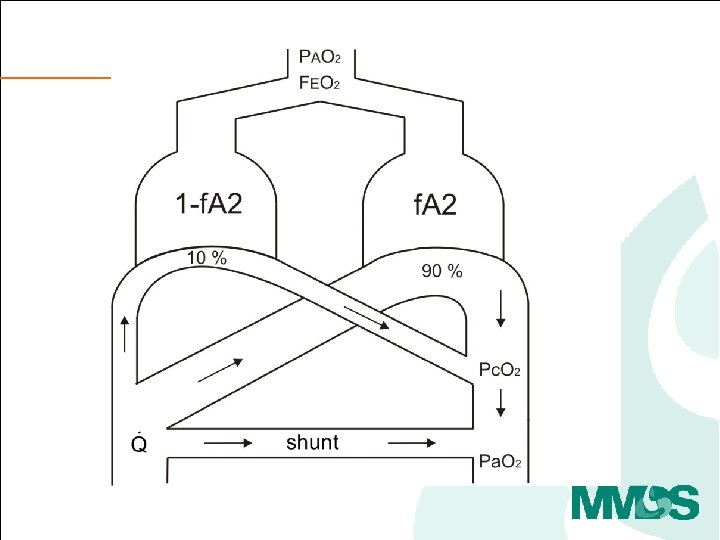
 high V/Q low V/Q
 high V/Q Well oxygenated Venous oxygenation low V/Q Poorly oxygenated
 high V/Q low V/Q Well oxygenated Poorly oxygenated Oxygen responsive Venous oxygenation Not oxygen responsive
 Oxygen loss = PAO 2 - Pc. O 2 high V/Q low V/Q Oxygen responsive Not oxygen responsive
 Oxygen loss = PAO 2 - Pc. O 2 high V/Q low V/Q Oxygen responsive Not oxygen responsive
 Shunt = 1%") Clinical values of ‘shunt’ and ‘O 2 loss’ Pre-op patient (x) Shunt = 1% O 2 loss = 2 % Post- op CABG patient (*) Shunt = 12% O 2 loss = 3% aa ICU patient (ARDS) (+) Shunt = 21% O 2 loss = 17% Kjærgaard S, Rees S, Malczynski J, Nielsen JA, Thorgaard P, Toft E, Andreassen S. Non-invasive estimation of shunt and ventilation-perfusion mismatch. Intensive Care Medicine 2003 May; 29(5): 72734.
Clinical values of ‘shunt’ and ‘O 2 loss’ Pre-op patient (x) Shunt = 1% O 2 loss = 2 % Post- op CABG patient (*) Shunt = 12% O 2 loss = 3% aa ICU patient (ARDS) (+) Shunt = 21% O 2 loss = 17% Kjærgaard S, Rees S, Malczynski J, Nielsen JA, Thorgaard P, Toft E, Andreassen S. Non-invasive estimation of shunt and ventilation-perfusion mismatch. Intensive Care Medicine 2003 May; 29(5): 72734.
 Clinical values of ‘shunt’ and ‘O 2 loss’ What does this mean clinically? Shunt Pre-op patient (x) Shunt = 1% O 2 loss = 2 % Post- op CABG patient (*) Shunt = 12% O 2 loss = 3% aa O 2 loss (Low V/Q) ICU patient (ARDS) (+) Shunt = 21% O 2 loss = 17 % Kjærgaard S, Rees S, Malczynski J, Nielsen JA, Thorgaard P, Toft E, Andreassen S. Non-invasive estimation of shunt and ventilation-perfusion mismatch. Intensive Care Medicine 2003 May; 29(5): 727 -34.
 Clinical values of ‘shunt’ and ‘O 2 loss’ What does this mean clinically? Shunt Pre-op patient (x) Shunt = 1% O 2 loss = 2 % Post- op CABG patient (*) Shunt = 12% O 2 loss = 3% aa O 2 loss (Low V/Q) ICU patient (ARDS) (+) Shunt = 21% O 2 loss = 17 % Kjærgaard S, Rees S, Malczynski J, Nielsen JA, Thorgaard P, Toft E, Andreassen S. Non-invasive estimation of shunt and ventilation-perfusion mismatch. Intensive Care Medicine 2003 May; 29(5): 727 -34.
 References • Classifying and monitoring ICU patients • • D S Karbing, et al. Variation in the Pa. O 2/Fi. O 2 ratio with Fi. O 2: Mathematical and experimental description, and clinical relevance. Critical Care. 2007; 11(6): R 118. S Kjærgaard, et al. Non-invasive estimation of shunt and ventilation-perfusion mismatch. Intensive Care Medicine 2003 May; 29(5): 727 -34. • Assessment of respiratory function, before during and after surgical intervention • • Kjærgaard S et al. Modelling of hypoxaemia after gynaecological laparotomy. Acta Anaesthesiol. Scand. 2001 Mar; 45(3): 349 -356 Kjærgaard S et al. Hypoxaemia after cardiac surgery: Clinical application of a model of pulmonary gas exchange. EJA. 2004 Apr; 21(4): 296 -301. Rasmussen BS et al. Oxygenation within the first 120 h following coronary artery bypass grafting. Influence of systemic hypothermia (32 degrees C) or normothermia (36 degrees C) during the cardiopulmonary bypass: a randomized clinical trial. Acta Anaesthesiol. Scand. 2006 Jan; 50(1): 64 -71. Rasmussen BS et al. Oxygenation and release of inflammatory mediators after off-pump compared to after onpump coronary artery bypass surgery. Acta Anaesthesiol. Scand. 2007, 51(9): 1202 -10. • Standardising and optimising ventilator therapy • • • Karbing DS, et al. Retrospective evaluation of a decision support system for control of mechanical ventilation. Med Biol Eng Comput. 2011 Nov 22. [Epub ahead of print] Karbing DS, et al. Prospective evaluation of a decision support system for setting inspired oxygen in intensive care patients. J. Crit Care, 2010, 25(3): 367 -74. C Allerød, et al. A Decision Support System for suggesting ventilator settings: Retrospective evaluation in cardiac surgery patients ventilated in the ICU. Comput. Meth Prog. Biomed 2008, vol. 92, nr. 2, s. 205 -212
 Comparison to MIGET – We showed • The ALPE model adequately describes MIGET data in a physiological situation analogous to acute lung injury, and gives similar parameter values to the MIGET model Rees S. E, et al. , J Appl Physiol. 101(3), 826 -32, (2006). • The ALPE model gives accurate predictions of Pa. O 2 across a range of PEEP, Inspiratory : Expiratory (IE) ratio, and FIO 2 settings compatible with clinical treatment of acute lung injury Rees SE. Intensive Care Med. 36(12), 2117 -24. (2010). We did not show, or try to show that • The ALPE adequately describes injury similar to mature ARDS or other more complex situations. • Fi. O 2 v Sa. O 2 curves give V/Q distributions similar to MIGET.
 • How is pulmonary gas exchange measured today? • How can pulmonary gas exchange be measured using the ALPE technology? • How might these measurements be used in clinical practice?
 How might these measurements be used in clinical practice? • Appropriate setting of FIO 2 • Monitoring the effects of PEEP
 How might these measurements improve clinical practice? • Appropriate setting of FIO 2 – How might one use these parameters “shunt” and “Oxygen loss” to set FIO 2. • Monitoring the effects of PEEP
 An ICU case – shunt = 15 %, O 2 loss = 9 %
 An ICU case – shunt = 15 %, O 2 loss = 9 % Shunt O 2 loss (Low V/Q)
 An ICU case – shunt = 15 %, O 2 loss = 9 % Shunt What FIO 2 should they have? O 2 loss = 9 % FIO 2 = 21% + 9% O 2 loss (Low V/Q)
 A normal person – shunt = 15 %, O 2 loss = 9 % FIO 2 = 21+9 = 30 % ≈ 30 k. Pa ≈ 225 mm. Hg FEO 2 = 14+9 = 23 % ≈ 23 k. Pa ≈ 173 mm. Hg O 2 loss = 9 % ≈ 9 k. Pa ≈ 67 mm. Hg Pc. O 2 ≈ 23 -9 =14 k. Pa ≈ 105 mm. Hg Sc. O 2 ≈ 98 % Sv. O 2 ≈ 70% shunt = 15 % Sa. O 2 ≈ 94% Pa. O 2 ≈ 9. 5 k. Pa ≈ 71 mm. Hg
 An ICU case – shunt = 15 %, O 2 loss = 9 % FIO 2 = 30 % Sa. O 2 = 94 % Normal oxygenation of that which is “oxygen responsive”
 ALPE control of Fi. O 2 Baseline Clinician System Karbing DS, Allerød C, Thorgaard P, Carius AM, Frilev L, Andreassen S, Kjærgaard S, Rees SE. Prospective evaluation of a decision support system for setting inspired oxygen in intensive care patients. Journal of Critical Care, 2010, 25(3): 367 -74.
 How might these measurements improve clinical practice? • Appropriate setting of FIO 2 • Monitoring the effects of PEEP
 Physiological rational for PEEP monitoring with gas exchange • Most PEEP monitoring techniques based upon mechanical rather than functional measurements. • Opening may not be the same a improving functionality, and the functionality is the gas exchange. • We know from MIGET that changing PEEP modifies the V/Q distribution in the lung. Dantzker DR, et al. Ventilation-Perfusion distributions in the Adult Respiratory Distress Syndrome. Am Rev Resp Dis. 1979, 120: 1039 -52.
 Case 1 – no response to PEEP increase. • Support ventilation, 6 days in the ICU. • FIO 2 = 60 %, PEEP 6 cm H 2 O. • Shunt = 10 %, O 2 loss = 11%
 Case 1 – no response to PEEP increase. • Support ventilation, 6 days in the ICU. • FIO 2 = 60 % to 45 % PEEP = 6 cm H 2 O to 12 cm. H 2 O. • Shunt = 9 %, O 2 loss = 13%
 Case 2 – response to PEEP increase. FIO 2 40 %, PEEP 15 cm H 2 O Shunt 10 %, O 2 loss 5 % Controlled ventilation, 1 day in the ICU. FIO 2 40 %, PEEP 5 cm H 2 O Shunt 20%, O 2 loss 2%
 Case 2 – response to PEEP increase. FIO 2 40 %, PEEP 15 cm H 2 O Shunt 10 %, O 2 loss 5 % PEEP = 10 cm H 2 O FIO 2 40 %, PEEP 5 cm H 2 O Shunt 20%, O 2 loss 2%
 Conclusions • We are trying to find a balance, bringing well known physiology into clinical tools. • Goals – Provide a physiological description of gas exchange – Help find appropriate FIO 2 – Help monitor the functional effects of PEEP
 Future and thoughts • Comparison with CT scans in ARDS • Comparison with HRCT in COPD patients • Tidying up assumptions – HPV, steady state conditions, etc. • A thought, oxygen is also used as a tracer to estimate EELV. These could be combined.