0fad6535adc1b302e0f9324d8eadf577.ppt
- Количество слайдов: 98

Maximizing the Performance of the Oracle e. Business Suite Ahmed Alomari Applications Performance Group Oracle Corporation June 14, 2005
Agenda Ÿ Architecture Ÿ Application Services Tier – – Forms Reports Concurrent Manager Apache Ÿ Mod PL/SQL Ÿ Jserv/JVM – – Ÿ Ÿ Ÿ Portal Discoverer Network Performance Data Server Tier Application Tuning 11 i 10 Performance Improvements Q&A
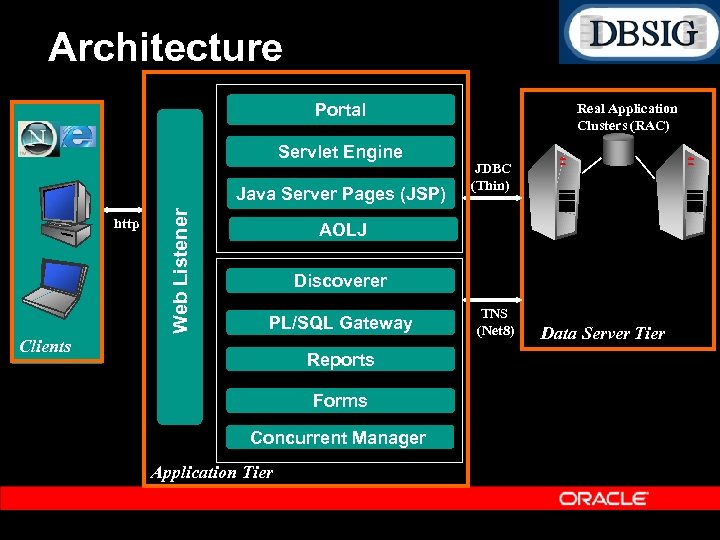
Architecture Portal Servlet Engine http Web Listener Java Server Pages (JSP) Real Application Clusters (RAC) JDBC (Thin) AOLJ Discoverer PL/SQL Gateway Clients Reports Forms Concurrent Manager Application Tier TNS (Net 8) Data Server Tier
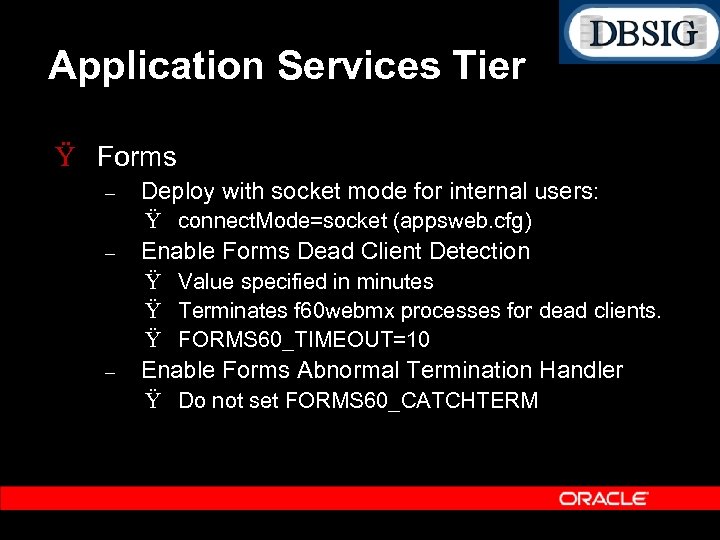
Application Services Tier Ÿ Forms – Deploy with socket mode for internal users: Ÿ connect. Mode=socket (appsweb. cfg) – Enable Forms Dead Client Detection Ÿ Value specified in minutes Ÿ Terminates f 60 webmx processes for dead clients. Ÿ FORMS 60_TIMEOUT=10 – Enable Forms Abnormal Termination Handler Ÿ Do not set FORMS 60_CATCHTERM
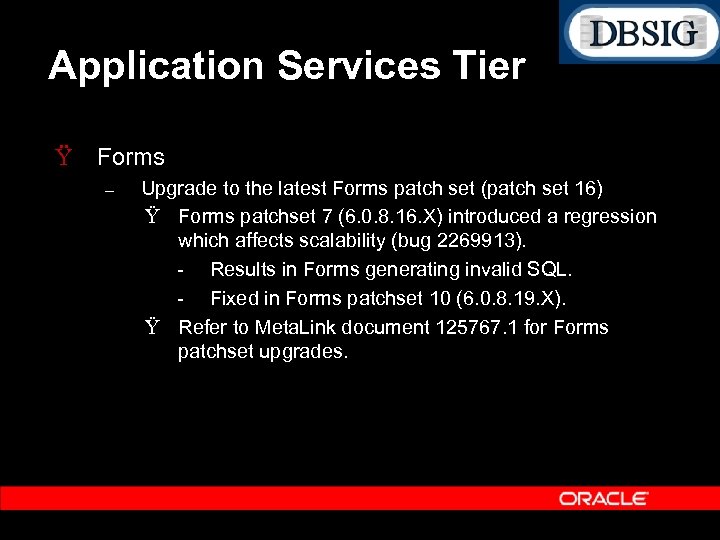
Application Services Tier Ÿ Forms – Upgrade to the latest Forms patch set (patch set 16) Ÿ Forms patchset 7 (6. 0. 8. 16. X) introduced a regression which affects scalability (bug 2269913). Results in Forms generating invalid SQL. Fixed in Forms patchset 10 (6. 0. 8. 19. X). Ÿ Refer to Meta. Link document 125767. 1 for Forms patchset upgrades.
Application Services Tier Ÿ Forms – Cancel Query – – Should not be enabled unless you are on Forms patchset 14 (Forms version 6. 0. 8. 23. x or higher). Refer to Meta. Link Note 138159. 1 for instructions on how to enable and tune Cancel query related parameters. Cancel Query increases middle tier CPU as well as DB CPU. To Disable Cancel Query Ÿ Set the Profile “FND: Enable Cancel Query” to No.
Application Services Tier Ÿ Forms – Ensure users are optimally utilizing the professional Forms interfaces. Ÿ Avoid Blind queries Ÿ Provide selective criteria in Find windows and LOVs. Ÿ Avoid opening and closing forms across transactions. Users which need to switch responsibility in order to complete a business transaction should instead keep the relevant Forms open.
Application Services Tier Ÿ Forms (Tracing) – – If the form is slow, or a specific flow in the Form is slow, first generate a complete SQL trace using the Trace menu in Help Diagnostics. If the SQL trace does not account for the majority of the response time experienced by the user, then generate a Forms Runtime Diagnostics (FRD) Trace.
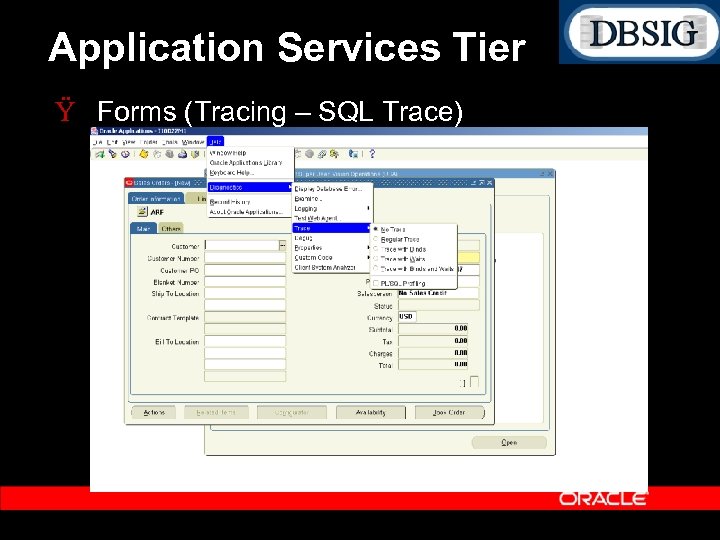
Application Services Tier Ÿ Forms (Tracing – SQL Trace)
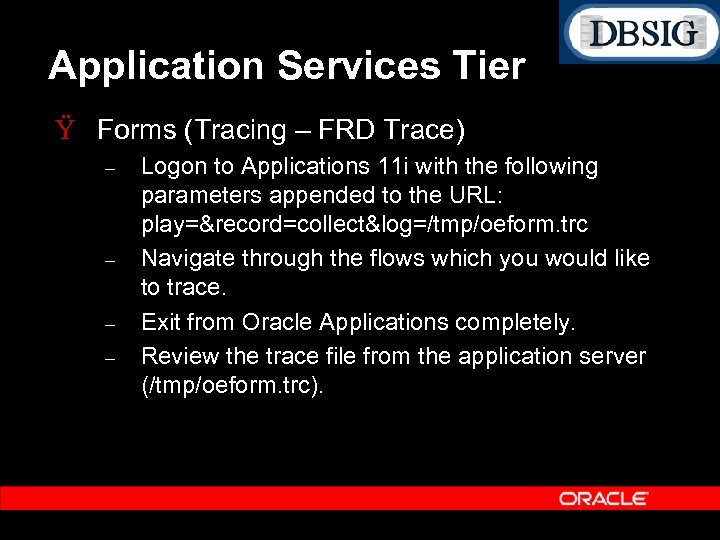
Application Services Tier Ÿ Forms (Tracing – FRD Trace) – – Logon to Applications 11 i with the following parameters appended to the URL: play=&record=collect&log=/tmp/oeform. trc Navigate through the flows which you would like to trace. Exit from Oracle Applications completely. Review the trace file from the application server (/tmp/oeform. trc).
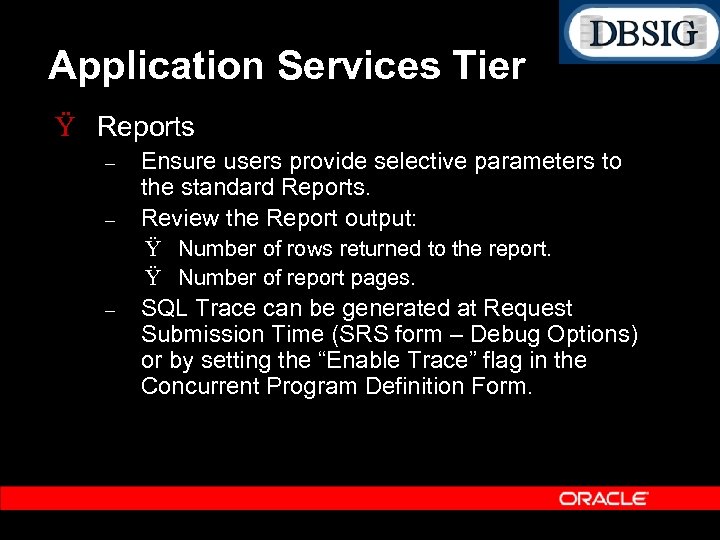
Application Services Tier Ÿ Reports – – Ensure users provide selective parameters to the standard Reports. Review the Report output: Ÿ Number of rows returned to the report. Ÿ Number of report pages. – SQL Trace can be generated at Request Submission Time (SRS form – Debug Options) or by setting the “Enable Trace” flag in the Concurrent Program Definition Form.
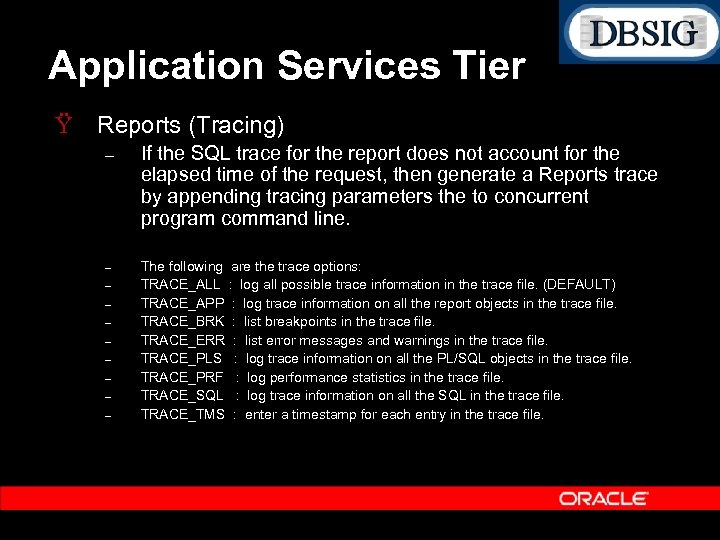
Application Services Tier Ÿ Reports (Tracing) – If the SQL trace for the report does not account for the elapsed time of the request, then generate a Reports trace by appending tracing parameters the to concurrent program command line. – The following are the trace options: TRACE_ALL : log all possible trace information in the trace file. (DEFAULT) TRACE_APP : log trace information on all the report objects in the trace file. TRACE_BRK : list breakpoints in the trace file. TRACE_ERR : list error messages and warnings in the trace file. TRACE_PLS : log trace information on all the PL/SQL objects in the trace file. TRACE_PRF : log performance statistics in the trace file. TRACE_SQL : log trace information on all the SQL in the trace file. TRACE_TMS : enter a timestamp for each entry in the trace file. – – – –
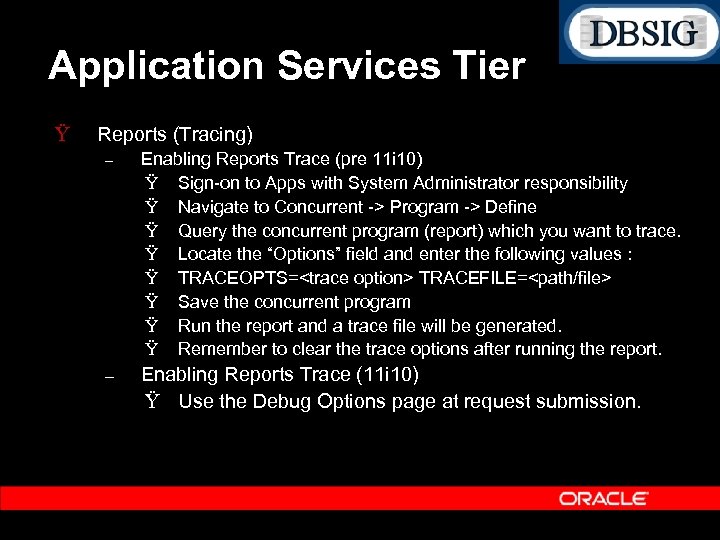
Application Services Tier Ÿ Reports (Tracing) – Enabling Reports Trace (pre 11 i 10) Ÿ Sign on to Apps with System Administrator responsibility Ÿ Navigate to Concurrent > Program > Define Ÿ Query the concurrent program (report) which you want to trace. Ÿ Locate the “Options” field and enter the following values : Ÿ TRACEOPTS=<trace option> TRACEFILE=<path/file> Ÿ Save the concurrent program Ÿ Run the report and a trace file will be generated. Ÿ Remember to clear the trace options after running the report. – Enabling Reports Trace (11 i 10) Ÿ Use the Debug Options page at request submission.
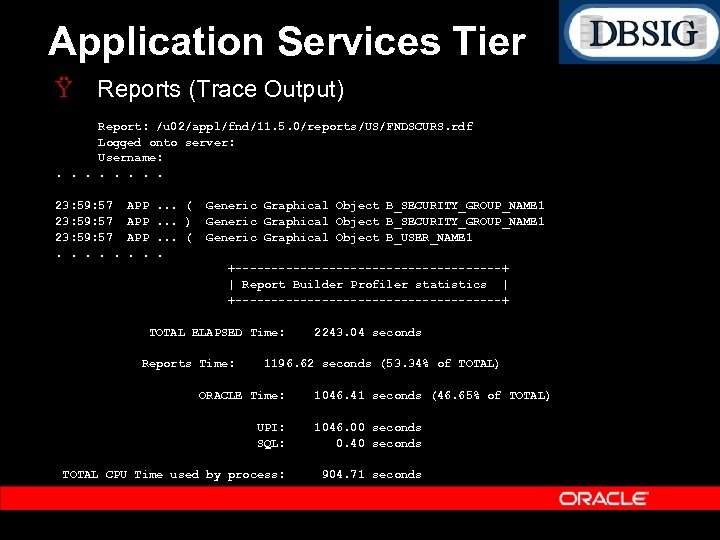
Application Services Tier Ÿ Reports (Trace Output) Report: /u 02/appl/fnd/11. 5. 0/reports/US/FNDSCURS. rdf Logged onto server: Username: . . . . 23: 59: 57. . . APP APP. . . (. . . ). . . (. Generic Graphical Object B_SECURITY_GROUP_NAME 1 Generic Graphical Object B_USER_NAME 1 +-------------------+ | Report Builder Profiler statistics | +-------------------+ TOTAL ELAPSED Time: Reports Time: 2243. 04 seconds 1196. 62 seconds (53. 34% of TOTAL) ORACLE Time: 1046. 41 seconds (46. 65% of TOTAL) UPI: SQL: 1046. 00 seconds 0. 40 seconds TOTAL CPU Time used by process: 904. 71 seconds

Application Services Tier Ÿ Concurrent Manager – – Avoid enabling an excessive number of standard or specialized managers. Use specialization rules and work shifts to bind specific jobs to specific time windows. Ÿ Helps avoid scheduling resource intensive batch requests during peak activity. – For jobs which spawn parallel workers such as Auto Invoice or Payroll, set the sleep time of the Conflict Resolution Manager (CRM) to null (i. e. 10 seconds). The default value is 60 seconds.
Application Services Tier Ÿ Concurrent Manager – Database Resource Manager Integration Ÿ Define Resource Consumer Groups and associate specific concurrent programs with a resource group. Ÿ Allows an administrator to constrain the amount of CPU resources used by a concurrent program. Ÿ Resource Groups can also be defined for online users using the profile “FND: Resource Consumer Group”.
Application Services Tier Ÿ Concurrent Manager – Transaction Managers Ÿ Ÿ Ÿ Used for Inventory Transactions as well as other synchronous online processing. Ensure enough transaction managers exist to service the request load. Set the profile “Concurrent: Wait for Available TM” to 1 (second). Set “TP: INV Transaction processing mode” to “On line processing” for small inventory requests from the UI. Set the sleep time on the transaction managers to a high number (e. g. 10 minutes). Avoids constant polls to check for shutdown requests. Transaction Managers can also be traced.
Application Services Tier Ÿ Concurrent Manager – Enabling Tracing Ÿ Program Level Enable the trace option in the concurrent program definition form. Ÿ Request Level (new in 11 i 10) Use the Debug Options button in the Request Submission Form The profile “Concurrent: Allow Debugging” should be set to “Yes. ”
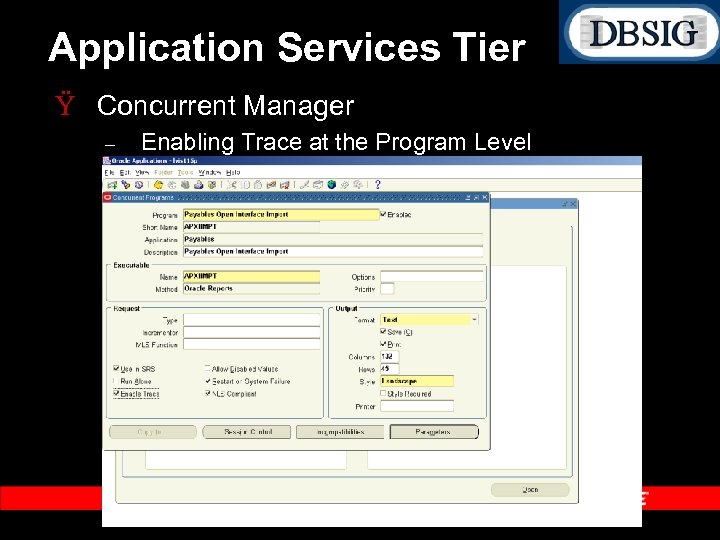
Application Services Tier Ÿ Concurrent Manager – Enabling Trace at the Program Level
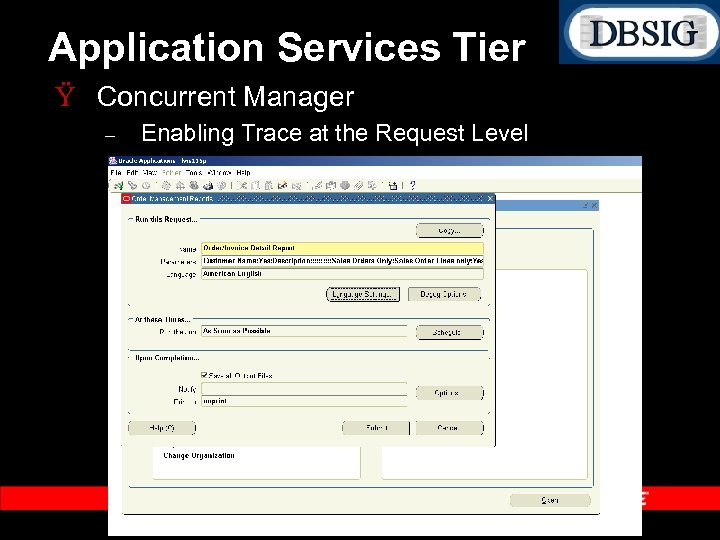
Application Services Tier Ÿ Concurrent Manager – Enabling Trace at the Request Level
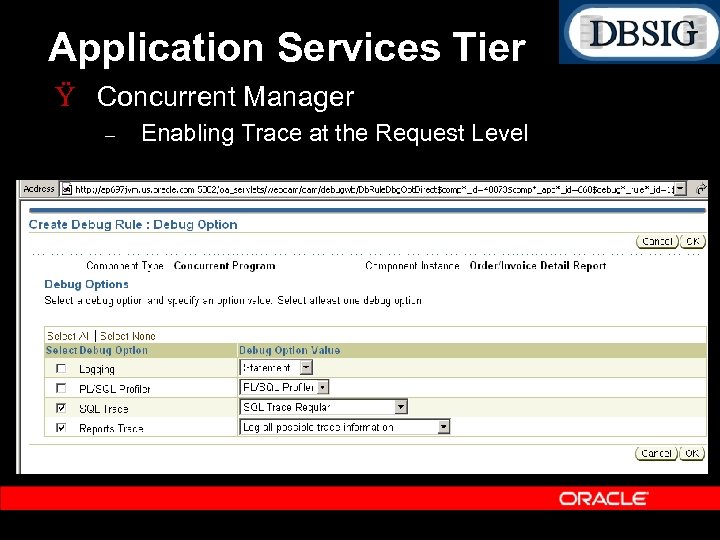
Application Services Tier Ÿ Concurrent Manager – Enabling Trace at the Request Level
Application Services Tier Ÿ Apache – – – On UNIX, Apache is process based (httpd), and mods such as mod PL/SQL run within the process address space of the httpd processes. On Windows, Apache is multi threaded (Apache. exe). Tune the number of processes and number of clients (httpds. conf): Ÿ Ÿ Min. Spare. Servers 5 Max. Spare. Servers 10 Start. Servers 5 Max. Clients 512
Application Services Tier Ÿ Apache – – Minimize levels of logging (httpds. conf): Ÿ Log. Level warn Ÿ SSLLog. Level warn Enable Caching of non HTML resources including images, style sheets, and Java script. Ÿ Caches content in the browser cache. Reduces network round trips (non SSL) Reduces network bandwidth utilization (SSL) Ÿ Included in Auto. Config templates in 11. 5. 8 (or higher).
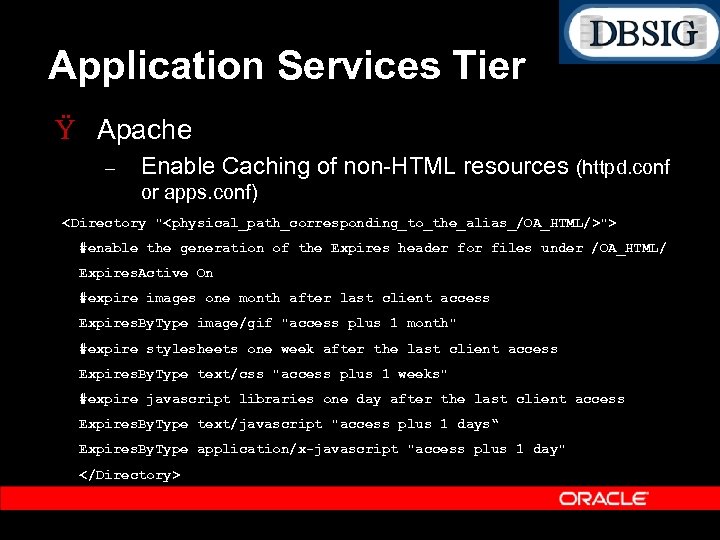
Application Services Tier Ÿ Apache – Enable Caching of non HTML resources (httpd. conf or apps. conf) <Directory "<physical_path_corresponding_to_the_alias_/OA_HTML/>"> #enable the generation of the Expires header for files under /OA_HTML/ Expires. Active On #expire images one month after last client access Expires. By. Type image/gif "access plus 1 month" #expire stylesheets one week after the last client access Expires. By. Type text/css "access plus 1 weeks" #expire javascript libraries one day after the last client access Expires. By. Type text/javascript "access plus 1 days“ Expires. By. Type application/x-javascript "access plus 1 day" </Directory>
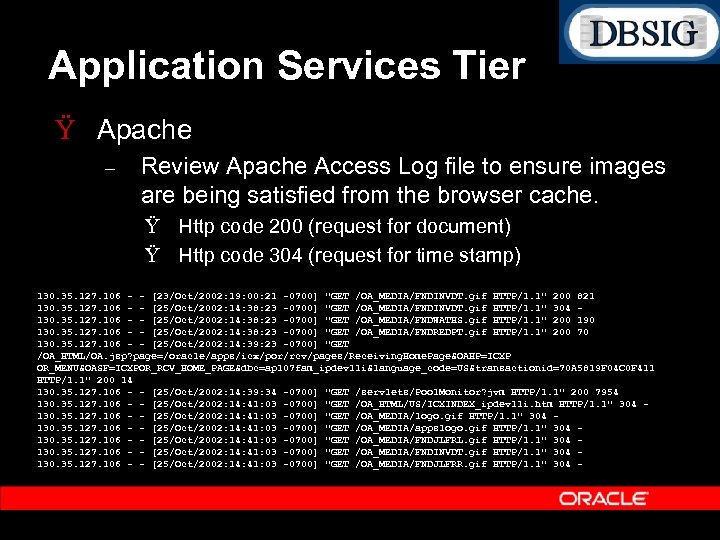
Application Services Tier Ÿ Apache – Review Apache Access Log file to ensure images are being satisfied from the browser cache. Ÿ Http code 200 (request for document) Ÿ Http code 304 (request for time stamp) 130. 35. 127. 106 - - [23/Oct/2002: 19: 00: 21 -0700] "GET /OA_MEDIA/FNDINVDT. gif HTTP/1. 1" 200 821 130. 35. 127. 106 - - [25/Oct/2002: 14: 38: 23 -0700] "GET /OA_MEDIA/FNDINVDT. gif HTTP/1. 1" 304 130. 35. 127. 106 - - [25/Oct/2002: 14: 38: 23 -0700] "GET /OA_MEDIA/FNDWATHS. gif HTTP/1. 1" 200 190 130. 35. 127. 106 - - [25/Oct/2002: 14: 38: 23 -0700] "GET /OA_MEDIA/FNDREDPT. gif HTTP/1. 1" 200 70 130. 35. 127. 106 - - [25/Oct/2002: 14: 39: 23 -0700] "GET /OA_HTML/OA. jsp? page=/oracle/apps/icx/por/rcv/pages/Receiving. Home. Page&OAHP=ICXP OR_MENU&OASF=ICXPOR_RCV_HOME_PAGE&dbc=ap 107 fam_ipdev 11 i&language_code=US&transactionid=70 A 5819 F 04 C 0 F 411 HTTP/1. 1" 200 14 130. 35. 127. 106 - - [25/Oct/2002: 14: 39: 34 -0700] "GET /servlets/Pool. Monitor? jvm HTTP/1. 1" 200 7954 130. 35. 127. 106 - - [25/Oct/2002: 14: 41: 03 -0700] "GET /OA_HTML/US/ICXINDEX_ipdev 11 i. htm HTTP/1. 1" 304 130. 35. 127. 106 - - [25/Oct/2002: 14: 41: 03 -0700] "GET /OA_MEDIA/logo. gif HTTP/1. 1" 304 130. 35. 127. 106 - - [25/Oct/2002: 14: 41: 03 -0700] "GET /OA_MEDIA/appslogo. gif HTTP/1. 1" 304 130. 35. 127. 106 - - [25/Oct/2002: 14: 41: 03 -0700] "GET /OA_MEDIA/FNDJLFRL. gif HTTP/1. 1" 304 130. 35. 127. 106 - - [25/Oct/2002: 14: 41: 03 -0700] "GET /OA_MEDIA/FNDINVDT. gif HTTP/1. 1" 304 130. 35. 127. 106 - - [25/Oct/2002: 14: 41: 03 -0700] "GET /OA_MEDIA/FNDJLFRR. gif HTTP/1. 1" 304 -

Application Services Tier Ÿ Apache Mod PL/SQL – Configure a dedicated mod PL/SQL Listener Ÿ Improves performance and scalability Significantly reduces overall number of sessions/connections. Reduces latency of web requests. Improves cursor sharing. Ÿ Documented in “Oracle 9 i Application Server Using the PL/SQL Gateway Release 1 (v 1. 0. 2. 2)” http: //technet. oracle. com/docs/products/ias/doc_library/102 2 doc_otn/apps. 102/a 90099/apptroub. htm#634180
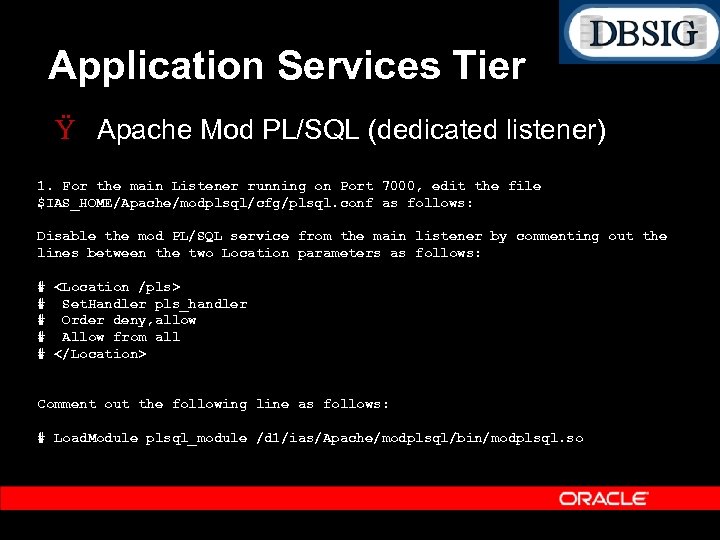
Application Services Tier Ÿ Apache Mod PL/SQL (dedicated listener) 1. For the main Listener running on Port 7000, edit the file $IAS_HOME/Apache/modplsql/cfg/plsql. conf as follows: Disable the mod PL/SQL service from the main listener by commenting out the lines between the two Location parameters as follows: # <Location /pls> # Set. Handler pls_handler # Order deny, allow # Allow from all # </Location> Comment out the following line as follows: # Load. Module plsql_module /d 1/ias/Apache/modplsql/bin/modplsql. so
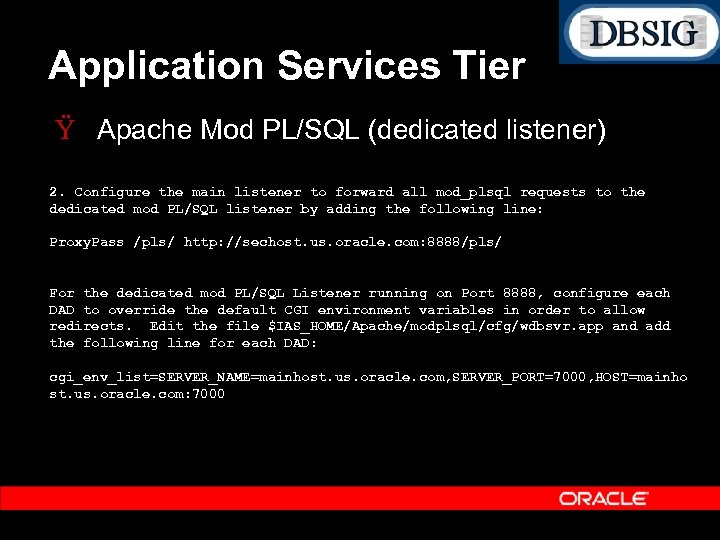
Application Services Tier Ÿ Apache Mod PL/SQL (dedicated listener) 2. Configure the main listener to forward all mod_plsql requests to the dedicated mod PL/SQL listener by adding the following line: Proxy. Pass /pls/ http: //sechost. us. oracle. com: 8888/pls/ For the dedicated mod PL/SQL Listener running on Port 8888, configure each DAD to override the default CGI environment variables in order to allow redirects. Edit the file $IAS_HOME/Apache/modplsql/cfg/wdbsvr. app and add the following line for each DAD: cgi_env_list=SERVER_NAME=mainhost. us. oracle. com, SERVER_PORT=7000, HOST=mainho st. us. oracle. com: 7000
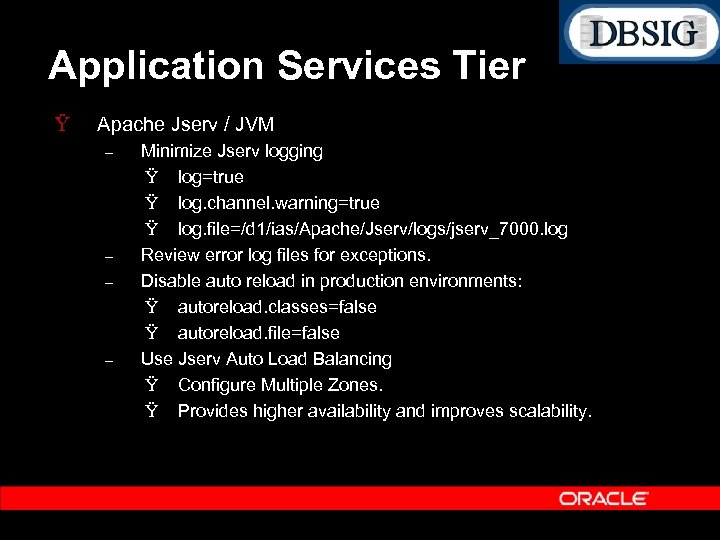
Application Services Tier Ÿ Apache Jserv / JVM – – Minimize Jserv logging Ÿ log=true Ÿ log. channel. warning=true Ÿ log. file=/d 1/ias/Apache/Jserv/logs/jserv_7000. log Review error log files for exceptions. Disable auto reload in production environments: Ÿ autoreload. classes=false Ÿ autoreload. file=false Use Jserv Auto Load Balancing Ÿ Configure Multiple Zones. Ÿ Provides higher availability and improves scalability.
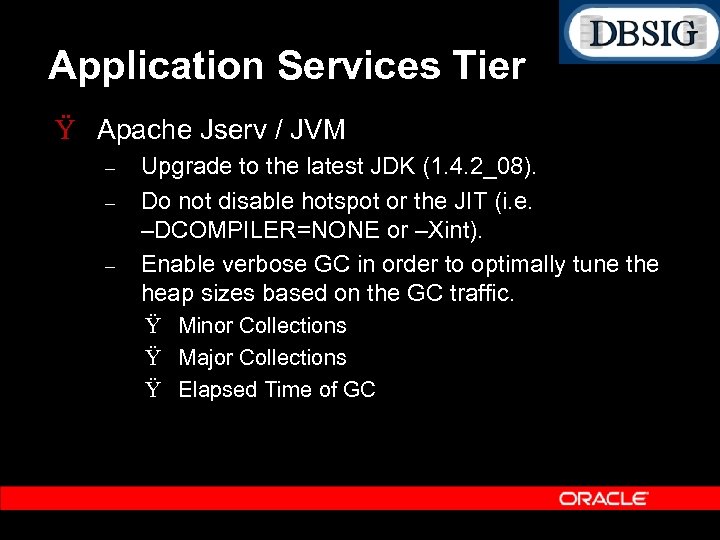
Application Services Tier Ÿ Apache Jserv / JVM – – – Upgrade to the latest JDK (1. 4. 2_08). Do not disable hotspot or the JIT (i. e. –DCOMPILER=NONE or –Xint). Enable verbose GC in order to optimally tune the heap sizes based on the GC traffic. Ÿ Minor Collections Ÿ Major Collections Ÿ Elapsed Time of GC
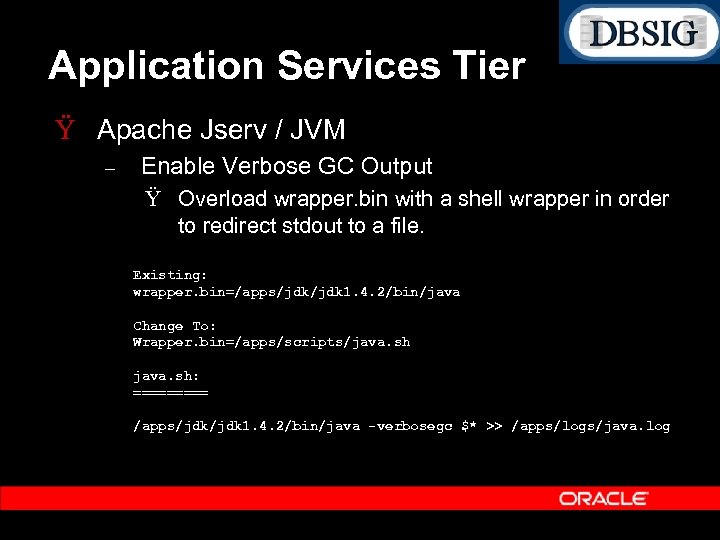
Application Services Tier Ÿ Apache Jserv / JVM – Enable Verbose GC Output Ÿ Overload wrapper. bin with a shell wrapper in order to redirect stdout to a file. Existing: wrapper. bin=/apps/jdk 1. 4. 2/bin/java Change To: Wrapper. bin=/apps/scripts/java. sh: ===== /apps/jdk 1. 4. 2/bin/java -verbosegc $* >> /apps/logs/java. log
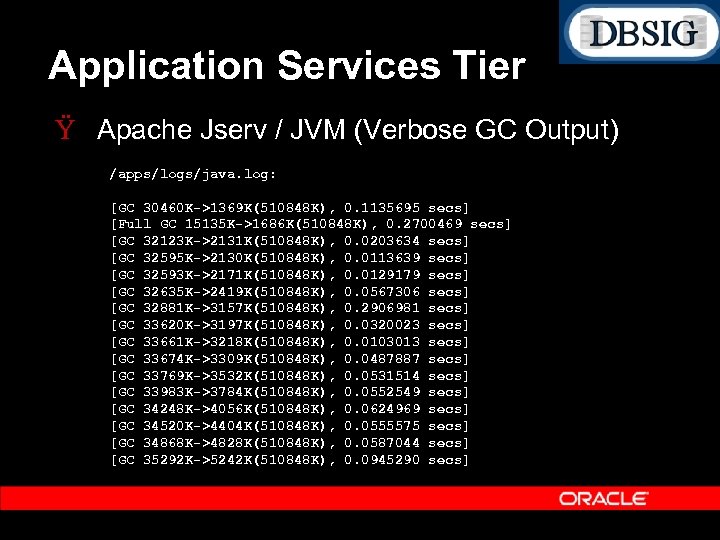
Application Services Tier Ÿ Apache Jserv / JVM (Verbose GC Output) /apps/logs/java. log: [GC 30460 K->1369 K(510848 K), 0. 1135695 secs] [Full GC 15135 K->1686 K(510848 K), 0. 2700469 secs] [GC 32123 K->2131 K(510848 K), 0. 0203634 secs] [GC 32595 K->2130 K(510848 K), 0. 0113639 secs] [GC 32593 K->2171 K(510848 K), 0. 0129179 secs] [GC 32635 K->2419 K(510848 K), 0. 0567306 secs] [GC 32881 K->3157 K(510848 K), 0. 2906981 secs] [GC 33620 K->3197 K(510848 K), 0. 0320023 secs] [GC 33661 K->3218 K(510848 K), 0. 0103013 secs] [GC 33674 K->3309 K(510848 K), 0. 0487887 secs] [GC 33769 K->3532 K(510848 K), 0. 0531514 secs] [GC 33983 K->3784 K(510848 K), 0. 0552549 secs] [GC 34248 K->4056 K(510848 K), 0. 0624969 secs] [GC 34520 K->4404 K(510848 K), 0. 0555575 secs] [GC 34868 K->4828 K(510848 K), 0. 0587044 secs] [GC 35292 K->5242 K(510848 K), 0. 0945290 secs]
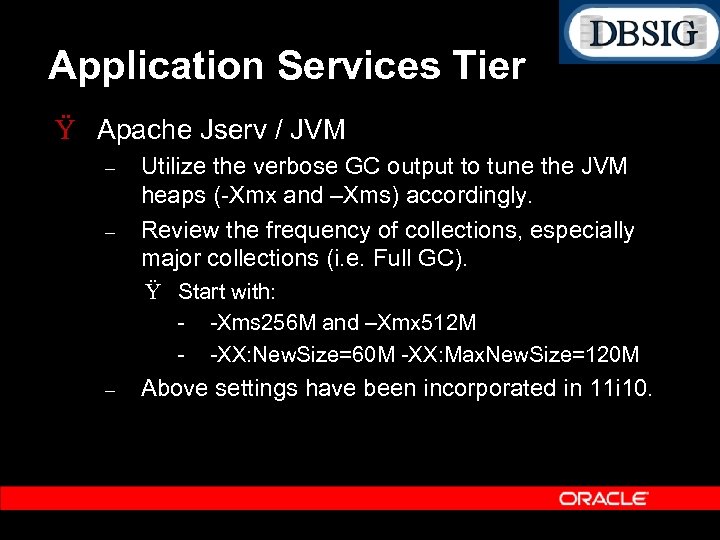
Application Services Tier Ÿ Apache Jserv / JVM – – Utilize the verbose GC output to tune the JVM heaps ( Xmx and –Xms) accordingly. Review the frequency of collections, especially major collections (i. e. Full GC). Ÿ Start with: Xms 256 M and –Xmx 512 M XX: New. Size=60 M XX: Max. New. Size=120 M – Above settings have been incorporated in 11 i 10.
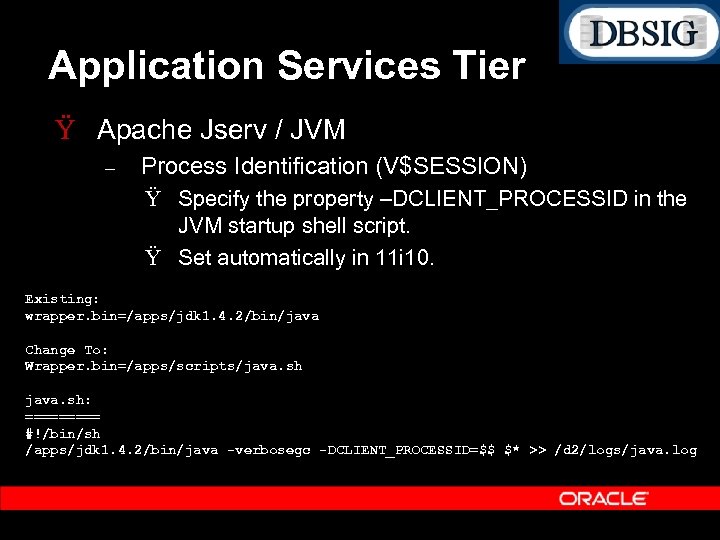
Application Services Tier Ÿ Apache Jserv / JVM – Process Identification (V$SESSION) Ÿ Specify the property –DCLIENT_PROCESSID in the JVM startup shell script. Ÿ Set automatically in 11 i 10. Existing: wrapper. bin=/apps/jdk 1. 4. 2/bin/java Change To: Wrapper. bin=/apps/scripts/java. sh: ===== #!/bin/sh /apps/jdk 1. 4. 2/bin/java -verbosegc -DCLIENT_PROCESSID=$$ $* >> /d 2/logs/java. log
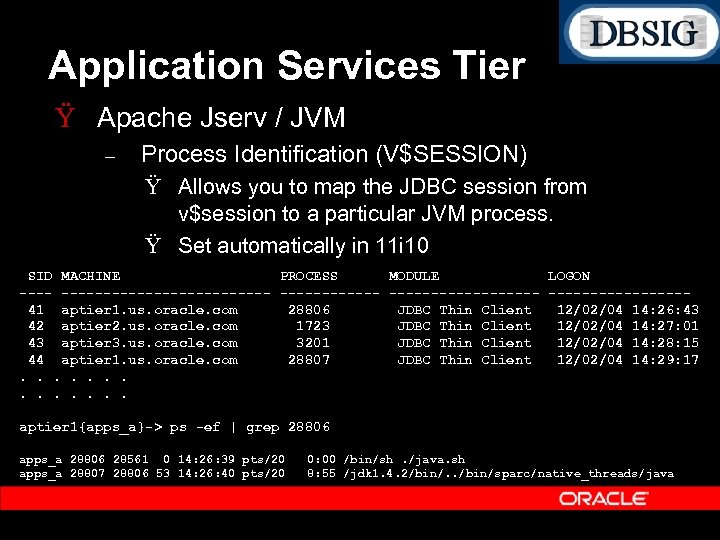
Application Services Tier Ÿ Apache Jserv / JVM – Process Identification (V$SESSION) Ÿ Allows you to map the JDBC session from v$session to a particular JVM process. Ÿ Set automatically in 11 i 10 SID MACHINE PROCESS MODULE LOGON ------------------ --------41 aptier 1. us. oracle. com 28806 JDBC Thin Client 12/02/04 14: 26: 43 42 aptier 2. us. oracle. com 1723 JDBC Thin Client 12/02/04 14: 27: 01 43 aptier 3. us. oracle. com 3201 JDBC Thin Client 12/02/04 14: 28: 15 44 aptier 1. us. oracle. com 28807 JDBC Thin Client 12/02/04 14: 29: 17. . . aptier 1{apps_a}-> ps -ef | grep 28806 apps_a 28806 28561 0 14: 26: 39 pts/20 apps_a 28807 28806 53 14: 26: 40 pts/20 0: 00 /bin/sh. /java. sh 8: 55 /jdk 1. 4. 2/bin/. . /bin/sparc/native_threads/java
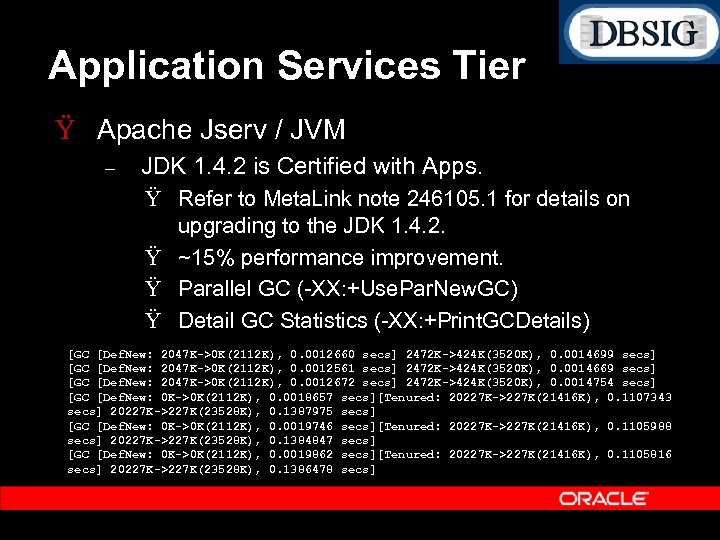
Application Services Tier Ÿ Apache Jserv / JVM – JDK 1. 4. 2 is Certified with Apps. Ÿ Refer to Meta. Link note 246105. 1 for details on upgrading to the JDK 1. 4. 2. Ÿ ~15% performance improvement. Ÿ Parallel GC ( XX: +Use. Par. New. GC) Ÿ Detail GC Statistics ( XX: +Print. GCDetails) [GC [Def. New: 2047 K->0 K(2112 K), 0. 0012660 secs] 2472 K->424 K(3520 K), 0. 0014699 secs] [GC [Def. New: 2047 K->0 K(2112 K), 0. 0012561 secs] 2472 K->424 K(3520 K), 0. 0014669 secs] [GC [Def. New: 2047 K->0 K(2112 K), 0. 0012672 secs] 2472 K->424 K(3520 K), 0. 0014754 secs] [GC [Def. New: 0 K->0 K(2112 K), 0. 0018657 secs][Tenured: 20227 K->227 K(21416 K), 0. 1107343 secs] 20227 K->227 K(23528 K), 0. 1387975 secs] [GC [Def. New: 0 K->0 K(2112 K), 0. 0019746 secs][Tenured: 20227 K->227 K(21416 K), 0. 1105988 secs] 20227 K->227 K(23528 K), 0. 1384847 secs] [GC [Def. New: 0 K->0 K(2112 K), 0. 0019862 secs][Tenured: 20227 K->227 K(21416 K), 0. 1105816 secs] 20227 K->227 K(23528 K), 0. 1386478 secs]
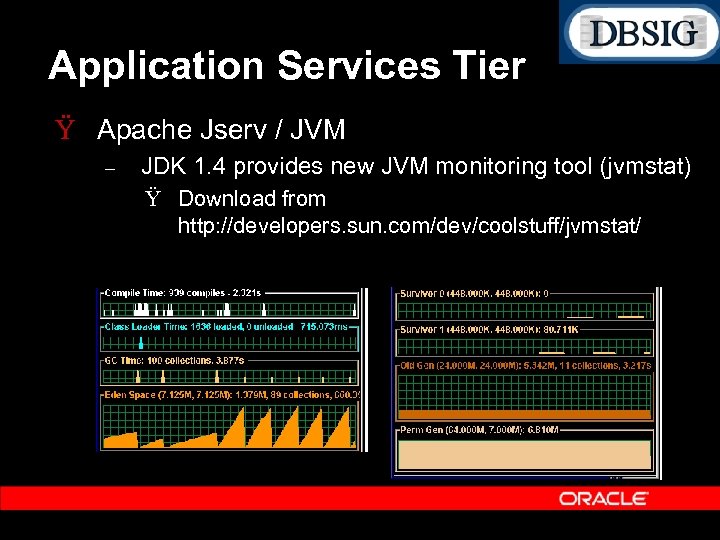
Application Services Tier Ÿ Apache Jserv / JVM – JDK 1. 4 provides new JVM monitoring tool (jvmstat) Ÿ Download from http: //developers. sun. com/dev/coolstuff/jvmstat/
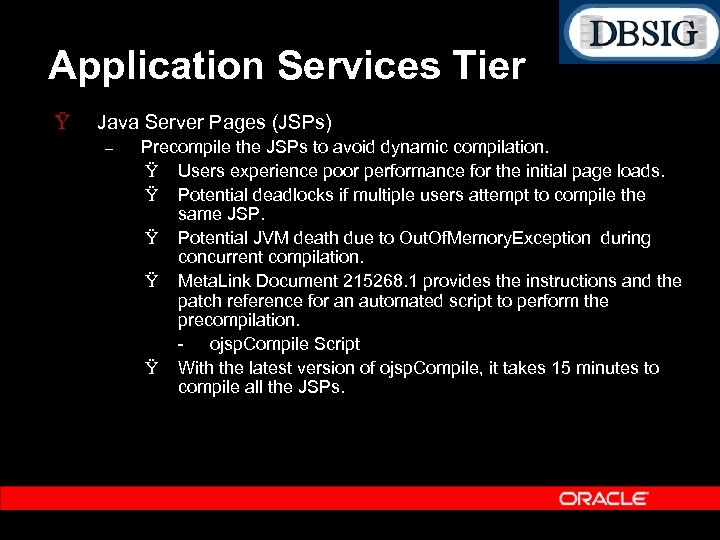
Application Services Tier Ÿ Java Server Pages (JSPs) – Precompile the JSPs to avoid dynamic compilation. Ÿ Users experience poor performance for the initial page loads. Ÿ Potential deadlocks if multiple users attempt to compile the same JSP. Ÿ Potential JVM death due to Out. Of. Memory. Exception during concurrent compilation. Ÿ Meta. Link Document 215268. 1 provides the instructions and the patch reference for an automated script to perform the precompilation. ojsp. Compile Script Ÿ With the latest version of ojsp. Compile, it takes 15 minutes to compile all the JSPs.
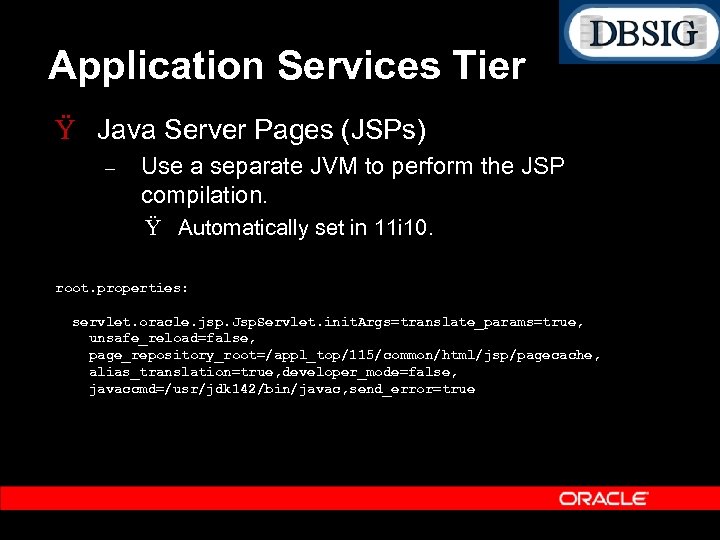
Application Services Tier Ÿ Java Server Pages (JSPs) – Use a separate JVM to perform the JSP compilation. Ÿ Automatically set in 11 i 10. root. properties: servlet. oracle. jsp. Jsp. Servlet. init. Args=translate_params=true, unsafe_reload=false, page_repository_root=/appl_top/115/common/html/jsp/pagecache, alias_translation=true, developer_mode=false, javaccmd=/usr/jdk 142/bin/javac, send_error=true
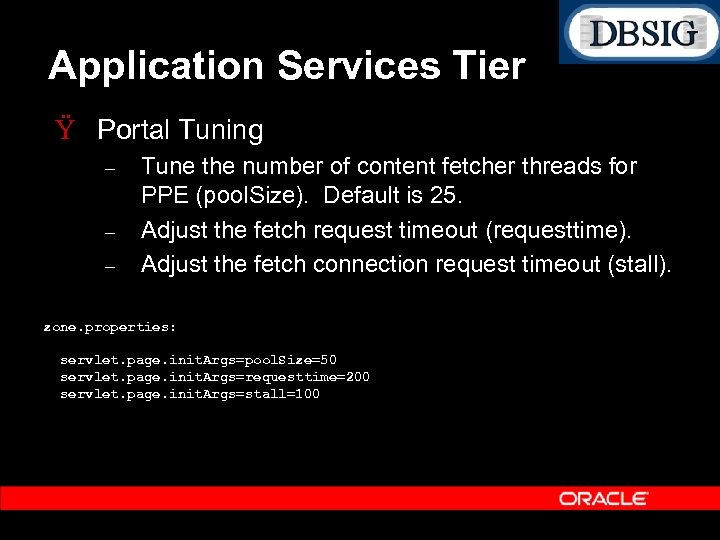
Application Services Tier Ÿ Portal Tuning – – – Tune the number of content fetcher threads for PPE (pool. Size). Default is 25. Adjust the fetch request timeout (requesttime). Adjust the fetch connection request timeout (stall). zone. properties: servlet. page. init. Args=pool. Size=50 servlet. page. init. Args=requesttime=200 servlet. page. init. Args=stall=100
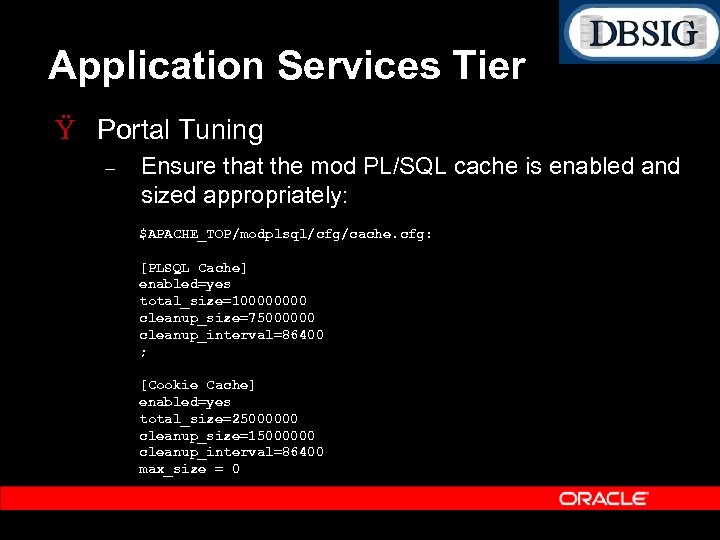
Application Services Tier Ÿ Portal Tuning – Ensure that the mod PL/SQL cache is enabled and sized appropriately: $APACHE_TOP/modplsql/cfg/cache. cfg: [PLSQL Cache] enabled=yes total_size=10000 cleanup_size=75000000 cleanup_interval=86400 ; [Cookie Cache] enabled=yes total_size=25000000 cleanup_size=15000000 cleanup_interval=86400 max_size = 0
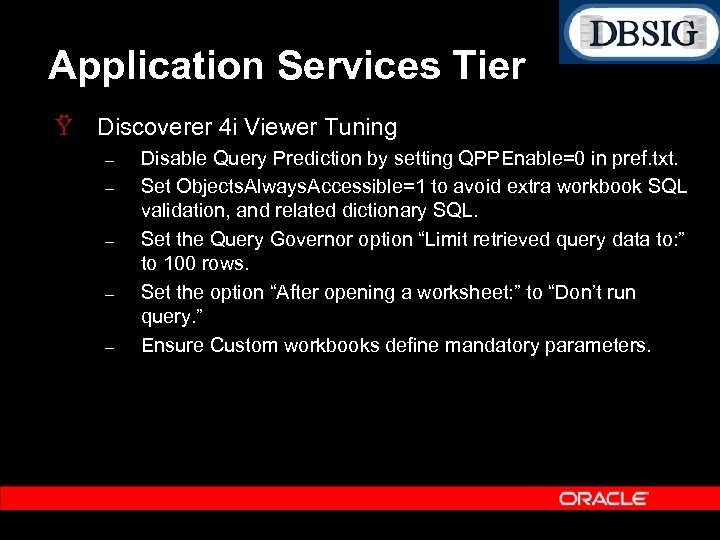
Application Services Tier Ÿ Discoverer 4 i Viewer Tuning – – – Disable Query Prediction by setting QPPEnable=0 in pref. txt. Set Objects. Always. Accessible=1 to avoid extra workbook SQL validation, and related dictionary SQL. Set the Query Governor option “Limit retrieved query data to: ” to 100 rows. Set the option “After opening a worksheet: ” to “Don’t run query. ” Ensure Custom workbooks define mandatory parameters.
Network Performance Ÿ Network performance is often neglected. Ÿ Networks with poor latency or low bandwidth impacts user response time. Ÿ Can also impact concurrent programs if the network between the application tier and data server tier is not optimal. Ÿ A direct switch should be used between the application tier and data server tier – Latency should ideally be ~1 2 ms per round trip.
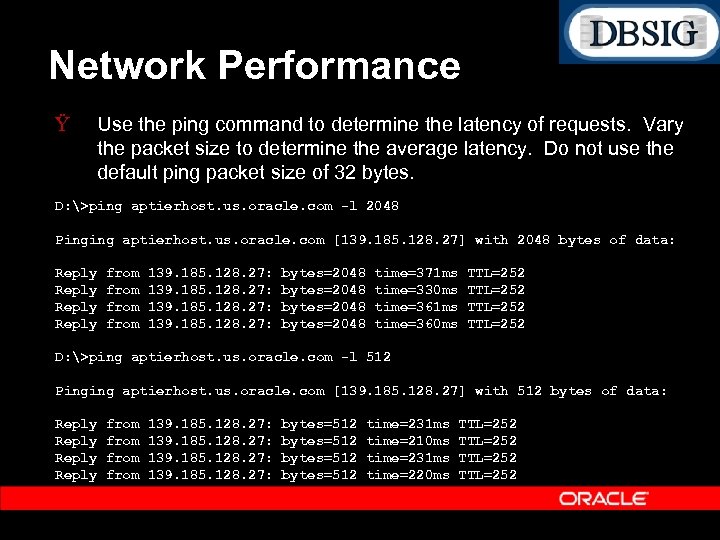
Network Performance Ÿ Use the ping command to determine the latency of requests. Vary the packet size to determine the average latency. Do not use the default ping packet size of 32 bytes. D: >ping aptierhost. us. oracle. com -l 2048 Pinging aptierhost. us. oracle. com [139. 185. 128. 27] with 2048 bytes of data: Reply from 139. 185. 128. 27: bytes=2048 time=371 ms time=330 ms time=361 ms time=360 ms TTL=252 D: >ping aptierhost. us. oracle. com -l 512 Pinging aptierhost. us. oracle. com [139. 185. 128. 27] with 512 bytes of data: Reply from 139. 185. 128. 27: bytes=512 time=231 ms time=210 ms time=231 ms time=220 ms TTL=252
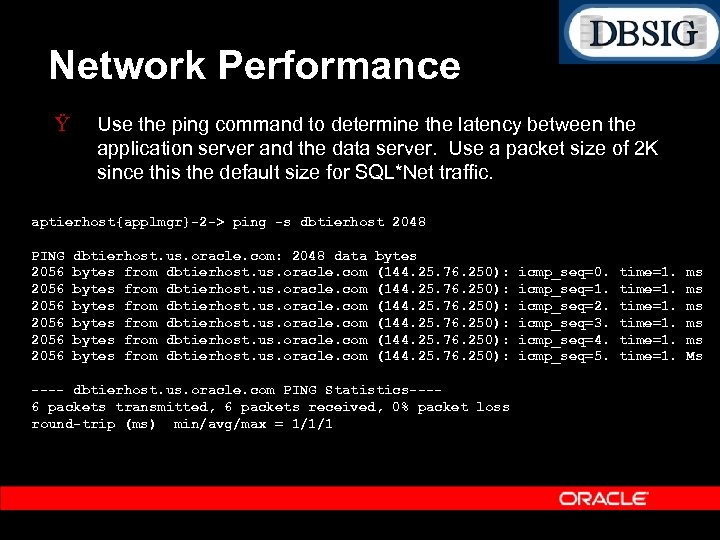
Network Performance Ÿ Use the ping command to determine the latency between the application server and the data server. Use a packet size of 2 K since this the default size for SQL*Net traffic. aptierhost{applmgr}-2 -> ping -s dbtierhost 2048 PING 2056 2056 dbtierhost. us. oracle. com: 2048 data bytes from dbtierhost. us. oracle. com bytes (144. 25. 76. 250): ---- dbtierhost. us. oracle. com PING Statistics---6 packets transmitted, 6 packets received, 0% packet loss round-trip (ms) min/avg/max = 1/1/1 icmp_seq=0. icmp_seq=1. icmp_seq=2. icmp_seq=3. icmp_seq=4. icmp_seq=5. time=1. ms ms ms Ms
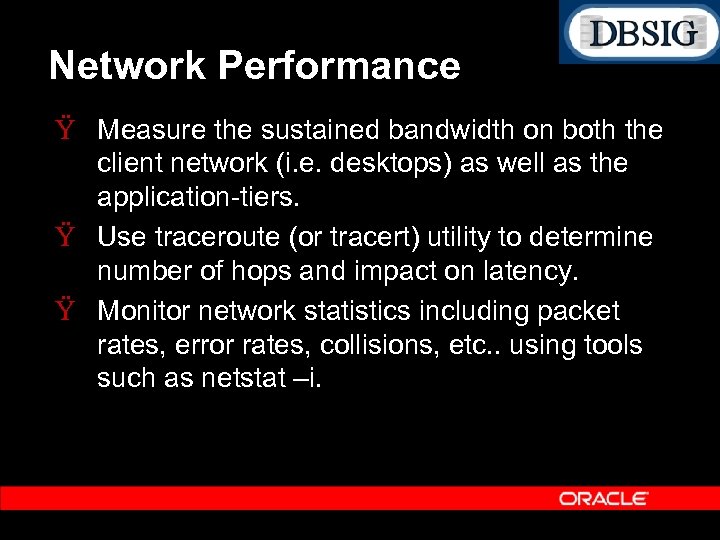
Network Performance Ÿ Measure the sustained bandwidth on both the client network (i. e. desktops) as well as the application tiers. Ÿ Use traceroute (or tracert) utility to determine number of hops and impact on latency. Ÿ Monitor network statistics including packet rates, error rates, collisions, etc. . using tools such as netstat –i.
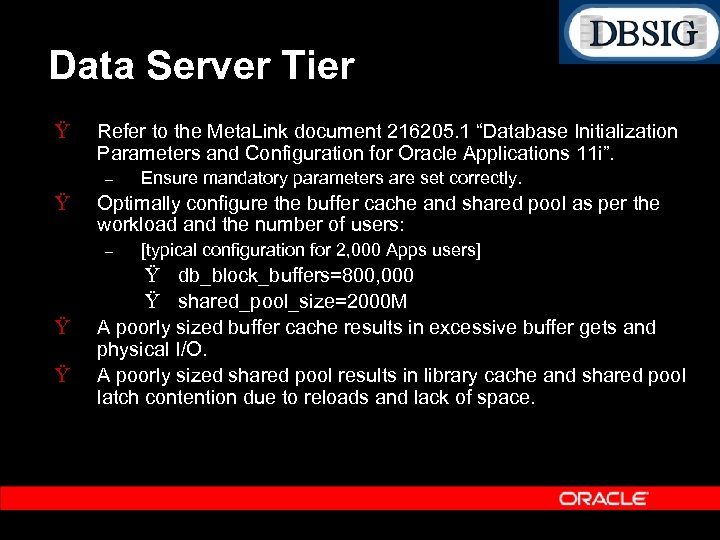
Data Server Tier Ÿ Refer to the Meta. Link document 216205. 1 “Database Initialization Parameters and Configuration for Oracle Applications 11 i”. – Ÿ Optimally configure the buffer cache and shared pool as per the workload and the number of users: – Ÿ Ÿ Ensure mandatory parameters are set correctly. [typical configuration for 2, 000 Apps users] Ÿ db_block_buffers=800, 000 Ÿ shared_pool_size=2000 M A poorly sized buffer cache results in excessive buffer gets and physical I/O. A poorly sized shared pool results in library cache and shared pool latch contention due to reloads and lack of space.
Data Server Tier Ÿ Enable asynchronous I/O Ÿ Consider using Quick I/O or equivalent if using file system based files for the DB files. – Quick I/O improves performance and scalability by simulating raw devices, and avoiding file system cache traffic for the DB files. Ÿ Use locally managed temp files (uniform) for the temporary tablespace. Ÿ Install Stats Pack (spcreate. sql) and use spauto. sql to automate hourly snapshots. Ÿ Stats Pack reports can be used to trend transaction rates and business flows.
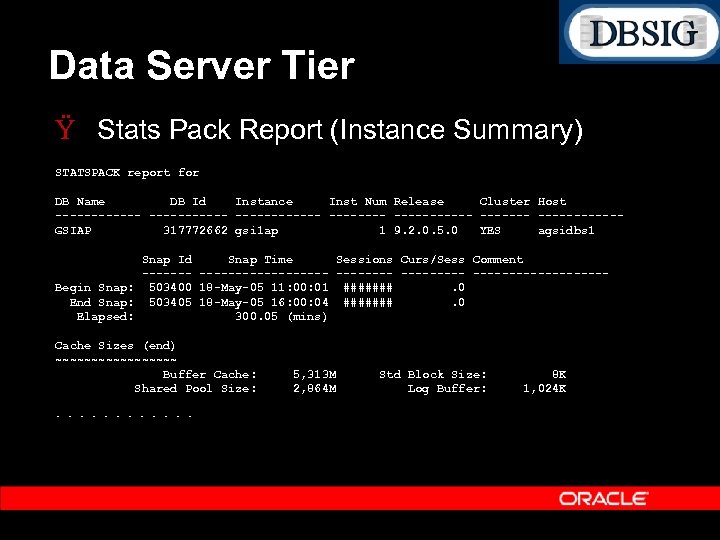
Data Server Tier Ÿ Stats Pack Report (Instance Summary) STATSPACK report for DB Name DB Id Instance Inst Num Release Cluster Host -------------------GSIAP 317772662 gsi 1 ap 1 9. 2. 0. 5. 0 YES agsidbs 1 Snap Id Snap Time Sessions Curs/Sess Comment ------------- ---------Begin Snap: 503400 18 -May-05 11: 00: 01 #######. 0 End Snap: 503405 18 -May-05 16: 00: 04 #######. 0 Elapsed: 300. 05 (mins) Cache Sizes (end) ~~~~~~~~~ Buffer Cache: Shared Pool Size: . . . 5, 313 M 2, 864 M Std Block Size: Log Buffer: 8 K 1, 024 K
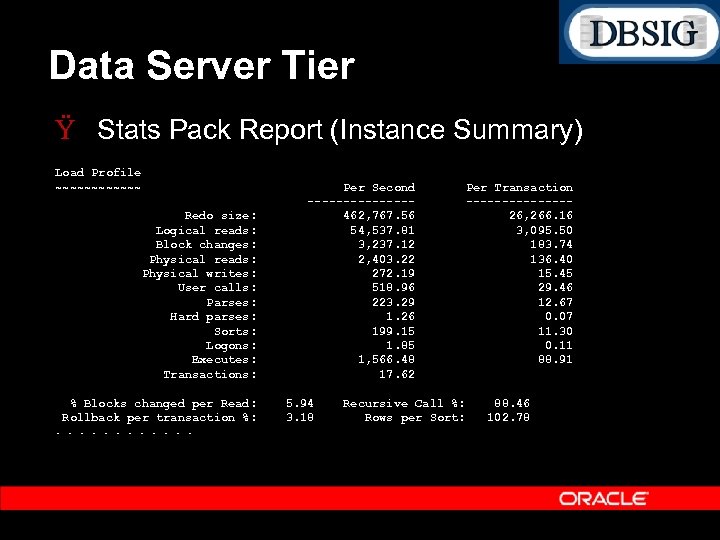
Data Server Tier Ÿ Stats Pack Report (Instance Summary) Load Profile ~~~~~~ Redo size: Logical reads: Block changes: Physical reads: Physical writes: User calls: Parses: Hard parses: Sorts: Logons: Executes: Transactions: % Blocks changed per Read: Rollback per transaction %: . . . Per Second -------462, 767. 56 54, 537. 81 3, 237. 12 2, 403. 22 272. 19 518. 96 223. 29 1. 26 199. 15 1. 85 1, 566. 48 17. 62 5. 94 3. 18 Recursive Call %: Rows per Sort: Per Transaction -------26, 266. 16 3, 095. 50 183. 74 136. 40 15. 45 29. 46 12. 67 0. 07 11. 30 0. 11 88. 91 88. 46 102. 78
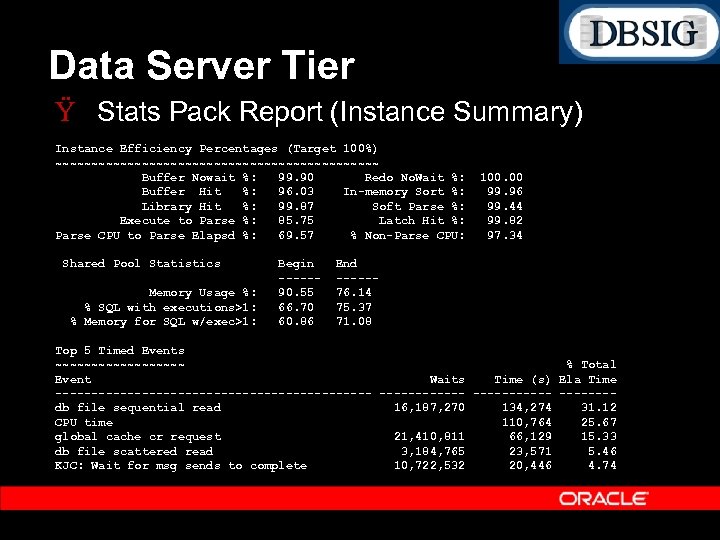
Data Server Tier Ÿ Stats Pack Report (Instance Summary) Instance Efficiency Percentages (Target 100%) ~~~~~~~~~~~~~~~~~~~~~~~ Buffer Nowait %: 99. 90 Redo No. Wait %: Buffer Hit %: 96. 03 In-memory Sort %: Library Hit %: 99. 87 Soft Parse %: Execute to Parse %: 85. 75 Latch Hit %: Parse CPU to Parse Elapsd %: 69. 57 % Non-Parse CPU: Shared Pool Statistics Memory Usage %: % SQL with executions>1: % Memory for SQL w/exec>1: Begin -----90. 55 66. 70 60. 86 100. 00 99. 96 99. 44 99. 82 97. 34 End -----76. 14 75. 37 71. 08 Top 5 Timed Events ~~~~~~~~~ % Total Event Waits Time (s) Ela Time ---------------------- -------db file sequential read 16, 187, 270 134, 274 31. 12 CPU time 110, 764 25. 67 global cache cr request 21, 410, 811 66, 129 15. 33 db file scattered read 3, 184, 765 23, 571 5. 46 KJC: Wait for msg sends to complete 10, 722, 532 20, 446 4. 74
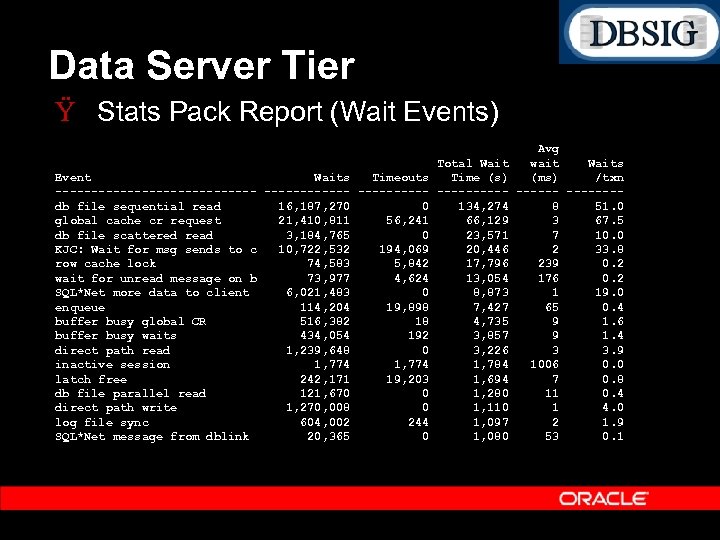
Data Server Tier Ÿ Stats Pack Report (Wait Events) Event Waits Timeouts -------------- -----db file sequential read 16, 187, 270 0 global cache cr request 21, 410, 811 56, 241 db file scattered read 3, 184, 765 0 KJC: Wait for msg sends to c 10, 722, 532 194, 069 row cache lock 74, 583 5, 842 wait for unread message on b 73, 977 4, 624 SQL*Net more data to client 6, 021, 483 0 enqueue 114, 204 19, 898 buffer busy global CR 516, 382 18 buffer busy waits 434, 054 192 direct path read 1, 239, 648 0 inactive session 1, 774 latch free 242, 171 19, 203 db file parallel read 121, 670 0 direct path write 1, 270, 008 0 log file sync 604, 002 244 SQL*Net message from dblink 20, 365 0 Avg Total Wait wait Waits Time (s) (ms) /txn -------134, 274 8 51. 0 66, 129 3 67. 5 23, 571 7 10. 0 20, 446 2 33. 8 17, 796 239 0. 2 13, 054 176 0. 2 8, 873 1 19. 0 7, 427 65 0. 4 4, 735 9 1. 6 3, 857 9 1. 4 3, 226 3 3. 9 1, 784 1006 0. 0 1, 694 7 0. 8 1, 280 11 0. 4 1, 110 1 4. 0 1, 097 2 1. 9 1, 080 53 0. 1
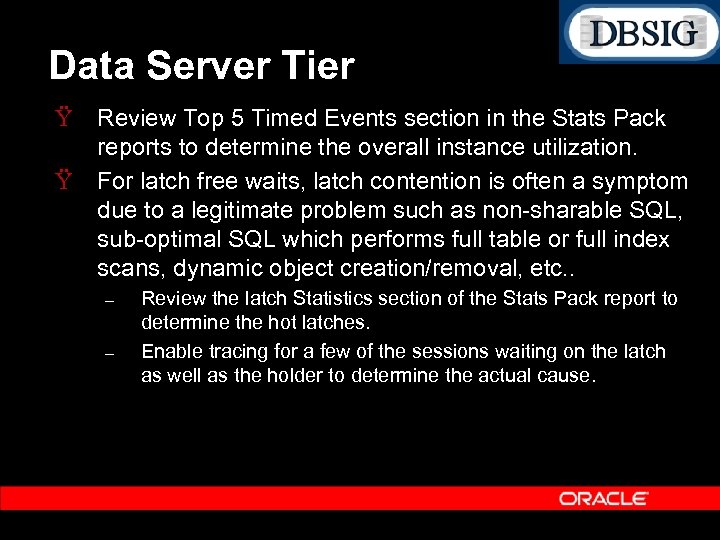
Data Server Tier Ÿ Review Top 5 Timed Events section in the Stats Pack reports to determine the overall instance utilization. Ÿ For latch free waits, latch contention is often a symptom due to a legitimate problem such as non sharable SQL, sub optimal SQL which performs full table or full index scans, dynamic object creation/removal, etc. . – – Review the latch Statistics section of the Stats Pack report to determine the hot latches. Enable tracing for a few of the sessions waiting on the latch as well as the holder to determine the actual cause.
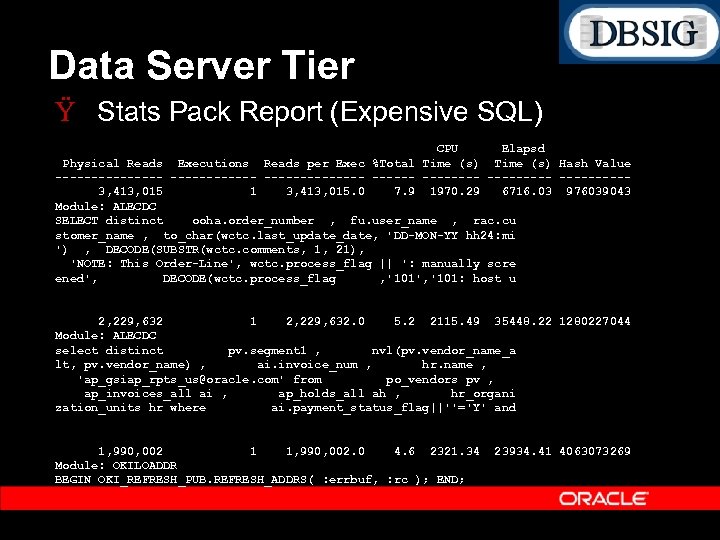
Data Server Tier Ÿ Stats Pack Report (Expensive SQL) CPU Elapsd Physical Reads Executions Reads per Exec %Total Time (s) Hash Value ---------------- ---------3, 413, 015 1 3, 413, 015. 0 7. 9 1970. 29 6716. 03 976039043 Module: ALECDC SELECT distinct ooha. order_number , fu. user_name , rac. cu stomer_name , to_char(wctc. last_update_date, 'DD-MON-YY hh 24: mi ') , DECODE(SUBSTR(wctc. comments, 1, 21), 'NOTE: This Order-Line', wctc. process_flag || ': manually scre ened', DECODE(wctc. process_flag , '101', '101: host u 2, 229, 632 1 2, 229, 632. 0 5. 2 2115. 49 35448. 22 1280227044 Module: ALECDC select distinct pv. segment 1 , nvl(pv. vendor_name_a lt, pv. vendor_name) , ai. invoice_num , hr. name , 'ap_gsiap_rpts_us@oracle. com' from po_vendors pv , ap_invoices_all ai , ap_holds_all ah , hr_organi zation_units hr where ai. payment_status_flag||''='Y' and 1, 990, 002 1 1, 990, 002. 0 4. 6 2321. 34 Module: OKILOADDR BEGIN OKI_REFRESH_PUB. REFRESH_ADDRS( : errbuf, : rc ); END; 23934. 41 4063073269
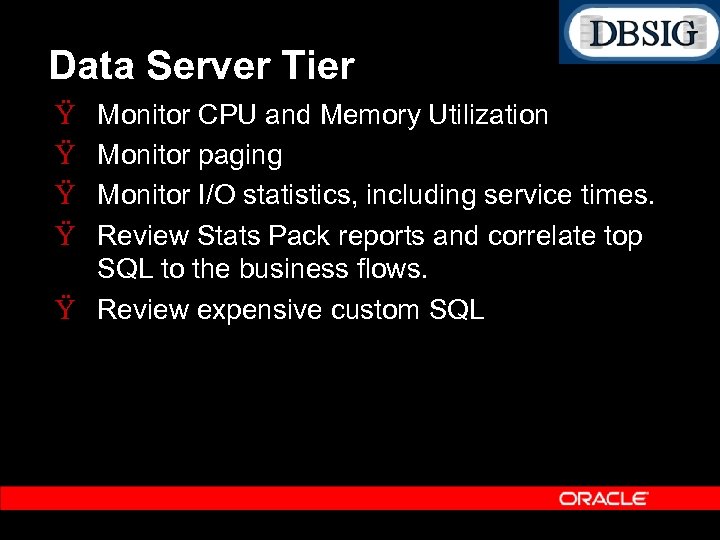
Data Server Tier Ÿ Ÿ Monitor CPU and Memory Utilization Monitor paging Monitor I/O statistics, including service times. Review Stats Pack reports and correlate top SQL to the business flows. Ÿ Review expensive custom SQL
Data Server Tier Ÿ Gathering Statistics – – Do not gather statistics excessively on entire schemas or the entire database such as nightly or weekly. Do not gather statistics on permanent objects during peak intervals. Ÿ Gathering statistics invalidates cursors Ÿ Gathering statistics requires dictionary and object level locks. Ÿ Plans are not likely to change if the data distribution has not changed.
Data Server Tier Ÿ Gathering Statistics – – For tables which are growing at a rapid rate, gather statistics only on those tables. Use only FND_STATS or the Gather Schema and Gather Table Statistics Concurrent Programs Ÿ Do NOT USE the analyze nor dbms_stats command directly. It is not supported, and results in sub optimal plans. – Review the table and index statistics for the objects which appear in the top SQL section of Stats Pack.
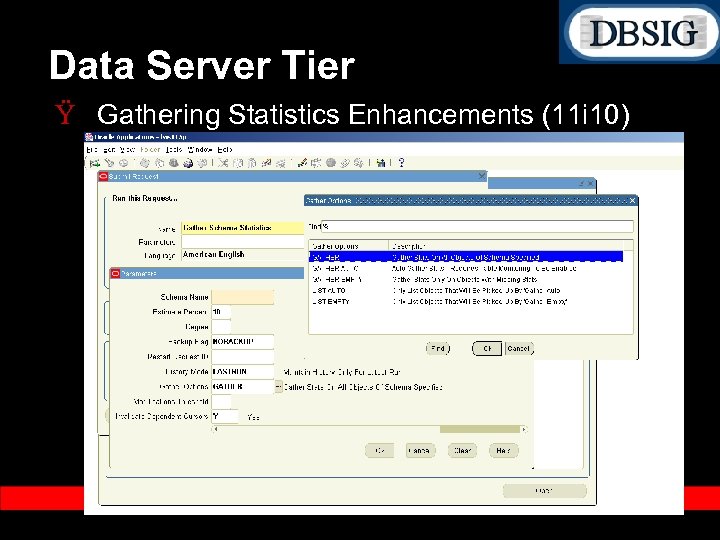
Data Server Tier Ÿ Gathering Statistics Enhancements (11 i 10) – Gather Schema Statistics Ÿ Auto Gather option Gather Statistics only on tables which have changed Change threshold is user definable. Utilizes the Table Monitoring feature. To enable schema monitoring: Ÿ Ÿ Ÿ SQL> exec fnd_stats. ENABLE_SCHEMA_MONITORING() Auto List option Lists the objects which have changed. Maintain history of Statistics Collection No Invalidate Option Does not invalidate cursors.
Data Server Tier Ÿ Gathering Statistics Enhancements (11 i 10)
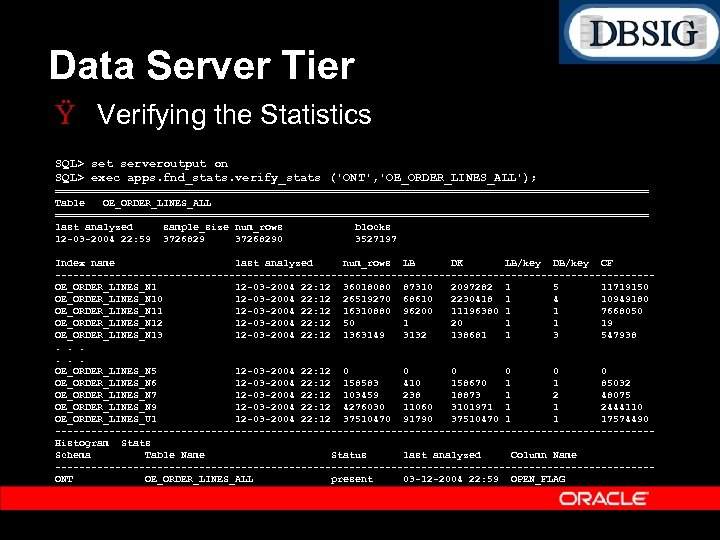
Data Server Tier Ÿ Verifying the Statistics SQL> set serveroutput on SQL> exec apps. fnd_stats. verify_stats ('ONT', 'OE_ORDER_LINES_ALL'); ================================================== Table OE_ORDER_LINES_ALL ================================================== last analyzed sample_size num_rows blocks 12 -03 -2004 22: 59 37268290 3527197 Index name last analyzed num_rows LB DK LB/key DB/key CF --------------------------------------------------OE_ORDER_LINES_N 1 12 -03 -2004 22: 12 36018080 87310 2097282 1 5 11719150 OE_ORDER_LINES_N 10 12 -03 -2004 22: 12 26519270 68610 2230418 1 4 10949180 OE_ORDER_LINES_N 11 12 -03 -2004 22: 12 16310880 96200 11196380 1 1 7668050 OE_ORDER_LINES_N 12 12 -03 -2004 22: 12 50 1 20 1 1 19 OE_ORDER_LINES_N 13 12 -03 -2004 22: 12 1363149 3132 138681 1 3 547938. . . OE_ORDER_LINES_N 5 12 -03 -2004 22: 12 0 0 0 OE_ORDER_LINES_N 6 12 -03 -2004 22: 12 158583 410 158670 1 1 85032 OE_ORDER_LINES_N 7 12 -03 -2004 22: 12 103459 238 18873 1 2 48075 OE_ORDER_LINES_N 9 12 -03 -2004 22: 12 4276030 11060 3101971 1 1 2444110 OE_ORDER_LINES_U 1 12 -03 -2004 22: 12 37510470 91790 37510470 1 1 17574490 --------------------------------------------------Histogram Stats Schema Table Name Status last analyzed Column Name --------------------------------------------------ONT OE_ORDER_LINES_ALL present 03 -12 -2004 22: 59 OPEN_FLAG
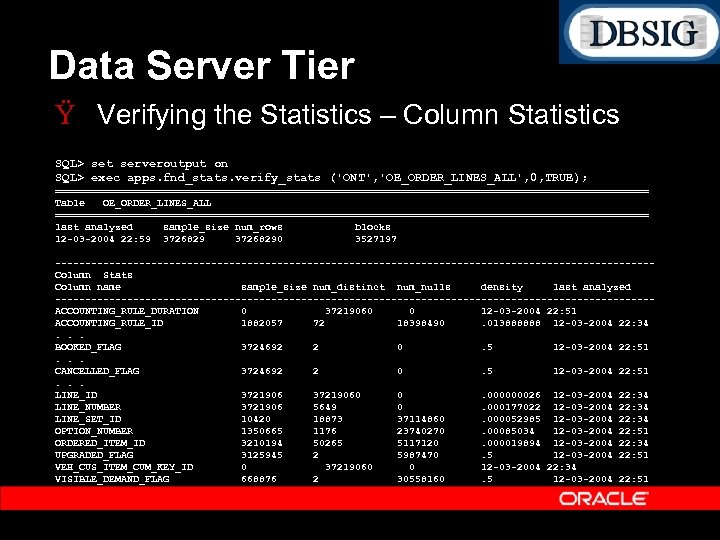
Data Server Tier Ÿ Verifying the Statistics – Column Statistics SQL> set serveroutput on SQL> exec apps. fnd_stats. verify_stats ('ONT', 'OE_ORDER_LINES_ALL', 0, TRUE); ================================================== Table OE_ORDER_LINES_ALL ================================================== last analyzed sample_size num_rows blocks 12 -03 -2004 22: 59 37268290 3527197 --------------------------------------------------Column Stats Column name sample_size num_distinct num_nulls density last analyzed --------------------------------------------------ACCOUNTING_RULE_DURATION 0 37219060 0 12 -03 -2004 22: 51 ACCOUNTING_RULE_ID 1882057 72 18398490. 013888888 12 -03 -2004 22: 34. . . BOOKED_FLAG 3724692 2 0. 5 12 -03 -2004 22: 51. . . CANCELLED_FLAG 3724692 2 0. 5 12 -03 -2004 22: 51. . . LINE_ID 37219060 0. 000000026 12 -03 -2004 22: 34 LINE_NUMBER 3721906 5649 0. 000177022 12 -03 -2004 22: 34 LINE_SET_ID 10420 18873 37114860. 000052985 12 -03 -2004 22: 34 OPTION_NUMBER 1350665 1176 23740270. 00085034 12 -03 -2004 22: 51 ORDERED_ITEM_ID 3210194 50265 5117120. 000019894 12 -03 -2004 22: 34 UPGRADED_FLAG 3125945 2 5987470. 5 12 -03 -2004 22: 51 VEH_CUS_ITEM_CUM_KEY_ID 0 37219060 0 12 -03 -2004 22: 34 VISIBLE_DEMAND_FLAG 668876 2 30558160. 5 12 -03 -2004 22: 51
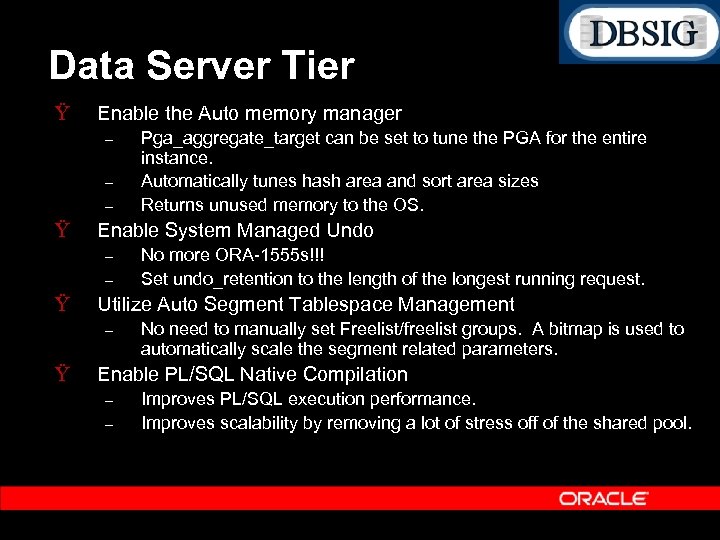
Data Server Tier Ÿ Enable the Auto memory manager – – – Ÿ Enable System Managed Undo – – Ÿ No more ORA 1555 s!!! Set undo_retention to the length of the longest running request. Utilize Auto Segment Tablespace Management – Ÿ Pga_aggregate_target can be set to tune the PGA for the entire instance. Automatically tunes hash area and sort area sizes Returns unused memory to the OS. No need to manually set Freelist/freelist groups. A bitmap is used to automatically scale the segment related parameters. Enable PL/SQL Native Compilation – – Improves PL/SQL execution performance. Improves scalability by removing a lot of stress off of the shared pool.
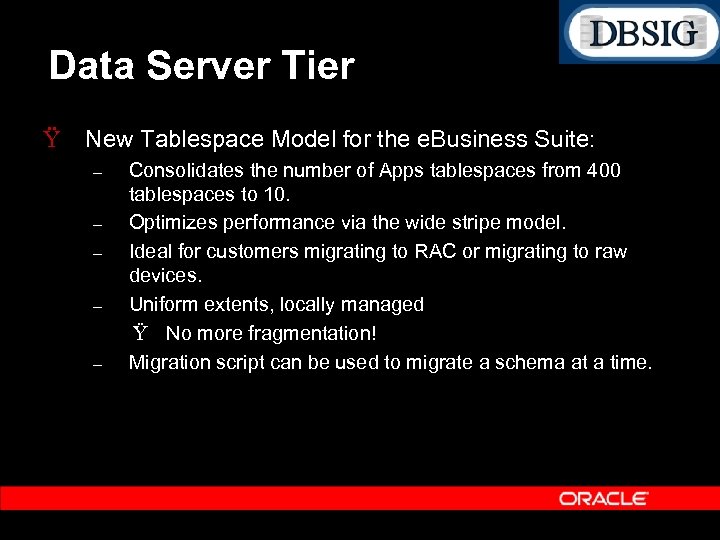
Data Server Tier Ÿ New Tablespace Model for the e. Business Suite: – – – Consolidates the number of Apps tablespaces from 400 tablespaces to 10. Optimizes performance via the wide stripe model. Ideal for customers migrating to RAC or migrating to raw devices. Uniform extents, locally managed Ÿ No more fragmentation! Migration script can be used to migrate a schema at a time.
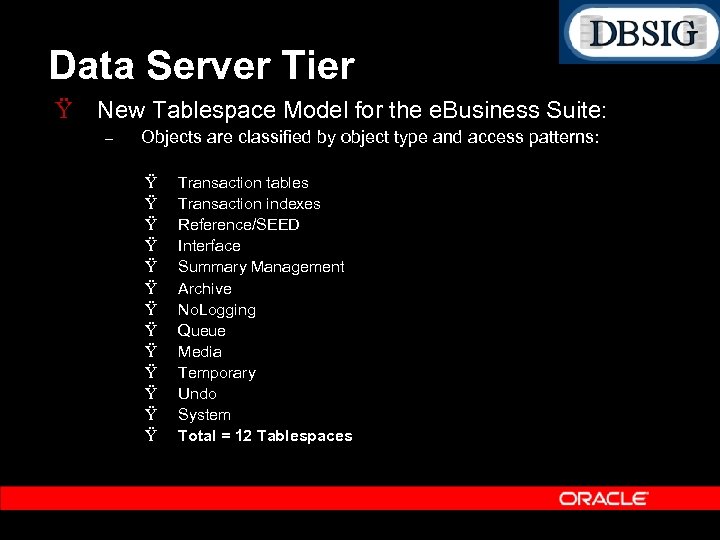
Data Server Tier Ÿ New Tablespace Model for the e. Business Suite: – Objects are classified by object type and access patterns: Ÿ Ÿ Ÿ Ÿ Transaction tables Transaction indexes Reference/SEED Interface Summary Management Archive No. Logging Queue Media Temporary Undo System Total = 12 Tablespaces
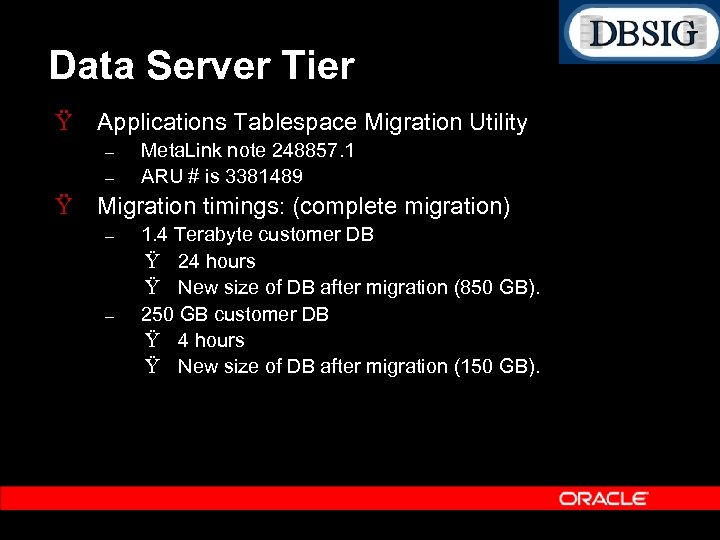
Data Server Tier Ÿ Applications Tablespace Migration Utility – – Meta. Link note 248857. 1 ARU # is 3381489 Ÿ Migration timings: (complete migration) – – 1. 4 Terabyte customer DB Ÿ 24 hours Ÿ New size of DB after migration (850 GB). 250 GB customer DB Ÿ 4 hours Ÿ New size of DB after migration (150 GB).
Application Tuning Ÿ Review the Meta. Link note “Recommended Performance Patches for the Oracle E Business Suite”, 244040. 1. – Recommended performance patches for all the modules and tech. stack components are consolidated in this note.
Application Tuning Ÿ Workflow – – When starting background engines via Concurrent Manager, set the Process Stuck parameter to No. Start a separate background engine to handle stuck processes with a very low frequency such as once or twice a day. Use deferred activities to improve online response times and facilitate asynchronous processing for flows such as Scheduling, PO Document Approval, etc. . Establish a regular frequency for purging Workflow runtime data (FNDWFPR Purge Obsolete Workflow Runtime Data).
Application Tuning Ÿ Order Management – – – OM Pack J contains numerous performance fixes including Pricing performance fixes. Ensure that debugging is disabled: Ÿ OM: Debug Level, set to 0 for OFF Ÿ QP: Debug Mode, set to Request Viewer Off Ÿ WSH: Debug Enabled, set to No Ÿ WSH: Debug Level, set to 0 for OFF Use the streamlined workflows. Ÿ Removes unnecessary activities and sub processes. Ÿ Improves performance and amount of WF data significantly. Ÿ New streamlined flow in 11. 5. 10 Line Flow – Generic: Performance Ÿ Refer to Meta. Link note 130511. 1
Application Tuning Ÿ Order Management – – – For online order entry, use the new Quick Sales Order Form Ÿ Provides a checkbox “deferred pricing” which can be used to defer price calculation until the order is saved. Ÿ Also improves overall speed of order entry from a functional / navigational perspective. Enable Auto. Scheduling Use deferred activities Ÿ Tax Calculation Ÿ Credit Check
Application Tuning Ÿ Payroll – Tune the number of threads, chunk size and the buffer sizes (pay_action_parameters): Ÿ Ÿ Ÿ – – THREADS=25 CHUNK_SIZE = 20 BAL BUFFER SIZE=550 EE BUFFER SIZE =550 RR BUFFER SIZE =550 COST BUFFER SIZE=550 Set threads to 1. 5 2. 0 times the number of data server processors. Set LOW_VOLUME=N to enable optimal plans.
Application Tuning Ÿ OA Framework Applications – – Refer to Meta. Link note 123456. 1 (Recommended Patches for Applications) and Meta. Link note 275880. 1 (Framework Roadmap). If running FWK 5. 7, ensure that you are running the latest rollup patch for 5. 7 H. Ÿ Refer to Meta. Link note 258333. 1. – Upgrade to the latest 9 i. R 2 JDBC Drivers (Meta. Link note 164317. 1) – Pool Monitor can be used to monitor the resource utilization Ÿ Application Module Pool Ÿ Memory Utilization Ÿ JVM Properties Ÿ Pre 11 i 10: https: //<hostname>/servlet/OAApp. Mod. Pool. Monitor Ÿ 11 i 10: Login >Diagnostics >Show Pool Monitor.
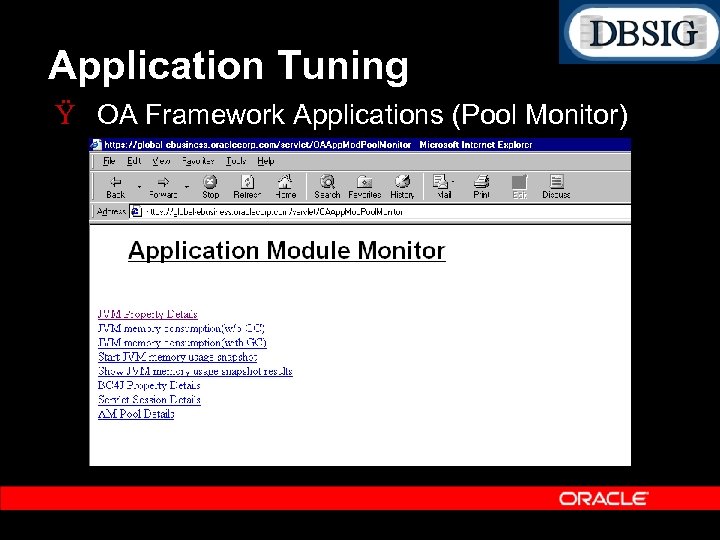
Application Tuning Ÿ OA Framework Applications (Pool Monitor)
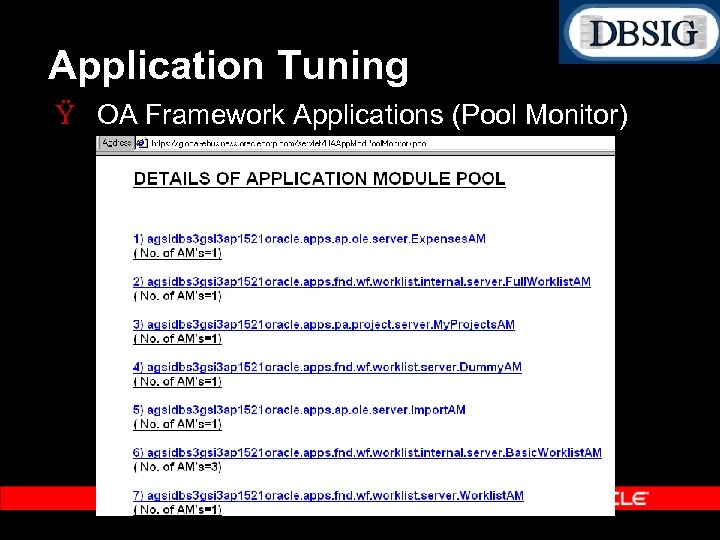
Application Tuning Ÿ OA Framework Applications (Pool Monitor)
Application Tuning (OA) Ÿ Tracing Framework Applications – – – – Set profile FND : Diagnostics to Yes at user level Login to Self Service as the above user Click on Diagnostics icon at the top of page Select ‘Set Trace Level’ and click Go Select the desired trace level and click Save Perform the activity that you want to trace Exit application
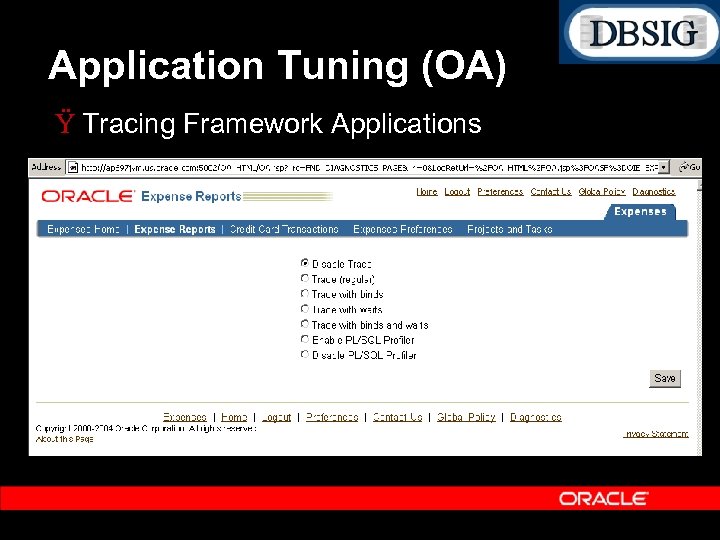
Application Tuning (OA) Ÿ Tracing Framework Applications
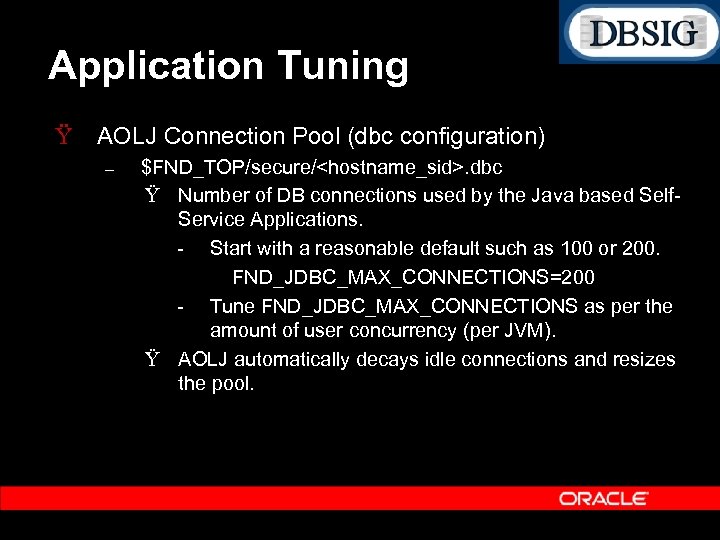
Application Tuning Ÿ AOLJ Connection Pool (dbc configuration) – $FND_TOP/secure/<hostname_sid>. dbc Ÿ Number of DB connections used by the Java based Self Service Applications. Start with a reasonable default such as 100 or 200. FND_JDBC_MAX_CONNECTIONS=200 Tune FND_JDBC_MAX_CONNECTIONS as per the amount of user concurrency (per JVM). Ÿ AOLJ automatically decays idle connections and resizes the pool.
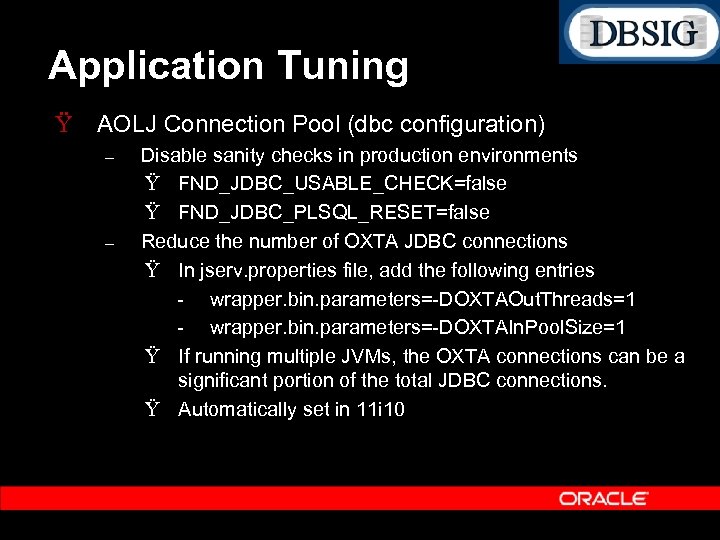
Application Tuning Ÿ AOLJ Connection Pool (dbc configuration) – – Disable sanity checks in production environments Ÿ FND_JDBC_USABLE_CHECK=false Ÿ FND_JDBC_PLSQL_RESET=false Reduce the number of OXTA JDBC connections Ÿ In jserv. properties file, add the following entries wrapper. bin. parameters= DOXTAOut. Threads=1 wrapper. bin. parameters= DOXTAIn. Pool. Size=1 Ÿ If running multiple JVMs, the OXTA connections can be a significant portion of the total JDBC connections. Ÿ Automatically set in 11 i 10
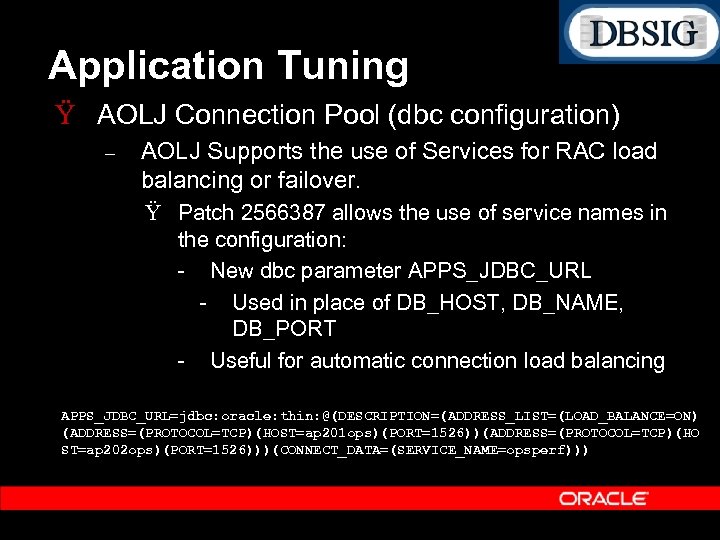
Application Tuning Ÿ AOLJ Connection Pool (dbc configuration) – AOLJ Supports the use of Services for RAC load balancing or failover. Ÿ Patch 2566387 allows the use of service names in the configuration: New dbc parameter APPS_JDBC_URL Used in place of DB_HOST, DB_NAME, DB_PORT Useful for automatic connection load balancing APPS_JDBC_URL=jdbc: oracle: thin: @(DESCRIPTION=(ADDRESS_LIST=(LOAD_BALANCE=ON) (ADDRESS=(PROTOCOL=TCP)(HOST=ap 201 ops)(PORT=1526))(ADDRESS=(PROTOCOL=TCP)(HO ST=ap 202 ops)(PORT=1526)))(CONNECT_DATA=(SERVICE_NAME=opsperf)))
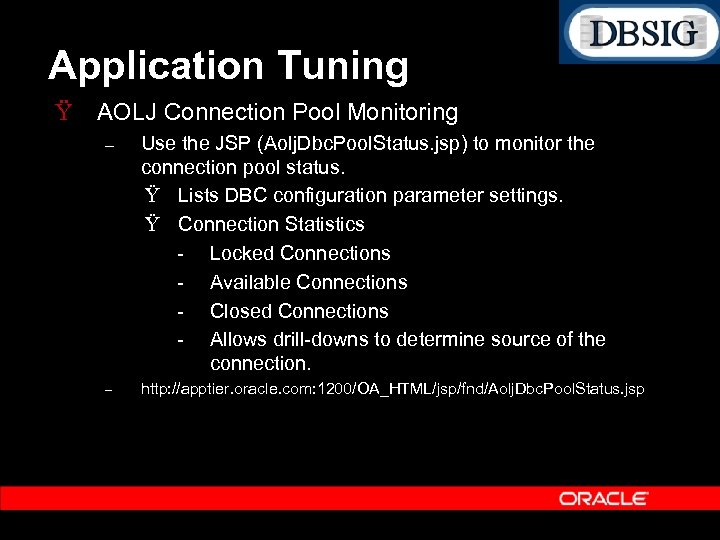
Application Tuning Ÿ AOLJ Connection Pool Monitoring – Use the JSP (Aolj. Dbc. Pool. Status. jsp) to monitor the connection pool status. Ÿ Lists DBC configuration parameter settings. Ÿ Connection Statistics Locked Connections Available Connections Closed Connections Allows drill downs to determine source of the connection. – http: //apptier. oracle. com: 1200/OA_HTML/jsp/fnd/Aolj. Dbc. Pool. Status. jsp
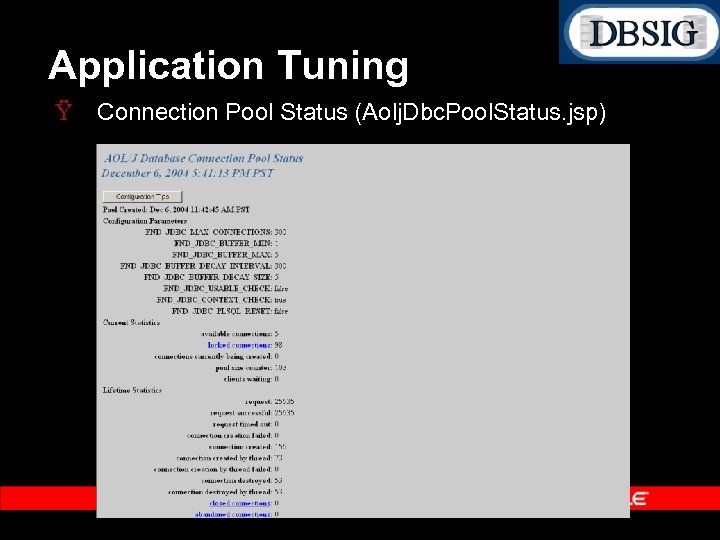
Application Tuning Ÿ Connection Pool Status (Aolj. Dbc. Pool. Status. jsp)
Application Tuning Ÿ Purging – – Implement a regular purge process including transient data as well as obsolete transactional data. Archive system related entities prior to purge such as Ÿ FND_CONCURRENT_REQUESTS Ÿ ICX_SESSIONS – Purge old data before performing upgrades.
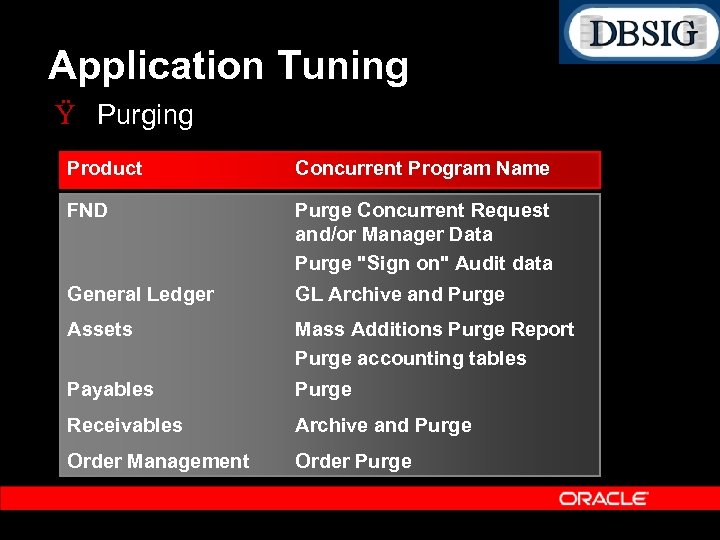
Application Tuning Ÿ Purging Product Concurrent Program Name FND Purge Concurrent Request and/or Manager Data Purge "Sign on" Audit data General Ledger GL Archive and Purge Assets Mass Additions Purge Report Purge accounting tables Payables Purge Receivables Archive and Purge Order Management Order Purge
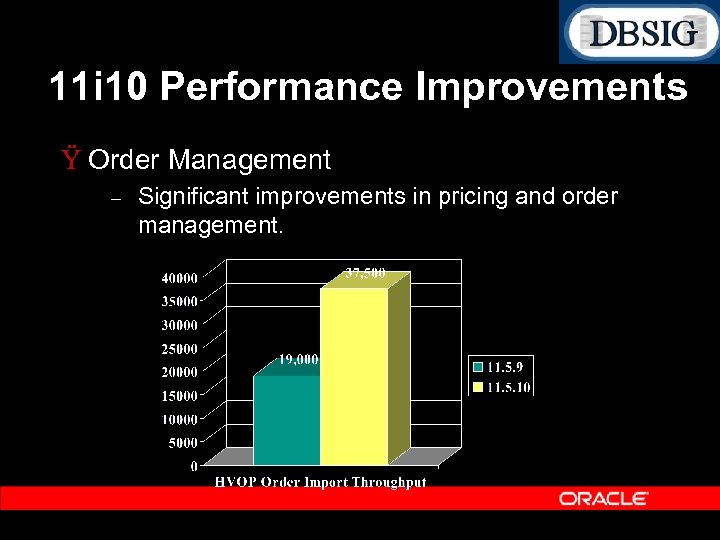
11 i 10 Performance Improvements Ÿ Order Management – Significant improvements in pricing and order management.
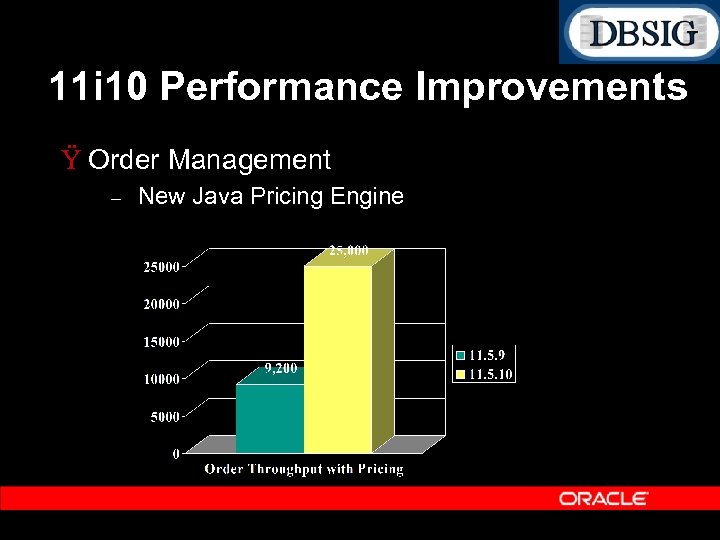
11 i 10 Performance Improvements Ÿ Order Management – New Java Pricing Engine
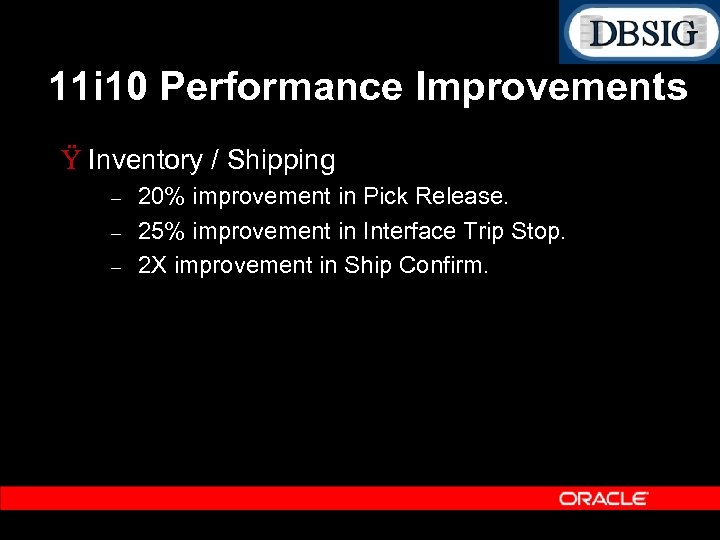
11 i 10 Performance Improvements Ÿ Inventory / Shipping – – – 20% improvement in Pick Release. 25% improvement in Interface Trip Stop. 2 X improvement in Ship Confirm.
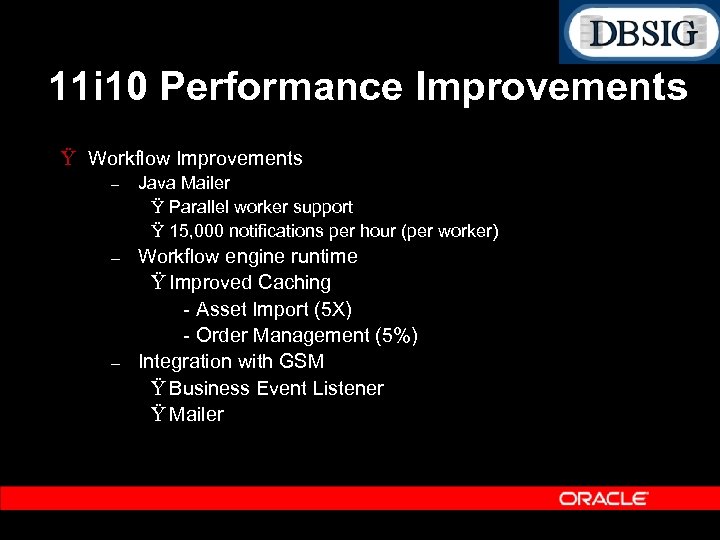
11 i 10 Performance Improvements Ÿ Workflow Improvements – Java Mailer Ÿ Parallel worker support Ÿ 15, 000 notifications per hour (per worker) – Workflow engine runtime Ÿ Improved Caching Asset Import (5 X) Order Management (5%) Integration with GSM Ÿ Business Event Listener Ÿ Mailer –
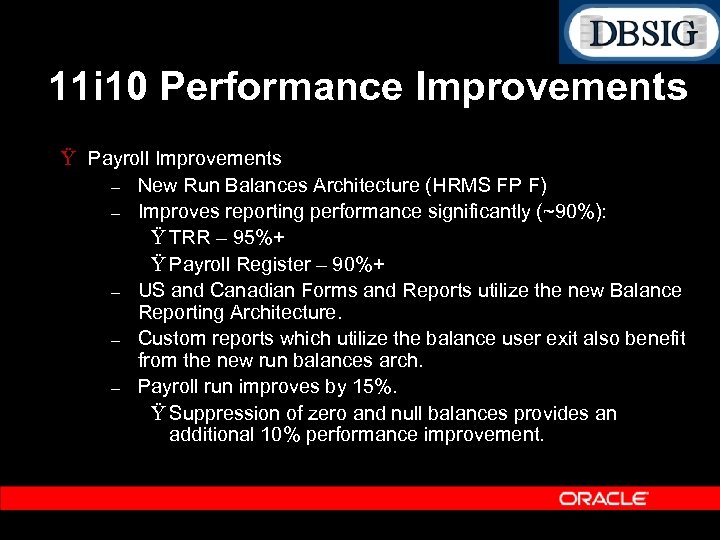
11 i 10 Performance Improvements Ÿ Payroll Improvements – New Run Balances Architecture (HRMS FP F) – Improves reporting performance significantly (~90%): Ÿ TRR – 95%+ Ÿ Payroll Register – 90%+ – US and Canadian Forms and Reports utilize the new Balance Reporting Architecture. – Custom reports which utilize the balance user exit also benefit from the new run balances arch. – Payroll run improves by 15%. Ÿ Suppression of zero and null balances provides an additional 10% performance improvement.
11 i 10 Performance Improvements Ÿ TCA Customer Import – Completely rewritten. – Requires 9 i. R 2 (or higher). – Scales well with parallel workers. – 300 K customers per hour per worker – 1 million customers imported in one hour using 4 workers.
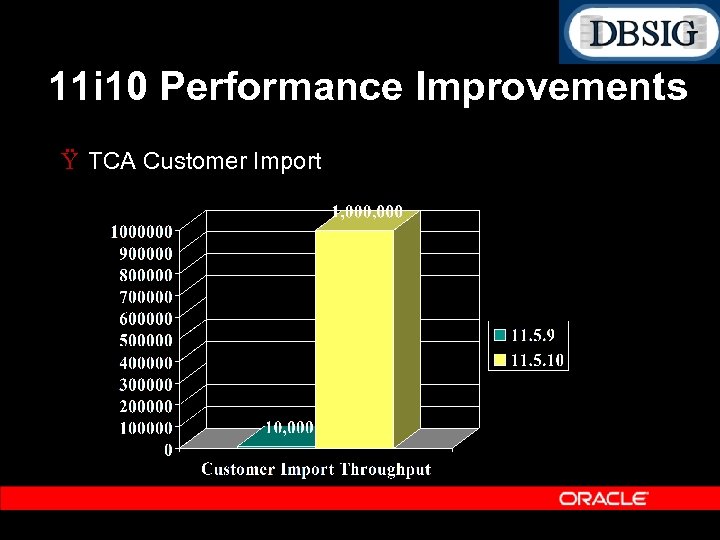
11 i 10 Performance Improvements Ÿ TCA Customer Import
11 i 10 Performance Improvements Ÿ 11 i 10 Tracing Improvements – – – Ability to enable all levels of SQL trace as well as PL/SQL profiler from Forms, Framework based pages, and Concurrent Programs. Help >About Oracle Applications shows performance information including time spent in the Form and time spent in the DB. For concurrent programs, tracing can be enabled at the program definition level and at the request level. Trace file identifier is automatically set to the Applications user name Ÿ prod 11 i_ora_2738_BASMITH. trc New Report (PL/SQL Profiler) Ÿ Generates an HTML report of the PL/SQL profiler data.
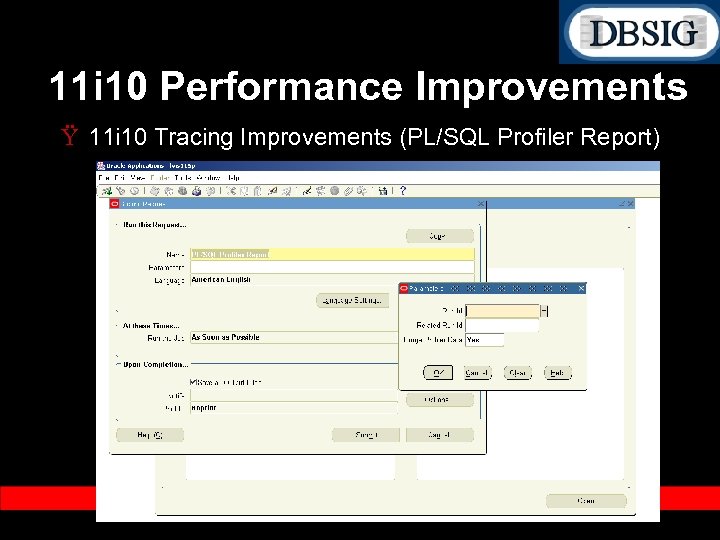
11 i 10 Performance Improvements Ÿ 11 i 10 Tracing Improvements (PL/SQL Profiler Report)
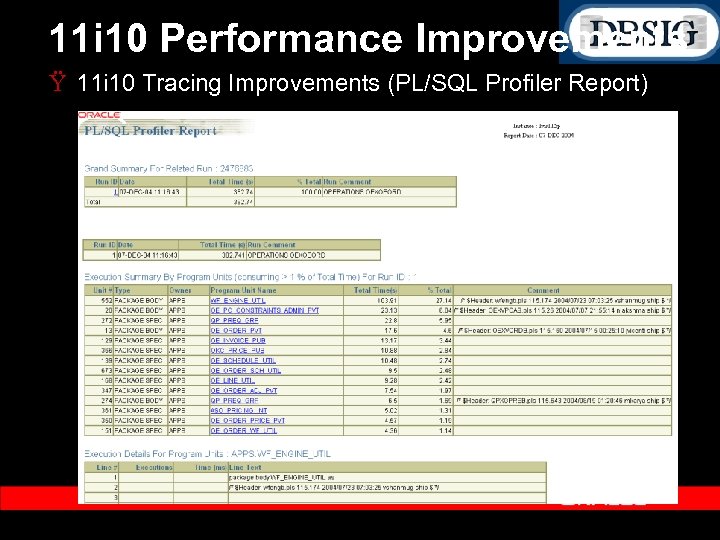
11 i 10 Performance Improvements Ÿ 11 i 10 Tracing Improvements (PL/SQL Profiler Report)
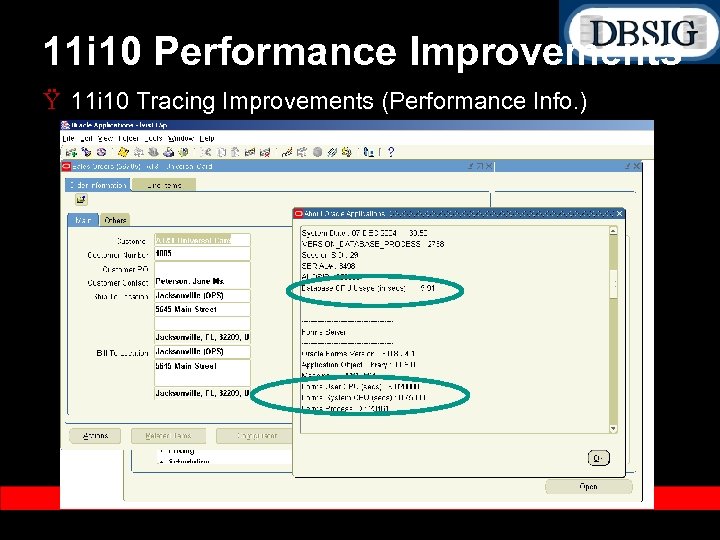
11 i 10 Performance Improvements Ÿ 11 i 10 Tracing Improvements (Performance Info. )
11 i 10 Performance Improvements Ÿ FND_STATS Improvements: – – No invalidate option can be used to avoid invalidating cursors while gathering statistics. Auto Gather has been added to allow statistics to be gathered only on those objects which have changed. Ÿ Change threshold is configurable. Ÿ Default is 10%. Ÿ Significantly reduces the time to gather statistics. Ÿ Improves manageability as FND_STATS automatically determines changed object list. Maintain history of all gather stats requests. Automatically determines degree of parallelism.
11 i 10 Performance Improvements Ÿ Configuration Enhancements – Reviewed and optimized default settings for the entire stack via Auto. Config templates including: Ÿ Forms Ÿ JDK Ÿ DB Ÿ Concurrent Manager Ÿ Discoverer Ÿ AOLJ DBC – Customer Sequence Cache settings are preserved across patches/upgrades if current setting exceeds standard default. Auto. Config support for complex configurations including RAC, Load Balancing, Firewalls, etc. . –
11 i 10 Performance Improvements Ÿ Significant reduction in patching downtime – – – Parallelized large table updates. FNDLOAD Improvements Ÿ 15% for small LDTs Ÿ Orders of magnitude for large LDTs. Improvements to distributed AD. Large indexes are now created in parallel. APPS_MRC schema has been eliminated. Optimized PL/SQL recompilation order for invalid objects.
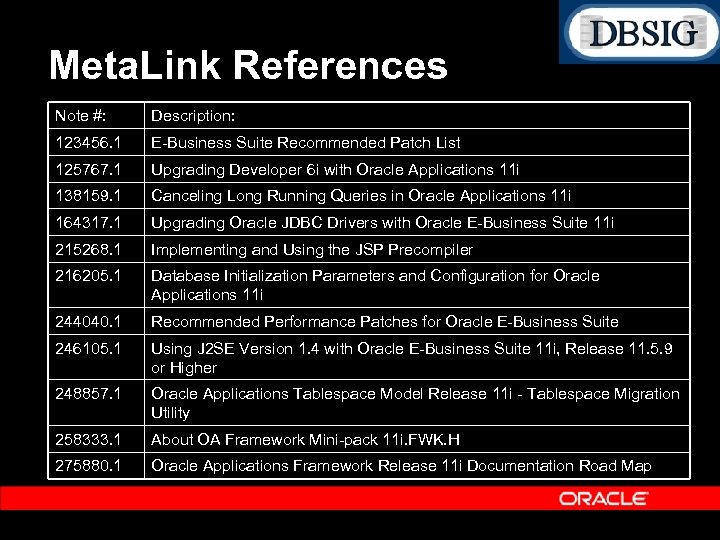
Meta. Link References Note #: Description: 123456. 1 E Business Suite Recommended Patch List 125767. 1 Upgrading Developer 6 i with Oracle Applications 11 i 138159. 1 Canceling Long Running Queries in Oracle Applications 11 i 164317. 1 Upgrading Oracle JDBC Drivers with Oracle E Business Suite 11 i 215268. 1 Implementing and Using the JSP Precompiler 216205. 1 Database Initialization Parameters and Configuration for Oracle Applications 11 i 244040. 1 Recommended Performance Patches for Oracle E Business Suite 246105. 1 Using J 2 SE Version 1. 4 with Oracle E Business Suite 11 i, Release 11. 5. 9 or Higher 248857. 1 Oracle Applications Tablespace Model Release 11 i Tablespace Migration Utility 258333. 1 About OA Framework Mini pack 11 i. FWK. H 275880. 1 Oracle Applications Framework Release 11 i Documentation Road Map

Q & A QUESTIONS ANSWERS
0fad6535adc1b302e0f9324d8eadf577.ppt