0d141e272bbed637e353a18cda4d634e.ppt
- Количество слайдов: 146

Mass Spectrometry: Methods & Theory Leonardus B. S. Kardono Member of National Research Council, Ministry of Research of Science and Technology. Member of Research Professor Council, Indonesian Institute of Sciences.

Proteomics Tools • Molecular Biology Tools • Separation & Display Tools • Protein Identification Tools • Protein Structure Tools

Mass Spectrometry Needs • Ionization-how the protein is injected in to the MS machine • Separation-Mass and Charge is determined • Activation-protein are broken into smaller fragments (peptides/AAs) • Mass Determination-m/z ratios are determined for the ionized protein fragments/peptides

Protein Identification • 2 D-GE + MALDI-MS – Peptide Mass Fingerprinting (PMF) • 2 D-GE + MS-MS – MS Peptide Sequencing/Fragment Ion Searching • Multidimensional LC + MS-MS – ICAT Methods (isotope labelling) – Mud. PIT (Multidimensional Protein Ident. Tech. ) • 1 D-GE + LC + MS-MS • De Novo Peptide Sequencing

Mass Spectrometry (MS) • Introduce sample to the instrument • Generate ions in the gas phase • Separate ions on the basis of differences in m/z with a mass analyzer • Detect ions

How does a mass spectrometer work? Create ions • Ionization method – MALDI – Electrospray (Proteins must be charged and dry) Separate ions • Mass analyzer – MALDI-TOF • MW – Triple Quadrapole • AA seq – MALDI-Qq. TOF • AA seq and MW – Qq. TOF • AA seq and protein modif. Detect ions • Mass spectrum • Database analysis

Generalized Protein Identification by MS Library Spot removed from gel Artificial spectra built Fragmented using trypsin Spectrum of fragments generated MATC H Artificially trypsinated Database of sequences (i. e. Swiss. Prot)

Methods for protein identification

MS Principles • Different elements can be uniquely identified by their mass

MS Principles • Different compounds can be uniquely identified by their mass Butorphanol L-dopa N -CH 2 OH Ethanol COOH HO -CH 2 CH-NH 2 CH 3 CH 2 OH HO HO MW = 327. 1 MW = 197. 2 MW = 46. 1

Mass Spectrometry • Analytical method to measure the molecular or atomic weight of samples

Weighing proteins A mass spectrometer creates charged particles (ions) from molecules. Common way is to add or take away an ions: Na. Cl + e- Na. Cl+ + e. It then analyzes those ions to provide information about the molecular weight of the compound and its chemical structure.

Mass Spectrometry • For small organic molecules the MW can be determined to within 5 ppm or 0. 0005% which is sufficiently accurate to confirm the molecular formula from mass alone • For large biomolecules the MW can be determined within an accuracy of 0. 01% (i. e. within 5 Da for a 50 k. D protein) • Recall 1 dalton = 1 atomic mass unit (1 amu)

MS History • JJ Thomson built MS prototype to measure m/z of electron, awarded Nobel Prize in 1906 • MS concept first put into practice by Francis Aston, a physicist working in Cambridge England in 1919 • Designed to measure mass of elements • Aston Awarded Nobel Prize in 1922

MS History • 1948 -52 - Time of Flight (TOF) mass analyzers introduced • 1955 - Quadrupole ion filters introduced by W. Paul, also invents the ion trap in 1983 (wins 1989 Nobel Prize) • 1968 - Tandem mass spectrometer appears • Mass spectrometers are now one of the MOST POWERFUL ANALYTIC TOOLS IN CHEMISTRY

MS Principles • Find a way to “charge” an atom or molecule (ionization) • Place charged atom or molecule in a magnetic field or subject it to an electric field and measure its speed or radius of curvature relative to its mass-to-charge ratio (mass analyzer) • Detect ions using microchannel plate or photomultiplier tube

Mass Spec Principles Sample + _ Ionizer Mass Analyzer Detector

How does a mass spectrometer work? Create ions Separate ions • Ionization method • Mass analyzer – MALDI – Electrospray (Proteins must be charged and dry) – – Detect ions • Mass MALDI-TOF spectrum • MW Triple Quadrapole • Database analysis • AA seq – MALDI-Qq. TOF • AA seq and MW – Qq. TOF • AA seq and protein modif.

Mass spectrometers • Time of flight (TOF) (MALDI) – Measures the time required for ions to fly down the length of a chamber. – Often combined with MALDI (MALDI-TOF) Detections from multiple laser bursts are averaged. Multiple laser • Tandem MS- MS/MS -separation and identification of compounds in complex mixtures - induce fragmentation and mass analyze the fragment ions. - Uses two or more mass analyzers/filters separated by a collision cell filled with Argon or Xenon • Different MS-MS configurations – – Quadrupole-quadrupole (low energy) Magnetic sector-quadrupole (high) Quadrupole-time-of-flight (low energy) Time-of-flight-time-of-flight (low energy)

Typical Mass Spectrometer

LC/LC-MS/MS-Tandem LC, Tandem MS

Typical Mass Spectrum • Characterized by sharp, narrow peaks • X-axis position indicates the m/z ratio of a given ion (for singly charged ions this corresponds to the mass of the ion) • Height of peak indicates the relative abundance of a given ion (not reliable for quantitation) • Peak intensity indicates the ion’s ability to desorb or “fly” (some fly better than others)

All proteins are sorted based on a mass to charge ratio (m/z) m/z ratio: Molecular weight divided by the charge on this protein

Typical Mass Spectrum Relative Abundance aspirin 120 m/z-for singly charged ion this is the mass

Resolution & Resolving Power • Width of peak indicates the resolution of the MS instrument • The better the resolution or resolving power, the better the instrument and the better the mass accuracy • Resolving power is defined as: DM M M is the mass number of the observed mass (DM) is the difference between two masses that can be separated

Resolution in MS

Resolution in MS 783. 455 QTOF 784. 465 785. 475 783. 6

Mass Spectrometer Schematic Turbo pumps Diffusion pumps Rough pumps Rotary pumps High Vacuum System Inlet Sample Plate Target HPLC GC Solids probe Ion Source Mass Filter MALDI ESI Ion. Spray FAB LSIMS EI/CI TOF Quadrupole Ion Trap Mag. Sector FTMS Detector Microch plate Electron Mult. Hybrid Detec. Data System PC’s UNIX Mac

Different Ionization Methods • Electron Impact (EI - Hard method) – small molecules, 1 -1000 Daltons, structure • Fast Atom Bombardment (FAB – Semi-hard) – peptides, sugars, up to 6000 Daltons • Electrospray Ionization (ESI - Soft) – peptides, proteins, up to 200, 000 Daltons • Matrix Assisted Laser Desorption (MALDI-Soft) – peptides, proteins, DNA, up to 500 k. D

Electron Impact Ionization • Sample introduced into instrument by heating it until it evaporates • Gas phase sample is bombarded with electrons coming from rhenium or tungsten filament (energy = 70 e. V) • Molecule is “shattered” into fragments (70 e. V >> 5 e. V bonds) • Fragments sent to mass analyzer


EI Fragmentation of CH 3 OH+ CH 3 OH CH 2 O=H+ CH 3 OH + CH 2 O=H+ + H CH 3 + OH CHO=H+ + H Why wouldn’t Electron Impact be suitable for analyzing proteins?

Why You Can’t Use EI For Analyzing Proteins • EI shatters chemical bonds • Any given protein contains 20 different amino acids • EI would shatter the protein into not only into amino acids but also amino acid subfragments and even peptides of 2, 3, 4… amino acids • Result is 10, 000’s of different signals from a single protein -- too complex to analyze

Soft Ionization Methods 337 nm UV laser Fluid (no salt) + _ cyano-hydroxy cinnamic acid Gold tip needle MALDI ESI

Soft Ionization • Soft ionization techniques keep the molecule of interest fully intact • Electro-spray ionization first conceived in 1960’s by Malcolm Dole but put into practice in 1980’s by John Fenn (Yale) • MALDI first introduced in 1985 by Franz Hillenkamp and Michael Karas (Frankfurt) • Made it possible to analyze large molecules via inexpensive mass analyzers such as quadrupole, ion trap and TOF


Ionization methods • Electrospray mass spectrometry (ESI-MS) – Liquid containing analyte is forced through a steel capillary at high voltage to electrostatically disperse analyte. Charge imparted from rapidly evaporating liquid. • Matrix-assisted laser desorption ionization (MALDI) – Analyte (protein) is mixed with large excess of matrix (small organic molecule) – Irradiated with short pulse of laser light. Wavelength of laser is the same as absorbance max of matrix.

Electrospray Ionization • Sample dissolved in polar, volatile buffer (no salts) and pumped through a stainless steel capillary (70 - 150 m) at a rate of 10100 L/min • Strong voltage (3 -4 k. V) applied at tip along with flow of nebulizing gas causes the sample to “nebulize” or aerosolize • Aerosol is directed through regions of higher vacuum until droplets evaporate to near atomic size (still carrying charges)

Electrospray (Detail)

Electrospray Ionization • Can be modified to “nanospray” system with flow < 1 L/min • Very sensitive technique, requires less than a picomole of material • Strongly affected by salts & detergents • Positive ion mode measures (M + H)+ (add formic acid to solvent) • Negative ion mode measures (M - H)- (add ammonia to solvent)

Positive or Negative Ion Mode? • If the sample has functional groups that readily accept H+ (such as amide and amino groups found in peptides and proteins) then positive ion detection is used-PROTEINS • If a sample has functional groups that readily lose a proton (such as carboxylic acids and hydroxyls as found in nucleic acids and sugars) then negative ion detection is used-DNA

Matrix-Assisted Laser Desorption Ionization 337 nm UV laser cyano-hydroxy cinnamic acid MALDI

MALDI • Sample is ionized by bombarding sample with laser light • Sample is mixed with a UV absorbant matrix (sinapinic acid for proteins, 4 hydroxycinnaminic acid for peptides) • Light wavelength matches that of absorbance maximum of matrix so that the matrix transfers some of its energy to the analyte (leads to ion sputtering)

HT Spotting on a MALDI Plate

MALDI Ionization Matrix + + +-+ Laser Analyte + + + -+ -++ + + • Absorption of UV radiation by chromophoric matrix and ionization of matrix • Dissociation of matrix, phase change to supercompressed gas, charge transfer to analyte molecule • Expansion of matrix at supersonic velocity, analyte trapped in expanding matrix plume (explosion/”popping”)

MALDI • Unlike ESI, MALDI generates spectra that have just a singly charged ion • Positive mode generates ions of M + H • Negative mode generates ions of M - H • Generally more robust that ESI (tolerates salts and nonvolatile components) • Easier to use and maintain, capable of higher throughput

Principal for MALDI-TOF MASS

Principal for MALDI-TOF MASS

MALDI = SELDI 337 nm UV laser cyano-hydroxy cinnaminic acid MALDI

MALDI/SELDI Spectra Normal Tumor

Mass Spectrometer Schematic Turbo pumps Diffusion pumps Rough pumps Rotary pumps High Vacuum System Inlet Sample Plate Target HPLC GC Solids probe Ion Source Mass Filter MALDI ESI Ion. Spray FAB LSIMS EI/CI TOF Quadrupole Ion Trap Mag. Sector FTMS Detector Microch plate Electron Mult. Hybrid Detec. Data System PC’s UNIX Mac

Different Mass Analyzers • Magnetic Sector Analyzer (MSA) – High resolution, exact mass, original MA • Quadrupole Analyzer (Q) – Low (1 amu) resolution, fast, cheap • Time-of-Flight Analyzer (TOF) – No upper m/z limit, high throughput • Ion Trap Mass Analyzer (QSTAR) – Good resolution, all-in-one mass analyzer • Ion Cyclotron Resonance (FT-ICR) – Highest resolution, exact mass, costly

Different Types of MS • ESI-QTOF – Electrospray ionization source + quadrupole mass filter + time-of-flight mass analyzer • MALDI-QTOF – Matrix-assisted laser desorption ionization + quadrupole + time-of-flight mass analyzer Both separate by MW and AA seq

Different Types of MS • GC-MS - Gas Chromatography MS – separates volatile compounds in gas column and ID’s by mass • LC-MS - Liquid Chromatography MS – separates delicate compounds in HPLC column and ID’s by mass • MS-MS - Tandem Mass Spectrometry – separates compound fragments by magnetic field and ID’s by mass • LC/LC-MS/MS-Tandem LC and Tandem MS – Separates by HPLC, ID’s by mass and AA sequence

Magnetic Sector Analyzer

Quadrupole Mass Analyzer • A quadrupole mass filter consists of four parallel metal rods with different charges • Two opposite rods have an applied + potential and the other two rods have a potential • The applied voltages affect the trajectory of ions traveling down the flight path • For given dc and ac voltages, only ions of a certain mass-to-charge ratio pass through the quadrupole filter and all other ions are thrown out of their original path

Quadrupole Mass Analyzer

Q-TOF Mass Analyzer NANOSPRAY TIP MCP DETECTOR PUSHER HEXAPOLE QUADRUPOLE ION SOURCE HEXAPOLE COLLISION CELL TOF REFLECTRON SKIMMER HEXAPOLE

Mass Spec Equation (TOF) 2 Vt 2 m = z L 2 m = mass of ion z = charge of ion V = voltage L = drift tube length t = time of travel

Ion Trap Mass Analyzer • Ion traps are ion trapping devices that make use of a three-dimensional quadrupole field to trap and mass-analyze ions • invented by Wolfgang Paul (Nobel Prize 1989) • Offer good mass resolving power

FT-ICR Fourier-transform ion cyclotron resonance • Uses powerful magnet (5 -10 Tesla) to create a miniature cyclotron • Originally developed in Canada (UBC) by A. G. Marshal in 1974 • FT approach allows many ion masses to be determined simultaneously (efficient) • Has higher mass resolution than any other MS analyzer available

FT-Ion Cyclotron Analzyer

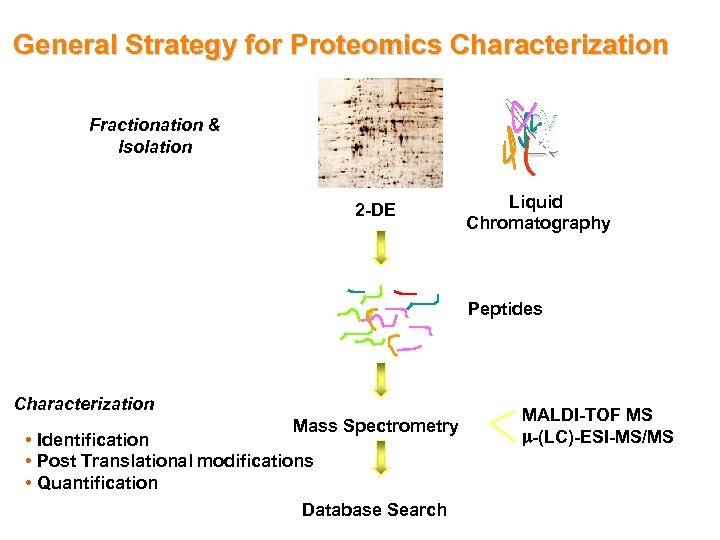
Current Mass Spec Technologies • Proteome profiling/separation – 2 D SDS PAGE - identify proteins – 2 -D LC/LC - high throughput analysis of lysates (LC = Liquid Chromatography) – 2 -D LC/MS (MS= Mass spectrometry) • Protein identification – Peptide mass fingerprint – Tandem Mass Spectrometry (MS/MS) • Quantative proteomics – ICAT (isotope-coded affinity tag) – ITRAQ

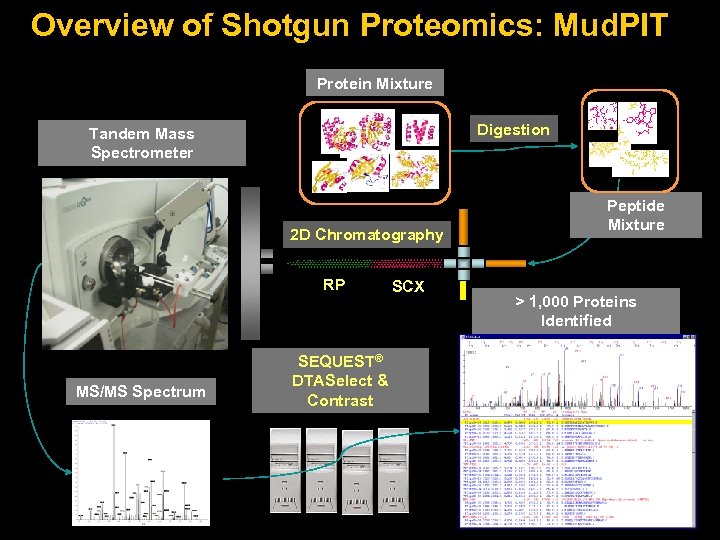
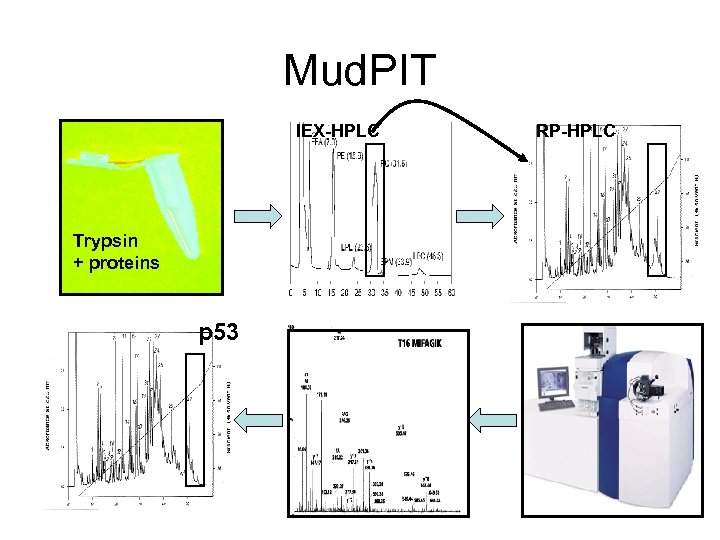
2 D - LC/LC (trypsin) Study protein complexes without gel electrophoresis Complex mixture is simplified prior to MS/MS by 2 D LC Peptides all bind to cation exchange column Successive elution with increasing salt gradients separates peptides by charge Peptides are separated by hydrophobicity on reverse phase column

2 D - LC/MS

Peptide Mass Fingerprinting (PMF)

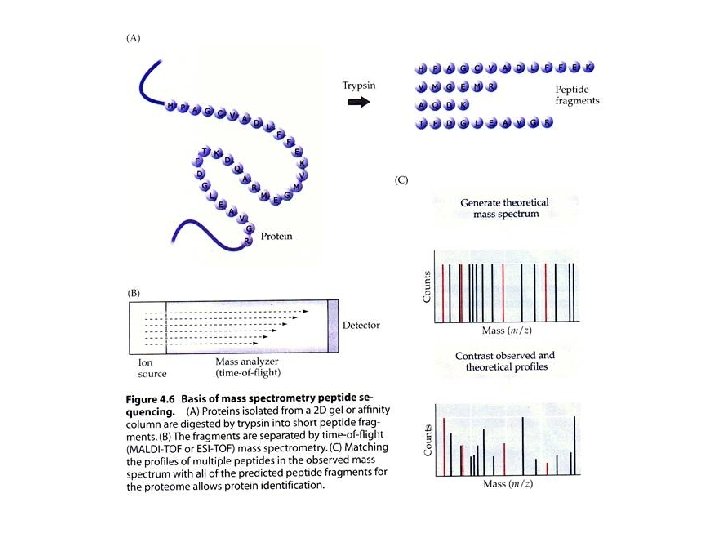
Peptide Mass Fingerprinting • Used to identify protein spots on gels or protein peaks from an HPLC run • Depends of the fact that if a peptide is cut up or fragmented in a known way, the resulting fragments (and resulting masses) are unique enough to identify the protein • Requires a database of known sequences • Uses software to compare observed masses with masses calculated from database

Principles of Fingerprinting Sequence >Protein 1 acedfhsakdfqea sdfpkivtmeeewe ndadnfekqwfe >Protein 2 acekdfhsadfqea sdfpkivtmeeewe nkdadnfeqwfe >Protein 3 acedfhsadfqeka sdfpkivtmeeewe ndakdnfeqwfe Mass (M+H) Tryptic Fragments 4842. 05 acedfhsak dfgeasdfpk ivtmeeewendadnfek gwfe 4842. 05 acek dfhsadfgeasdfpk ivtmeeewenk dadnfeqwfe 4842. 05 acedfhsadfgek asdfpk ivtmeeewendak dnfegwfe

Principles of Fingerprinting Sequence Mass (M+H) >Protein 1 acedfhsakdfqea sdfpkivtmeeewe ndadnfekqwfe 4842. 05 >Protein 2 acekdfhsadfqea sdfpkivtmeeewe nkdadnfeqwfe 4842. 05 >Protein 3 acedfhsadfqeka sdfpkivtmeeewe ndakdnfeqwfe 4842. 05 Mass Spectrum

Predicting Peptide Cleavages http: //ca. expasy. org/tools/peptidecutter/

http: //ca. expasy. org/tools/peptidecutter_enzymes. html#Tryps
![Protease Cleavage Rules Sometimes inhibition occurs Trypsin XXX[KR]--[!P]XXX Chymotrypsin XX[FYW]--[!P]XXX Lys C XXXXXK-- XXXXX Protease Cleavage Rules Sometimes inhibition occurs Trypsin XXX[KR]--[!P]XXX Chymotrypsin XX[FYW]--[!P]XXX Lys C XXXXXK-- XXXXX](https://present5.com/presentation/0d141e272bbed637e353a18cda4d634e/image-72.jpg)
Protease Cleavage Rules Sometimes inhibition occurs Trypsin XXX[KR]--[!P]XXX Chymotrypsin XX[FYW]--[!P]XXX Lys C XXXXXK-- XXXXX Asp N endo XXXXXD-- XXXXX CNBr XXXXXM--XXXXX K-Lysine, R-Arginine, F-Phenylalanine, Y-Tyrosine, W-Tryptophan, D-Aspartic Acid, M-Methionine, P-Proline

Why Trypsin? • • • Robust, stable enzyme Works over a range of p. H values & Temp. Quite specific and consistent in cleavage Cuts frequently to produce “ideal” MW peptides Inexpensive, easily available/purified Does produce “autolysis” peaks (which can be used in MS calibrations) – 1045. 56, 1106. 03, 1126. 03, 1940. 94, 2211. 10, 2225. 12, 2283. 18, 2299. 18

Digest with specific protease 546 aa 60 k. Da; 57 461 Da p. I = 4. 75 >RBME 00320 Contig 0311_1089618_1091255 EC-mop. A 60 KDa chaperonin Gro. EL MAAKDVKFGR TAREKMLRGV DILADAVKVT LGPKGRNVVI EKSFGAPRIT KDGVSVAKEV ELEDKFENMG AQMLREVASK TNDTAGDGTT TATVLGQAIV QEGAKAVAAG MNPMDLKRGI DLAVNEVVAE LLKKAKKINT SEEVAQVGTI SANGEAEIGK MIAEAMQKVG NEGVITVEEA KTAETELEVV EGMQFDRGYL SPYFVTNPEK MVADLEDAYI LLHEKKLSNL QALLPVLEAV VQTSKPLLII AEDVEGEALA TLVVNKLRGG LKIAAVKAPG FGDCRKAMLE DIAILTGGQV ISEDLGIKLE SVTLDMLGRA KKVSISKENT TIVDGAGQKA EIDARVGQIK QQIEETTSDY DREKLQERLA KLAGGVAVIR VGGATEVEVK EKKDRVDDAL NATRAAVEEG IVAGGGTALL RASTKITAKG VNADQEAGIN IVRRAIQAPA RQITTNAGEE ASVIVGKILE NTSETFGYNT ANGEYGDLIS LGIVDPVKVV RTALQNAASV AGLLITTEAM IAELPKKDAA PAGMPGGMGG MGGMDF

Digest with specific protease Trypsin yields 47 peptides (theoretically) Peptide masses in Da: 501. 3 533. 3 544. 3 545. 3 614. 4 634. 3 675. 4 701. 4 726. 4 822. 4 855. 5 861. 4 879. 4 921. 5 953. 4 974. 5 988. 5 1000. 6 1196. 6 1217. 6 1228. 5 1232. 6 1233. 7 1249. 6 1344. 7 1455. 8 1484. 6 1514. 8 1582. 9 1583. 9 1616. 8 1726. 7 1759. 9 1775. 9 1790. 6 1853. 9 1869. 9 2286. 2 2302. 2 2317. 2 2419. 2 2526. 4 2542. 4 3329. 6 4211. 4 http: //us. expasy. org/tools/peptide-mass. html

Digest with trypsin In practice. . . . see far fewer by mass spec - possibly incomplete digest (we allow 1 miss) - lose peptides during each manipulation washes during digestion washes during cleanup step some peptides will not ionize well some signals (peaks) are poor low intensity; lack resolution

What Are Missed Cleavages? Sequence >Protein 1 acedfhsakdfqea sdfpkivtmeeewe ndadnfekqwfe Tryptic Fragments (no missed cleavage) acedfhsak (1007. 4251) dfgeasdfpk (1183. 5266) ivtmeeewendadnfek (2098. 8909) gwfe (609. 2667) Tryptic Fragments (1 missed cleavage) acedfhsak (1007. 4251) dfgeasdfpk (1183. 5266) ivtmeeewendadnfek 2098. 8909) gwfe (609. 2667) acedfhsakdfgeasdfpk (2171. 9338) ivtmeeewendadnfekgwfe (2689. 1398) dfgeasdfpkivtmeeewendadnfek (3263. 2997)

Calculating Peptide Masses • Sum the monoisotopic residue masses Monoisotopic Mass: the sum of the exact or accurate masses of the lightest stable isotope of the atoms in a molecule • • • Add mass of H 2 O (18. 01056) Add mass of H+ (1. 00785 to get M+H) If Met is oxidized add 15. 99491 If Cys has acrylamide adduct add 71. 0371 If Cys is iodoacetylated add 58. 0071 Other modifications are listed at – http: //prowl. rockefeller. edu/aainfo/deltamassv 2. html 1 H-1. 007828503 amu 2 H-2. 014017780 amu 12 C-12 13 C-13. 00335, 14 C-14. 00324

Masses in MS • Monoisotopic mass is the mass determined using the masses of the most abundant isotopes • Average mass is the abundance weighted mass of all isotopic components

Mass Calculation (Glycine) NH 2—COOH Amino acid R 1—NH—CH 2—CO—R 3 Residue Monoisotopic Mass 1 H = 1. 007825 12 C = 12. 00000 14 N = 14. 00307 16 O = 15. 99491 Glycine Amino Acid Mass 5 x. H + 2 x. C + 2 x. O + 1 x. N = 75. 032015 amu Glycine Residue Mass 3 x. H + 2 x. C + 1 x. O + 1 x. N =57. 021455 amu

Amino Acid Residue Masses Monoisotopic Mass Glycine Alanine Serine Proline Valine Threonine Cysteine Isoleucine Leucine Asparagine 57. 02147 71. 03712 87. 03203 97. 05277 99. 06842 101. 04768 103. 00919 113. 08407 114. 04293 Aspartic acid Glutamine Lysine Glutamic acid Methionine Histidine Phenylalanine Arginine Tyrosine Tryptophan 115. 02695 128. 05858 128. 09497 129. 0426 131. 04049 137. 05891 147. 06842 156. 10112 163. 06333 186. 07932

Amino Acid Residue Masses Average Mass Glycine Alanine Serine Proline Valine Threonine Cysteine Isoleucine Leucine Asparagine 57. 0520 71. 0788 87. 0782 97. 1167 99. 1326 101. 1051 103. 1448 113. 1595 114. 1039 Aspartic acid Glutamine Lysine Glutamic acid Methionine Histidine Phenylalanine Arginine Tyrosine Tryptophan 115. 0886 128. 1308 128. 1742 129. 1155 131. 1986 137. 1412 147. 1766 156. 1876 163. 1760 186. 2133

Preparing a Peptide Mass Fingerprint Database • Take a protein sequence database (Swiss-Prot or nr -Gen. Bank) • Determine cleavage sites and identify resulting peptides for each protein entry • Calculate the mass (M+H) for each peptide • Sort the masses from lowest to highest • Have a pointer for each calculated mass to each protein accession number in databank

Building A PMF Database Sequence DB Calc. Tryptic Frags >P 12345 acedfhsakdfqea sdfpkivtmeeewe ndadnfekqwfe acedfhsak dfgeasdfpk ivtmeeewendadnfek gwfe >P 21234 acekdfhsadfqea sdfpkivtmeeewe nkdadnfeqwfe acek dfhsadfgeasdfpk ivtmeeewenk dadnfeqwfe >P 89212 acedfhsadfqeka sdfpkivtmeeewe ndakdnfeqwfe acedfhsadfgek asdfpk ivtmeeewendak dnfegwfe Mass List 450. 2017 (P 21234) 609. 2667 (P 12345) 664. 3300 (P 89212) 1007. 4251 (P 12345) 1114. 4416 (P 89212) 1183. 5266 (P 12345) 1300. 5116 (P 21234) 1407. 6462 (P 21234) 1526. 6211 (P 89212) 1593. 7101 (P 89212) 1740. 7501 (P 21234) 2098. 8909 (P 12345)

The Fingerprint (PMF) Algorithm • Take a mass spectrum of a trypsin-cleaved protein (from gel or HPLC peak) • Identify as many masses as possible in spectrum (avoid autolysis peaks of trypsin) • Compare query masses with database masses and calculate # of matches or matching score (based on length and mass difference) • Rank hits and return top scoring entry – this is the protein of interest

Query (MALDI) Spectrum 1007 1199 2211 (trp) 609 2098 450 1940 (trp) 698 500 1000 1500 2000 2500

Query vs. Database Query Masses Database Mass List 450. 2201 609. 3667 698. 3100 1007. 5391 1199. 4916 2098. 9909 450. 2017 (P 21234) 609. 2667 (P 12345) 664. 3300 (P 89212) 1007. 4251 (P 12345) 1114. 4416 (P 89212) 1183. 5266 (P 12345) 1300. 5116 (P 21234) 1407. 6462 (P 21234) 1526. 6211 (P 89212) 1593. 7101 (P 89212) 1740. 7501 (P 21234) 2098. 8909 (P 12345) Results 2 Unknown masses 1 hit on P 21234 3 hits on P 12345 Conclude the query protein is P 12345

Database search Pept. Ident (Ex. Pasy) Mascot (Matrix Science) MS-Fit (Prospector; UCSF) Pro. Found (Proteometrics) MOWSE (HGMP) Human Genome Mapping Project Mascot theoretical Protein ID experimental


What You Need To Do PMF • A list of query masses (as many as possible) • Protease(s) used or cleavage reagents • Databases to search (SWProt, Organism) • Estimated mass and p. I of protein spot (opt) • • Cysteine (or other) modifications • Minimum number of hits for significance • Mass tolerance (100 ppm = 1000. 0 ± 0. 1 Da) • A PMF website (Prowl, Pro. Found, Mascot, etc. )

PMF on the Web • Pro. Found – http: //129. 85. 192/profound_bin/Web. Pro. Found. exe • MOWSE • http: //srs. hgmp. mrc. ac. uk/cgi-bin/mowse • Peptide. Search • http: //www. narrador. emblheidelberg. de/Group. Pages/Homepage. html • Mascot • www. matrixscience. com • Pept. Ident • http: //us. expasy. org/tools/peptident. html

Pro. Found

Pro. Found Results

MOWSE

Pept. Ident

MASCOT

Mascot Scoring • The statistics of peptide fragment matching in MS (or PMF) is very similar to the statistics used in BLAST • The scoring probability follows an extreme value distribution • High scoring segment pairs (in BLAST) are analogous to high scoring mass matches in Mascot • Mascot scoring is much more robust than arbitrary match cutoffs (like % ID)

Extreme Value Distribution it is the limit distribution of the maxima of a sequence of independent and identically distributed random variables. Because of this, the EVD is used as an approximation to model the maxima of long (finite) sequences of random variables. P(x) = 1 - e -x -e Scores greater than 72 are significant

MASCOT

Mascot/Mowse Scoring • The Mascot Score is given as S = -10*Log(P), where P is the probability that the observed match is a random event • Try to aim for probabilities where P<0. 05 (less than a 5% chance the peptide mass match is random) • Mascot scores greater than 72 are significant (p<0. 05).

Advantages of PMF • Uses a “robust” & inexpensive form of MS (MALDI) • Doesn’t require too much sample optimization • Can be done by a moderately skilled operator (don’t need to be an MS expert) • Widely supported by web servers • Improves as DB’s get larger & instrumentation gets better • Very amenable to high throughput robotics (up to 500 samples a day)

Limitations With PMF • Requires that the protein of interest already be in a sequence database • Spurious or missing critical mass peaks always lead to problems • Mass resolution/accuracy is critical, best to have <20 ppm mass resolution • Generally found to only be about 40% effective in positively identifying gel spots

Tandem Mass Spectrometry • Purpose is to fragment ions from parent ion to provide structural information about a molecule • Also allows mass separation and AA identification of compounds in complex mixtures • Uses two or more mass analyzers/filters separated by a collision cell filled with Argon or Xenon • Collision cell is where selected ions are

MS-MS & Proteomics

Tandem Mass Spectrometry • Different MS-MS configurations – Quadrupole-quadrupole (low energy) – Magnetic sector-quadrupole (high) – Quadrupole-time-of-flight (low energy) – Time-of-flight-time-of-flight (low energy)

How Tandem MS sequencing works • Use Tandem MS: two mass analyzers in series with a collision cell in between • Collision cell: a region where the ions collide with a gas (He, Ne, Ar) resulting in fragmentation of the ion • Fragmentation of the peptides occur in a predictable fashion, mainly at the peptide bonds • The resulting daughter ions have masses that are consistent with known molecular weights of dipeptides, tripeptides, tetrapeptides… Ser-Glu-Leu-Ile-Arg-Trp Collision Cell Ser-Glu-Leu-Ile-Arg Ser-Glu-Leu-Ile Ser-Glu-Leu Etc…


Data Analysis Limitations -You are dependent on well annotated genome databases -Data is noisy. The spectra are not always perfect. Often requires manual determination. -Database searches only give scores. So if you have a false positive, you will have to manually validate them
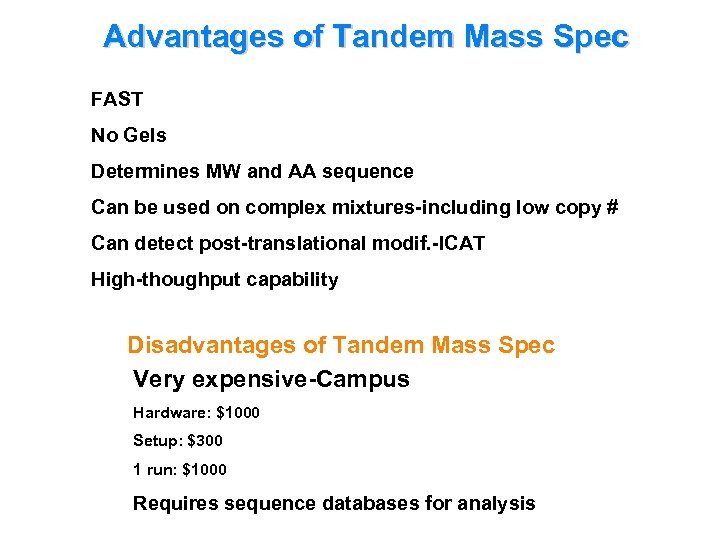
Advantages of Tandem Mass Spec FAST No Gels Determines MW and AA sequence Can be used on complex mixtures-including low copy # Can detect post-translational modif. -ICAT High-thoughput capability Disadvantages of Tandem Mass Spec Very expensive-Campus Hardware: $1000 Setup: $300 1 run: $1000 Requires sequence databases for analysis
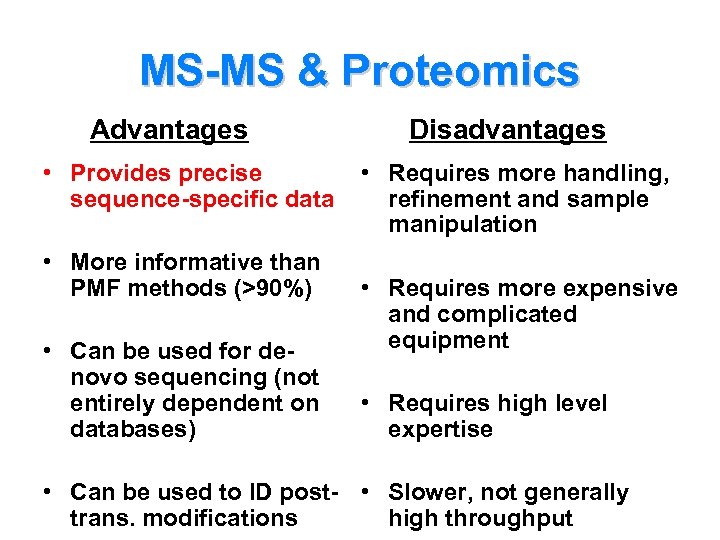
MS-MS & Proteomics Advantages • Provides precise sequence-specific data • More informative than PMF methods (>90%) • Can be used for denovo sequencing (not entirely dependent on databases) Disadvantages • Requires more handling, refinement and sample manipulation • Requires more expensive and complicated equipment • Requires high level expertise • Can be used to ID post- • Slower, not generally trans. modifications high throughput
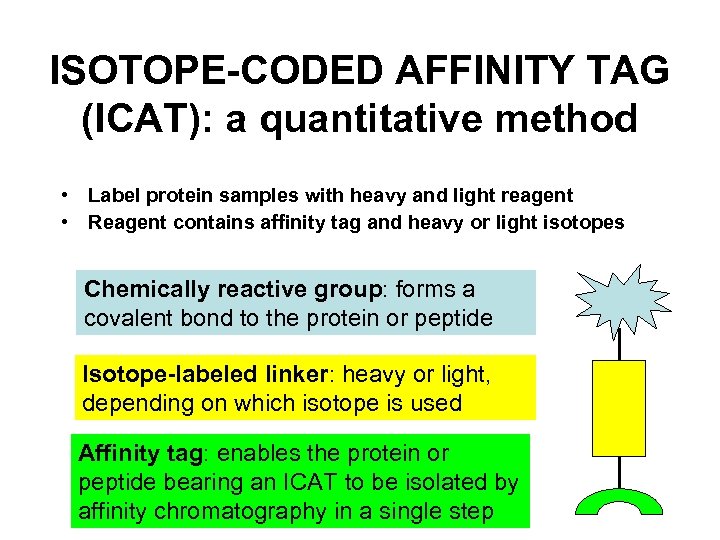
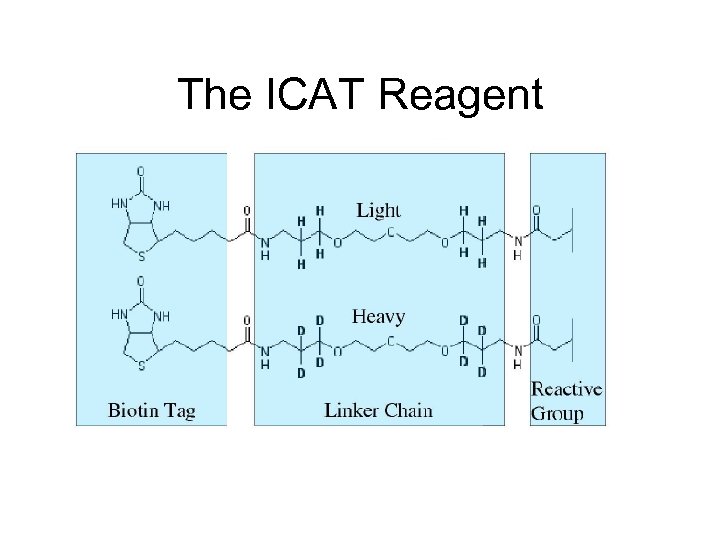
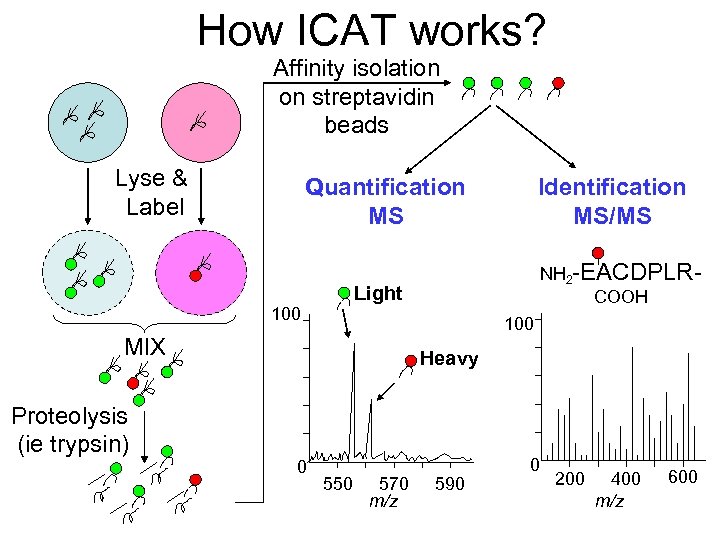
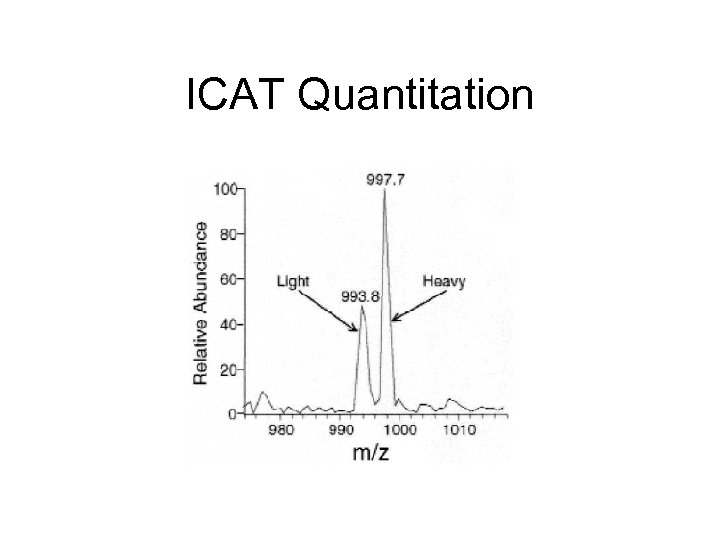
ISOTOPE-CODED AFFINITY TAG (ICAT): a quantitative method • Label protein samples with heavy and light reagent • Reagent contains affinity tag and heavy or light isotopes Chemically reactive group: forms a covalent bond to the protein or peptide Isotope-labeled linker: heavy or light, depending on which isotope is used Affinity tag: enables the protein or peptide bearing an ICAT to be isolated by affinity chromatography in a single step
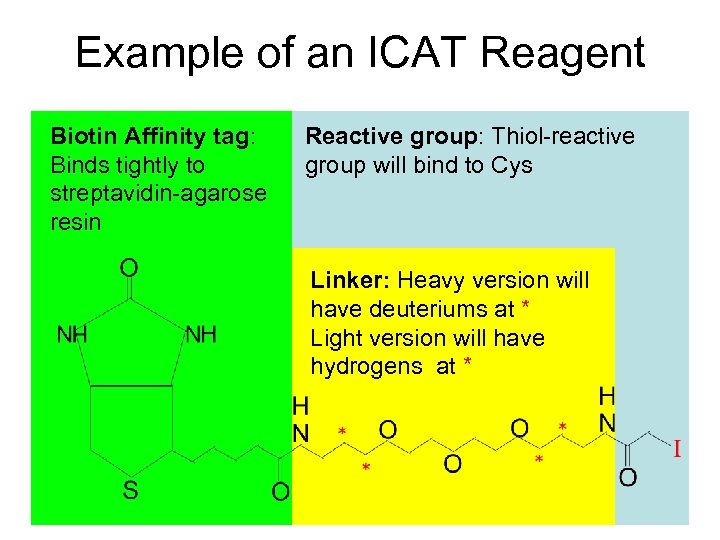
Example of an ICAT Reagent Biotin Affinity tag: Binds tightly to streptavidin-agarose resin Reactive group: Thiol-reactive group will bind to Cys Linker: Heavy version will have deuteriums at * Light version will have hydrogens at *
The ICAT Reagent
How ICAT works? Affinity isolation on streptavidin beads Lyse & Label Quantification MS NH 2 -EACDPLRCOOH Light 100 MIX Proteolysis (ie trypsin) Identification MS/MS Heavy 0 550 570 m/z 590 0 200 400 m/z 600
ICAT Quantitation
ICAT Advantages vs. Disadvantages • Estimates relative protein levels between samples with a reasonable level of accuracy (within 10%) • Yield and non specificity • Can be used on complex mixtures of proteins • Expensive • Slight chromatography differences • Tag fragmentation • Cys-specific label reduces sample complexity • Peptides can be sequenced directly if tandem MS-MS is used • Meaning of relative quantification information • No presence of cysteine residues or not accessible by ICAT reagent
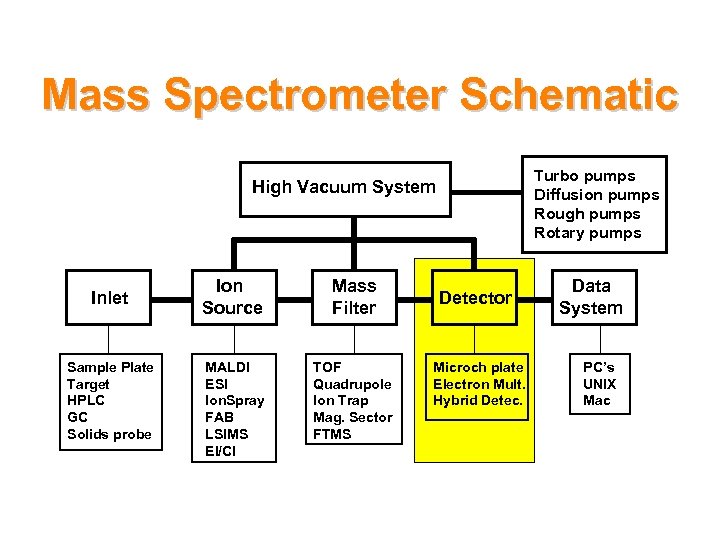
Mass Spectrometer Schematic Turbo pumps Diffusion pumps Rough pumps Rotary pumps High Vacuum System Inlet Sample Plate Target HPLC GC Solids probe Ion Source Mass Filter MALDI ESI Ion. Spray FAB LSIMS EI/CI TOF Quadrupole Ion Trap Mag. Sector FTMS Detector Microch plate Electron Mult. Hybrid Detec. Data System PC’s UNIX Mac
MS Detectors • Early detectors used photographic film • Today’s detectors (ion channel and electron multipliers) produce electronic signals via 2 o electronic emission when struck by an ion • Timing mechanisms integrate these signals with scanning voltages to allow the instrument to report which m/z has struck the detector • Need constant and regular calibration
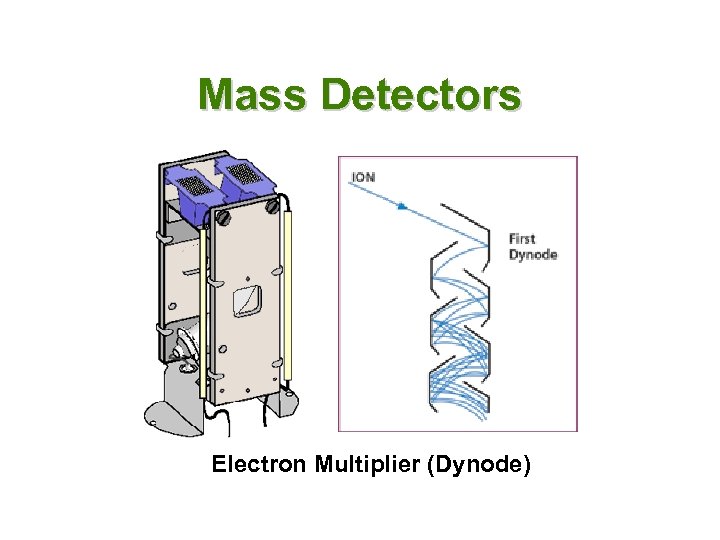
Mass Detectors Electron Multiplier (Dynode)
Limitations of Proteomics -solubility of indiv. protein differs -2 D gels unable to resolve all proteins at a given time -most proteins are not abundant (ie kinases) -proteins not in the database cannot be identified -multiple runs can be expensive -proteins are fragile and can be degraded easily -proteins exist in multiple isoforms -no protein equivalent of PCR exists for amplification of small samples
Shotgun Proteomics: Multidimensional Protein Identification Technology (Mud. PIT)
General Strategy for Proteomics Characterization Fractionation & Isolation 2 -DE Liquid Chromatography Peptides Characterization Mass Spectrometry • Identification • Post Translational modifications • Quantification Database Search MALDI-TOF MS -(LC)-ESI-MS/MS
Overview of Shotgun Proteomics: Mud. PIT Protein Mixture Digestion Tandem Mass Spectrometer 2 D Chromatography RP MS/MS Spectrum SEQUEST® DTASelect & Contrast SCX Peptide Mixture > 1, 000 Proteins Identified
Mud. PIT IEX-HPLC Trypsin + proteins p 53 RP-HPLC
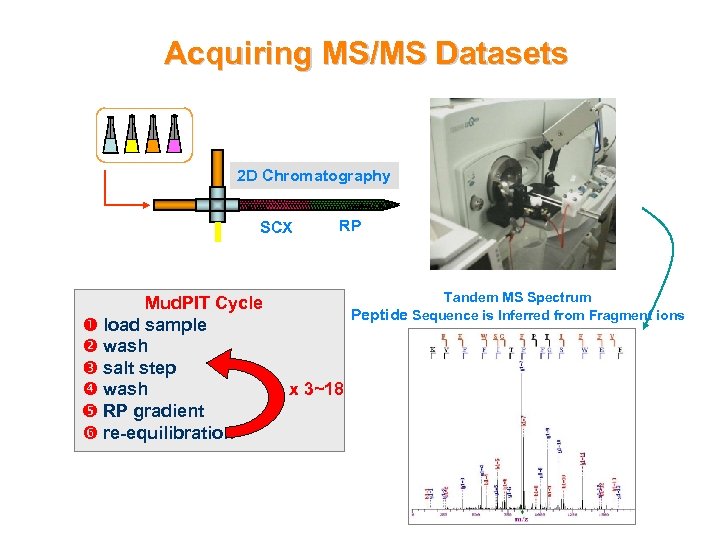
Acquiring MS/MS Datasets 2 D Chromatography SCX Mud. PIT Cycle load sample wash salt step wash RP gradient re-equilibration RP Tandem MS Spectrum Peptide Sequence is Inferred from Fragment ions x 3~18
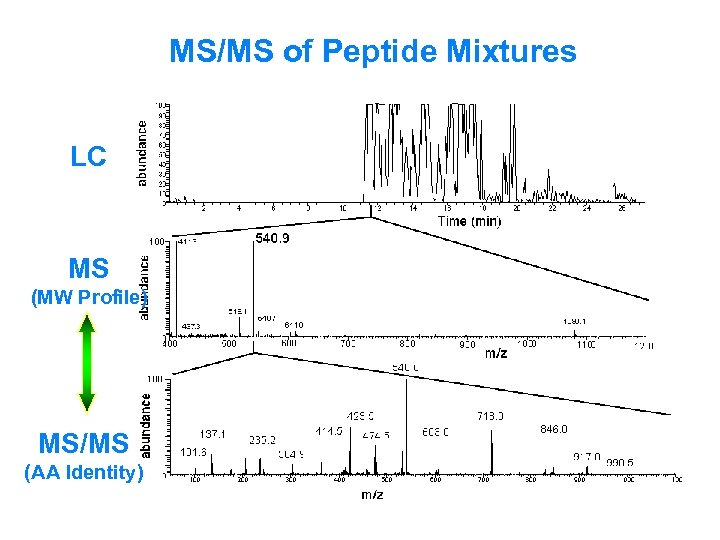
MS/MS of Peptide Mixtures LC MS (MW Profile) MS/MS (AA Identity)
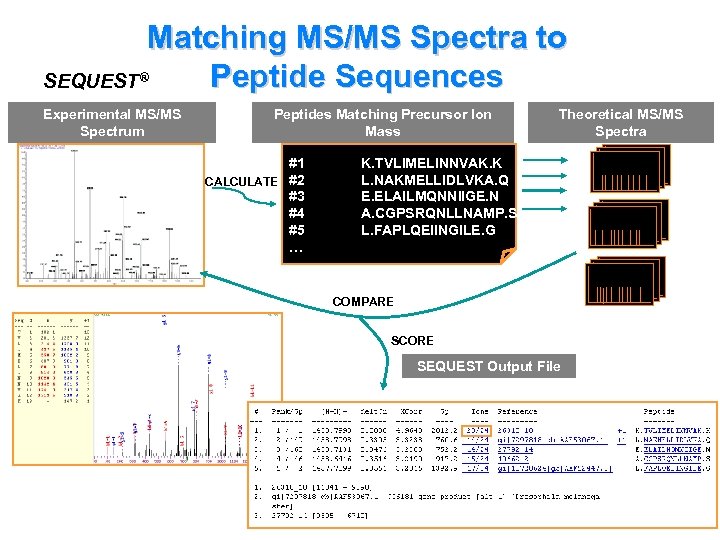
Matching MS/MS Spectra to Peptide Sequences SEQUEST® Experimental MS/MS Spectrum Peptides Matching Precursor Ion Mass #1 CALCULATE #2 #3 #4 #5 … Theoretical MS/MS Spectra K. TVLIMELINNVAK. K L. NAKMELLIDLVKA. Q E. ELAILMQNNIIGE. N A. CGPSRQNLLNAMP. S L. FAPLQEIINGILE. G COMPARE SCORE SEQUEST Output File
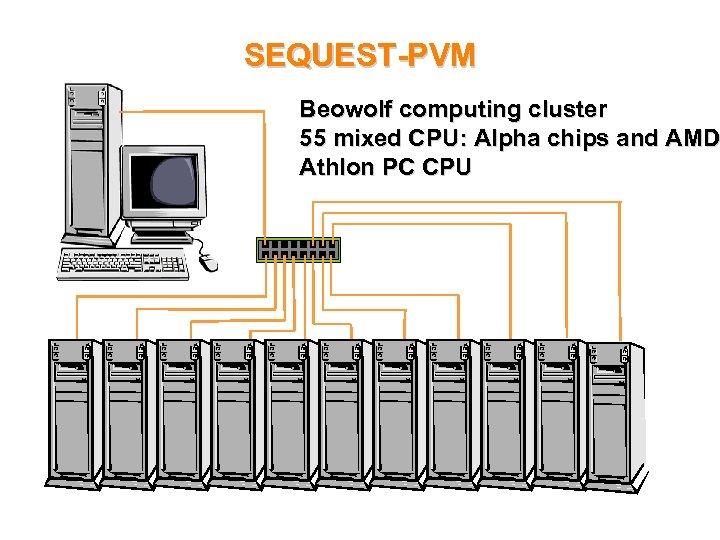
SEQUEST-PVM Beowolf computing cluster 55 mixed CPU: Alpha chips and AMD Athlon PC CPU
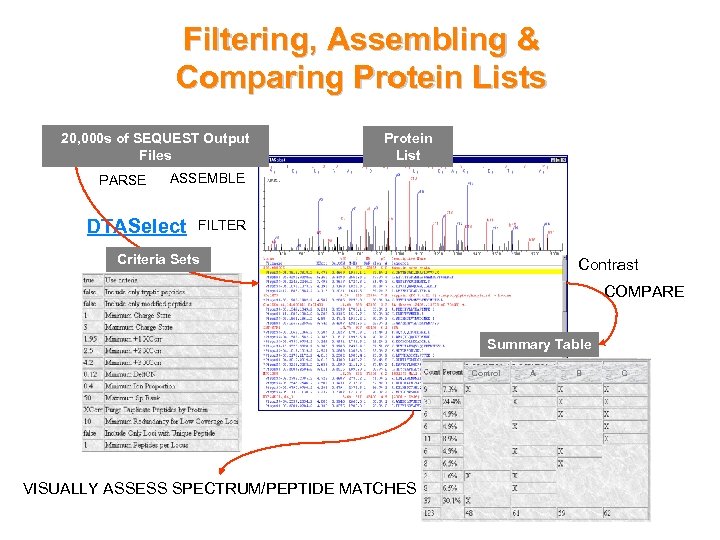
Filtering, Assembling & Comparing Protein Lists 20, 000 s of SEQUEST Output Files PARSE Protein List ASSEMBLE DTASelect FILTER Criteria Sets Contrast COMPARE Summary Table Control VISUALLY ASSESS SPECTRUM/PEPTIDE MATCHES A B C
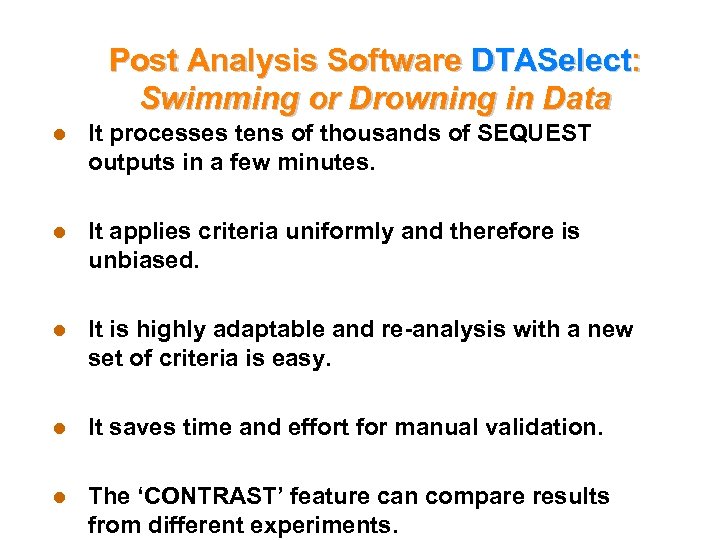
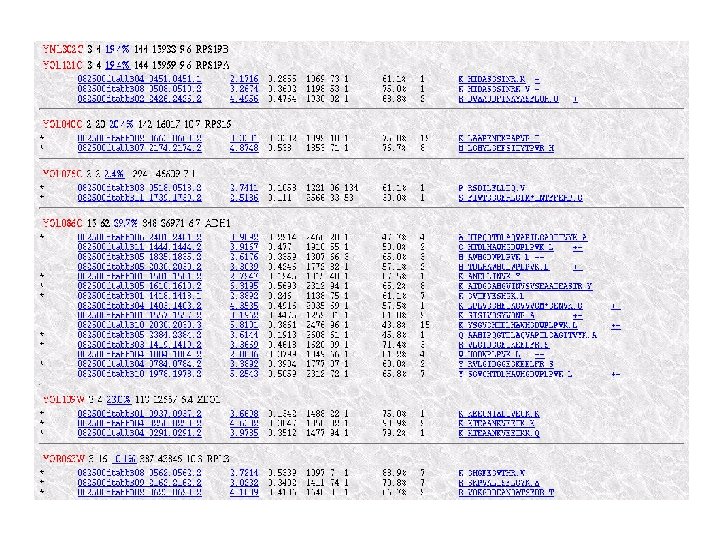
Post Analysis Software DTASelect: Swimming or Drowning in Data l It processes tens of thousands of SEQUEST outputs in a few minutes. l It applies criteria uniformly and therefore is unbiased. l It is highly adaptable and re-analysis with a new set of criteria is easy. l It saves time and effort for manual validation. l The ‘CONTRAST’ feature can compare results from different experiments.
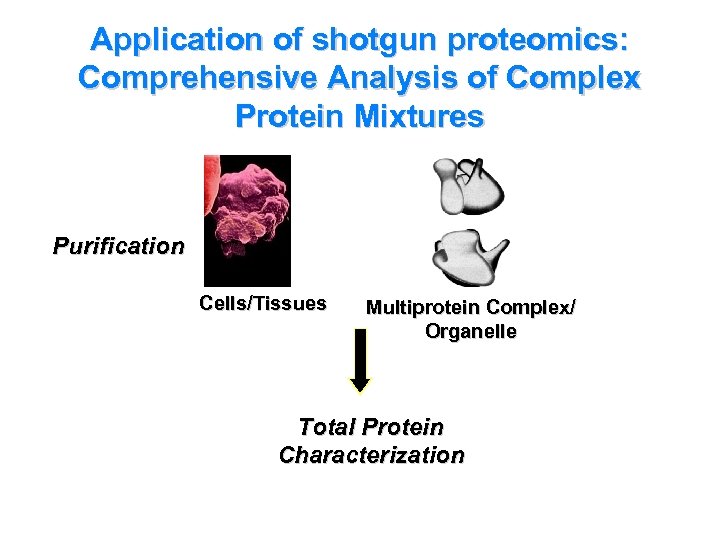
Application of shotgun proteomics: Comprehensive Analysis of Complex Protein Mixtures Purification Cells/Tissues Multiprotein Complex/ Organelle Total Protein Characterization
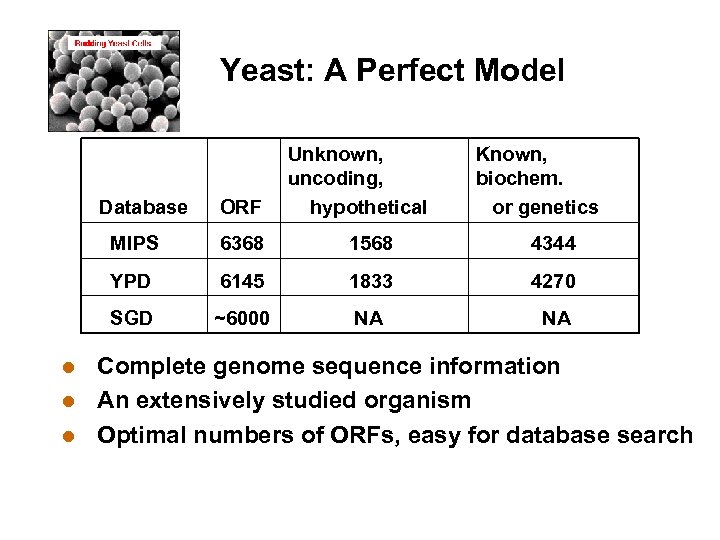
Yeast: A Perfect Model Database ORF Unknown, uncoding, hypothetical Known, biochem. or genetics MIPS 6368 1568 4344 YPD 6145 1833 4270 SGD ~6000 NA NA Complete genome sequence information l An extensively studied organism l Optimal numbers of ORFs, easy for database search l
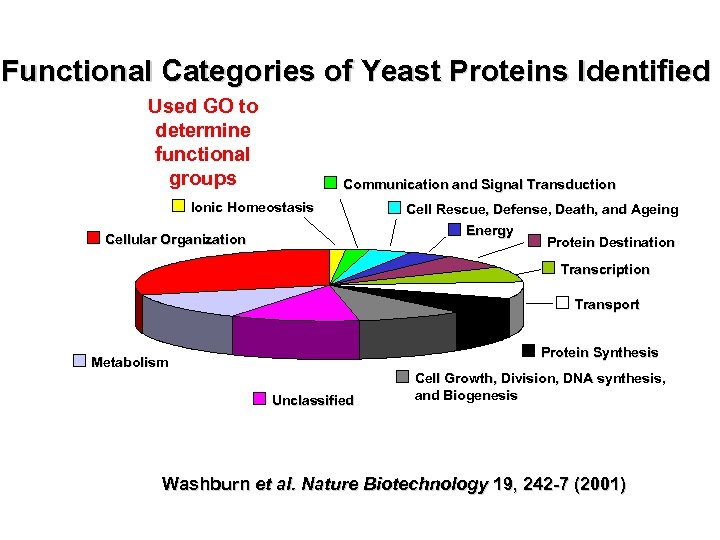
Functional Categories of Yeast Proteins Identified Used GO to determine functional groups Communication and Signal Transduction Ionic Homeostasis Cell Rescue, Defense, Death, and Ageing Energy Cellular Organization Protein Destination Transcription Transport Protein Synthesis Metabolism Unclassified Cell Growth, Division, DNA synthesis, and Biogenesis Washburn et al. Nature Biotechnology 19, 242 -7 (2001)
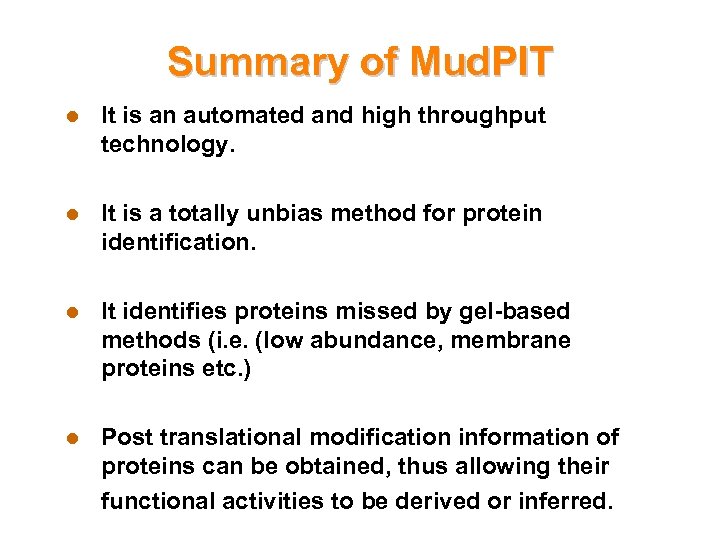
Summary of Mud. PIT l It is an automated and high throughput technology. l It is a totally unbias method for protein identification. l It identifies proteins missed by gel-based methods (i. e. (low abundance, membrane proteins etc. ) l Post translational modification information of proteins can be obtained, thus allowing their functional activities to be derived or inferred.
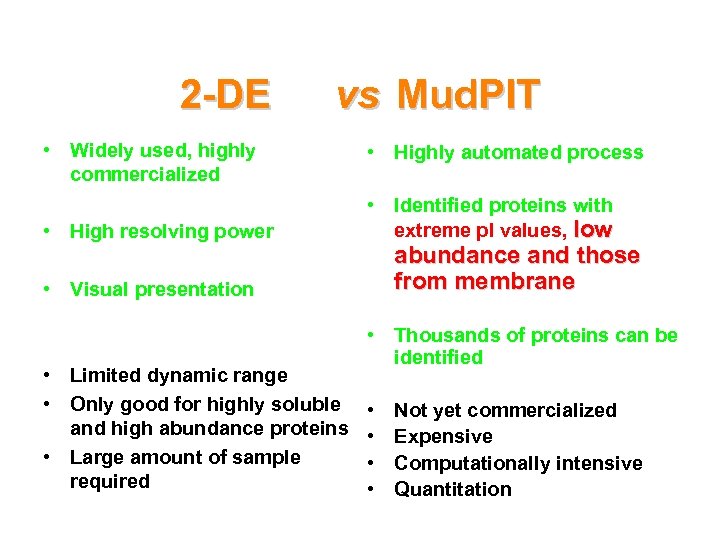
2 -DE vs Mud. PIT • Widely used, highly commercialized • High resolving power • Highly automated process • Identified proteins with extreme p. I values, low abundance and those from membrane • Visual presentation • Limited dynamic range • Only good for highly soluble and high abundance proteins • Large amount of sample required • Thousands of proteins can be identified • • Not yet commercialized Expensive Computationally intensive Quantitation
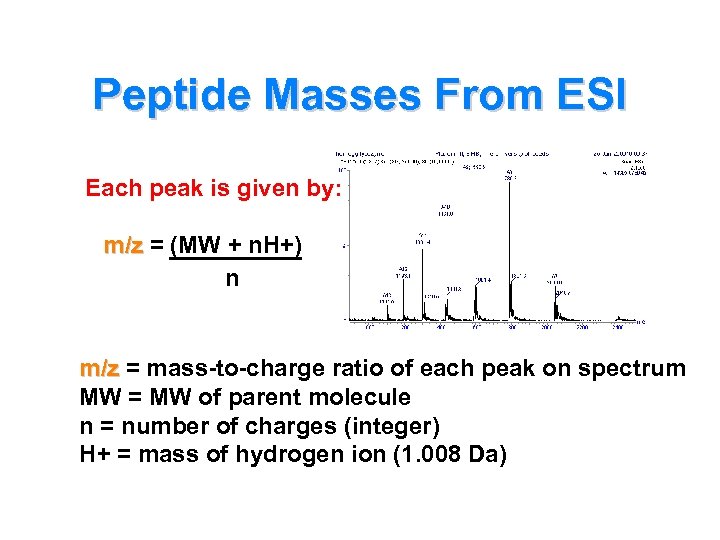
Peptide Masses From ESI Each peak is given by: m/z = (MW + n. H+) n m/z = mass-to-charge ratio of each peak on spectrum MW = MW of parent molecule n = number of charges (integer) H+ = mass of hydrogen ion (1. 008 Da)
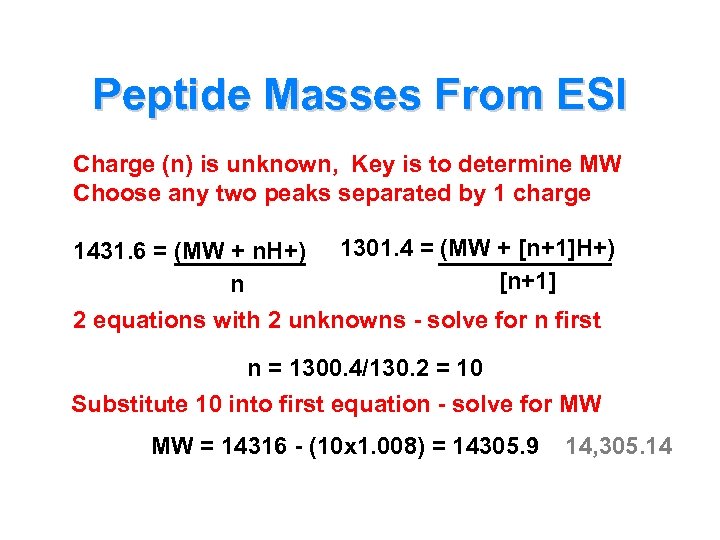
Peptide Masses From ESI Charge (n) is unknown, Key is to determine MW Choose any two peaks separated by 1 charge 1431. 6 = (MW + n. H+) 1301. 4 = (MW + [n+1]H+) [n+1] n 2 equations with 2 unknowns - solve for n first n = 1300. 4/130. 2 = 10 Substitute 10 into first equation - solve for MW MW = 14316 - (10 x 1. 008) = 14305. 9 14, 305. 14
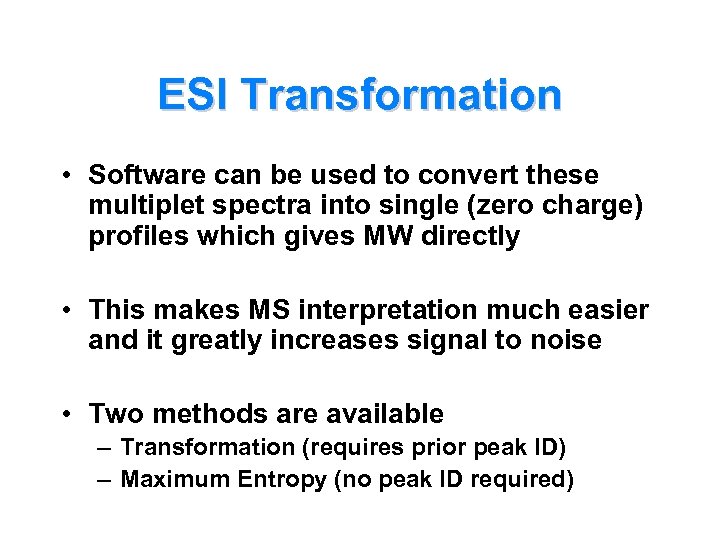
ESI Transformation • Software can be used to convert these multiplet spectra into single (zero charge) profiles which gives MW directly • This makes MS interpretation much easier and it greatly increases signal to noise • Two methods are available – Transformation (requires prior peak ID) – Maximum Entropy (no peak ID required)
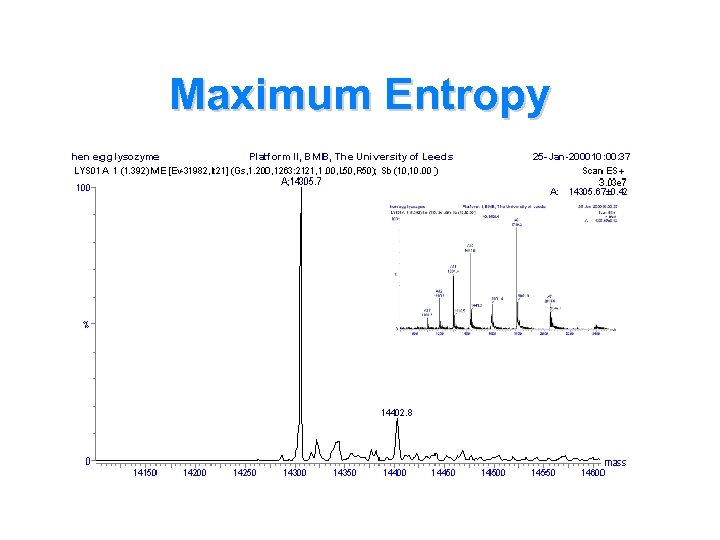
Maximum Entropy
ESI and Protein Structure • ESI spectra are actually quite sensitive to the conformation of the protein • Folded, ligated or complexed proteins tend to display non-gaussian peak distributions, with few observable peaks weighted toward higher m/z values • Denatured or open form proteins/peptides which ionize easier tend to display many peaks with a classic gaussian distribution
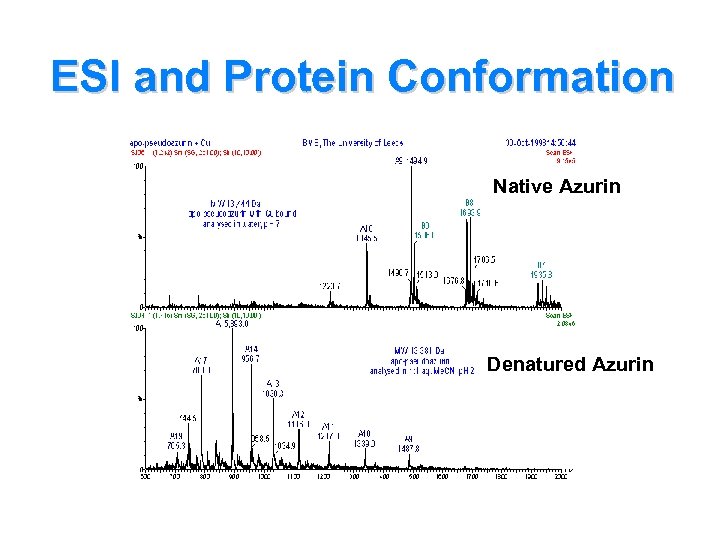
ESI and Protein Conformation Native Azurin Denatured Azurin
Different MS-MS Modes • Product or Daughter Ion Scanning – first analyzer selects ion for further fragmentation – most often used for peptide sequencing • Precursor or Parent Ion Scanning – no first filtering, used for glycosylation studies • Neutral Loss Scanning – selects for ions of one chemical type (COOH, OH) • Selected/Multiple Reaction Monitoring – selects for known, well characterized ions only

THE END
0d141e272bbed637e353a18cda4d634e.ppt