

421825e082026a1e0d724963e5579658.ppt
- Количество слайдов: 59
 Marketing Tool Kit Framing Marketing Strategy
 6. Monitor Results Framing Marketing Strategy © 1998 COPYRIGHT 1. Identify Opportunities/Threats 5. Value Creation and Delivery What are the Strategic Windows 3. Have a Vision 4. Know the Numbers Be Consistent What is it we are selling? Sensitivity Analysis (what if) Marketers Determine the Concept 2. Understand Consumers & Segments Segmenting by Person-Situation Purchase Behavior
 www. channelseven. com") Important Sources of Information www. clickz. com (reviews of marketing campaigns) www. channelseven. com (executive resource for marketing) www. internet. com/IAR (advertising related press) www. mediametrix. com (site ratings/reports) www. pcdata. com (site ratings/reports) www. iconocast. com (click on the "internet at a glance" link on the right -gives internet marketing trends and is extremely useful) www. cyberatlas. com (latest marketing research resource) www. nielsen-netratings. com (number of ads reached) www. microscope. com(reviews banner advertising campaigns) www. o-a. com(on email advertising discussion group) The two leading online research firms: www. forrester. com www. jup. com
Important Sources of Information www. clickz. com (reviews of marketing campaigns) www. channelseven. com (executive resource for marketing) www. internet. com/IAR (advertising related press) www. mediametrix. com (site ratings/reports) www. pcdata. com (site ratings/reports) www. iconocast. com (click on the "internet at a glance" link on the right -gives internet marketing trends and is extremely useful) www. cyberatlas. com (latest marketing research resource) www. nielsen-netratings. com (number of ads reached) www. microscope. com(reviews banner advertising campaigns) www. o-a. com(on email advertising discussion group) The two leading online research firms: www. forrester. com www. jup. com
 Terms and Definitions: CPM - Cost per Mil CPA - Cost per Acquisition CPD - Cost per Download CPC - Cost per Click RFI - Request for Information RFP - Request for Proposal (sent out by agencies requesting for demographic data, traffic data, and ad specs from publishers - very common) Slotting Fees Banner Serving Software (DART, Adforce, Netgravity, Accipiter, Engage, etc. ) Advertising Measurement and Reporting(views, clicks, actual sales, total traffic generated from campaigns, etc). The difference between a CPC network (like valueclick) and a CPM network(like doubleclick), and how to convert CPC to CPM's.
 Developing a Marketing Strategy and Marketing Plan Target Marketing Strategy = + + Marketing Mix Time-Related Details and Budget = Marketing Plan + Other Marketing Plans = A Firm’s Marketing Program
 Focus on fulfilling wants not needs Customer Compelled Focus on products, processes or tactics not consumer needs Internal Orientation • Production Reaction Customer Driven • Product Marketing Concept Fulfilling needs not wants • Sales
 Components of a Market Orientation Marketing Knowledge Marketing Leadership Market Orientation Customer Satisfaction Employee Retention Employee Satisfaction Employee Productivity Customer Retention Service Quality Business Profitability & Growth
 The Process of Formulating and Implementing Marketing Strategy Corporate Vision and Strategy External Environment Top Down Approach Business-Level Objectives and Strategy Market Opportunity Analysis • • Environmental and competitor Analysis Industry Dynamics Customer analysis, segmentation and targeting decisions Positioning decisions Marketing Program Components: Pricing, Distribution Promotion, Product Strategies for Specific Market Situations Strategies for new markets, growth markets, mature and declining markets and global marketing strategies Bottom up Approach Implementation and Control of Marketing Strategies
 I. Marketing Concepts: Their Relationship to Company Performance Perceived Quality 1 Customer Satisfaction Perceived Price Intrinsic attributes Extrinsic attribute Reputation (Brand name) Value = Benefits - price 5 3 2 Perceived Value Market Share Customer Loyalty Long Term 4 ROA = Net Profits/Assets Profit Margin = Net profits/Net sales + Asset Turnover = Net sales/Total Assets
 Identify Opportunities and Threats
 The Six Thinking Hats Edward De Bono How do you get consumers to be creative, and stop being persistently negative or positive? The six thinking hats is a questioning approach to get consumers to be creative in seeing the total picture (positive, negatives, opportunities, and potential problems) when developing and discussing new products or ideas. Overview White Hat The white hat has to do with information. The white hat focuses on what we know about a given product, service or idea. Red Hat The red hat has to do with feelings, intuition, and emotions. The red hat focuses on the gut-feeling of the consumer. Grey Hat The grey hat is for critical judgement. The grey hat focuses on why things simply don’t work. Yellow Hat The yellow hat is the optimistic hat. The yellow hat focuses on what works now--the benefits, feasibility and value of our present ideas. Green Hat The green hat is for creative thinking and new ideas. The green hat focuses on how things can be done better and emphasizes additional alternatives and suggestions--could we do things in a different way? Blue Hat The blue hat is for process-control. The blue hat asks for summaries, conclusions, and decisions.
 The Marketing Environment Regulation Marketing Strategies Product Competition Place Politics Opportunities and Threats Respond to Price Society Promotional Technology Marketing Strategies Economic Conditions External Environment Seek Exposure to Broad Trends Delineate Relevant Trends To manage a business well is to manage its future; and to manage the future is to manage information. Marion Harper
 Potential Entrants Competition Issues • Economies of scale • Absolute cost advantage • Brand identity • Access to distribution • Switching costs • Government policy Threat of Suppliers new entrants The Industry Bargaining • Concentration power • Number of buyers • Substitute of Suppliers Degree of Rivalry • Number of competitors • Industry growth • Asset intensity • Product differentiation • Exit barriers Threat of substitute Bargaining power of Customers products or services Substitutes • Functional similarity • Price performance trend • Product Identity Source: Michael E. Porter (1980) “Industry Structures and Competitive Strategy” Buyers • Buyer concentration • Number of suppliers • Switching Costs • Substitute products • Threat of backward integration
 Have A Vision
 Product/Service Vision A. There are three levels of a product 1. The core product--the benefits received. 2. The tangible product. 3. The augmented product--additional services and benefits. Augmented Tangible Core product = Tangible product = Augments = What are we selling?
 Brand Design Schematic Brand Expression W Reasons to Believe Big Mac or Super Size di ng Na Reasons to Believe in m Happy Meal meaningful Reasons to Believe g turin Pic Reasons to Believe Tone or Animating Leverage Point Values Des crib Did somebody say Reasons to Mc. Donalds Believe Let’s go after class and buy one! Reasons to Believe ing Visual Relevant Verbal Symbolizing g
 What is Brand Equity? Perceived Brand Quality Brand Awareness Brand Loyalty • Attributes • Benefits • Attitudes Brand Equity Provides Value to Customer by Enhancing Customer’s: • Interpretation/processing of information • Confidence in the Purchase Decision • Use Satisfaction Source: Aaker (1991) “Managing Brand Equity” Brand Associations Other Proprietary Brand Assets Provides Value to Firm by Enhancing: • Efficiency and Effectiveness of Marketing Programs • Brand Loyalty • Prices/margins • Trade Leverage • Competitive Advantage
 Sustainable Competitive Advantage The way you compete Product strategy Position Strategy Manufacturing Strategy Distribution Strategy Basis of competition Skills and assets Where you compete Product-market selection Whom you compete against Competitor selection Source: Aaker (1992) “Strategic Market Management” Sustainable Competitive Advantage
 Strategic Thrusts Synergy Enhance customer value Reduce operations costs Reduce required investments Preemptive Move Supply systems Product Producing systems Gain customer loyalty/commitment Distribution/service Differentiation Quality Name Customer Orientation Brand loyalty Augmented Product Patent protection Peripheral service Technical superiority Distribution Product-line breath Source: Aaker (1992) “Strategic Market Management” Strategic Thrust Low Cost Focus Product focus Segment focus Geographic focus No-frills product Product design Raw material or labor source Government subsidy Locations Production innovation and automation Purchasing competitors Reducing overhead Scale economies the experience curve A low-cost culture
 Porters Four Business Strategies Source of Competitive Advantage Low Cost Competitive Scope Cost Leadership Differentiation Narrow Target Offer products that have a broad appeal, but also have unique features that warrant a higher price. . Focus on Cost Broad Target Appeal to a broad market, produce products in large quantities, and charge low prices. Focus on Differentiation Appeal to narrow market segment or segments and charge low prices. Select a narrow market segment or segments and offer products that have a unique appeal.
 New Markets Present Markets I V. Alternative Growth Strategies Present Products I. Growth in existing product markets • Increasing market share • Increasing product usage Increasing the frequency used Increasing the quantity used Find new applications for current users III. Market development • Expand geographically • Target new segments New Products II. Product development • Add product features, product refinement • Expand the product line • Develop a new generation product • Develop new products for the same market IV. Diversification involving new products, new markets • Related • Unrelated Vertical Integration--Backward and Forward
 Understanding Consumers and Segments
 Consumer Behavior is a Process not a Purchase Problem Recognition Discrepancy between actual and desired state--Why and How consumers get interested Routinized Response Information Search Evaluation of Alternatives Purchase Postpurchase Evaluation External Search Versus Internal Search n Ao = 3 biei i =1 Where When How Value Analysis What drives the purchase behavior Behaviors: Past, Present, Future Delight = P > E Satisfaction = P = E Dissatisfaction =P < E
 Issue Tree What are the met and unmet needs and problem areas for consumers in a given segment What behaviors characterize consumers What benefits do consumers seek to achieve What problems do consumers attempt to solve What solutions do consumers use? What dissatisfactions exist for consumers
 Market Targeting--the firm must decide how many segments to cover and how to identify the best ones. Total market approach Single Marketing Mix Target Market Concentration approach Single Marketing Mix Segment II (Target market) Segment III Multisegment approach Target Market I Marketing Mix 1 Marketing Mix 2 Target Market II Marketing Mix 3 Target Market III
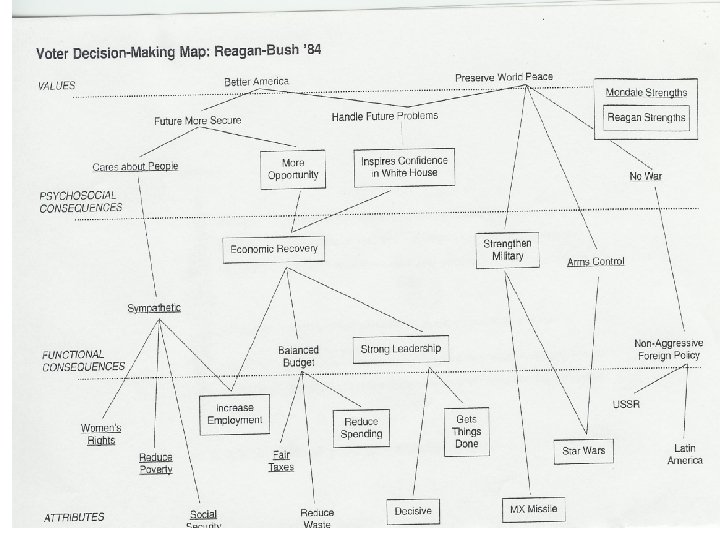
 Heart Laddering: a Means-End Theory in-depth probing approach which attempts to uncover the link between product attributes (A), personal outcomes (consequences C), and values (V) that serve to structure the components of the cognitive network in a consumer's mind. Personal Values Psycho/Social Consequence Personal (Emotional) Functional Consequence Product Attribute Product (Rational)
 Person by Situation Segmentation 1. Profile segments 2. Rank segments Person 3. Identify competitors 4. Identify company’s position Usage Situation Benefits sought Salient attributes Behaviors 3 Competitor B Competitor A Company 2 Company 1 Competitor C
 Person/Situation Segmentation Step 1: Use observational studies, focus group interviews, and secondary data to discover whether different usage situations exist and whether they are determinant, in the sense that they appear to affect the importance of various product characteristics. Step 2: Identify needs, benefits and perceptions by usage situation as well as by individual difference characteristics. Step 3: Construct a person/situation segmentation matrix. The rows are the major usage situations and the columns are the groups of users identified by a single characteristic or combination of characteristics. Step 4: Profile each nonempty cell. State the major benefits sought, important product attributes, and unique market behavior for each nonempty cell of the matrix. (Some types of people will never consume the product in certain situations. ) Step 5: Rank the cells in the matrix in terms of potential sales volume. Step 6: Position your competitors’ offerings within the matrix. The person/situation segments they currently serve can be determined by the product feature they promote and other marketing strategies. Step 7: Position your offering within the matrix on the same criteria. Step 8: Assess how well your current offering and marketing strategy meet the needs of the segment compared to the competitions’ offering. Step 9: Identify market opportunities based on segment size, needs, and competitive advantage.
 Convey the Benefits to The Swing Group Reduce the Barriers to Purchase Those Who Hate US Those who are Indifferent Future Barriers Swing Group Those Who Love US Understand Benefits
 Know the Numbers
 Fundamental Market-Based Strategies and Profitable Growth $40
 Quantitative Analysis for Marketing Contribution Analysis Break-Even Analysis Total cost for output level V Break-even volume (BEV) is the volume at which the firm’s total revenues equal total costs; below BEV, the firm has a loss; above BEV, the firm shows a profit. Variable cost = Fixed cost + for output level V Unit contribution = Price - Unit variable cost Total contribution = (Unit contribution)V Fixed cost BEV = -----------Unit contribution (where V is total output) Total contribution Total = revenue - variable cost Total revenue Cost Profit Total cost Fixed cost Units Total cost Loss BEV Units
 Cumberland Metal Industries: Marketing Strategies Marketing Effort Technical Value Customer’s Perceived Value Pricing Decision
 Purchase Process Touchpoints Advertising or Marketing Program Editorial Colleague Seminar Presentatio n Channe l Partner TIME Awareness/Education Consideration Sales Contact Direct Mail Flash Demo E-mail Newsletter Landing Page Purchase Collaboration
 Value Creation and Delivery
 Two views for Creating Value Make the Product Design product Make Sell the Product Price Sell Promote Distribute Choose the Value Provide the Value Communicate the Value • Product development • Salesforce • Customer segmentation • Service development • Sales Promotion • Market selection/focus • Pricing • Advertising • Value positioning • Sourcing/making • Public Relations Strategic Marketing Tactical Marketing
 Market Positioning Differentiation is the act of designing a set of meaningful differences to distinguish the company's offer from the competitors' offers. Positioning is the act of designing the company's offer so that it occupies a distinct and valued place in the target customers' minds. "Positioning is not what you do to a product. Positioning is what you do to the mind of the prospect. " (Al Ries and Jack Trout, Advertising Age, 1972) Perceptions are more important to positioning than attributes Competitive Advantage • Ben-Gay , pain relief to "warm-up" sports cream • Fresca as a "tasteful alternative" to mineral spring water • 7 -Up "Never had it, never will. " • Jello Jiggler as a snack food "A company should develop a unique selling proposition (USP) for each brand stick to it. " (Rosser Reeves, Reality in Advertising)
 Steps to Positioning • Find Attributes or Features of Your Product/Service • Do a Quadrant Analysis (Strengths and Weaknesses) • Develop a Perceptual Map • Don’t Develop a Me-too Strategy • Find Brand Essence Through Laddering and “Play to Your Strengths”
 Positioning Summary Does a brand’s category membership need to be established? Establish Membership Points-of-Parity Exemplar Yes No Is there a substantial brand benefit to serve as a point-of-difference? Yes Are benefits important to consumers? Yes No Do benefits conflict? Is there a a consumer insight about category use that can be owned? (Category Essence)? Yes No Yes Can the benefit be laddered up to Brand Essence? Yes Present Category Essence Present Brand Essence?
 Brand Positioning Conceptual Equation Criteria 1. Uniqueness: Find the hole and be the first to fill it. 2. Importance/Desirability: Be different in terms of something important 3. Believability/Support: The claim rests on its support Unique Claim Plausible Support Value = Product Service Quality/ + Psychic Quality Price + Time
 MIND Value Analysis Role in Making a Decision Low Importance High Performance Low Performance Gap Future Trouble High Importance Current Equity Gap
 Perceptual Mapping • • • Perceptual mapping encompasses a variety of mathematical approaches designed to place or describe consumers’ perceptions of brands or other objects on one or a series of spatial maps such that the relationship between brands can be easily seen. Brands located close together are in direct competition and brands closest to your ideal brand probably get most of your business. Perceptual mapping techniques are designed to accomplish four major tasks: 1. 2. to determine the number of dimensions consumers use to distinguish between or choose products; 2. 3. to provide insights into the nature or characteristics of these dimensions; 3. to locate brands on these dimensions as consumes perceive them; 4. 5. to determine the preferred location of a brand on each of the relevant dimensions.
 Perceptual Map of the Soft-Drink Market: Three Segments Based on Ideal Points Socially acceptable Mountain Dew Coca-Cola 7 -Up Pepsi 2 1 Dr. Pepper Sprite Fresca 3 Canada Dry RC Cola Shasta Socially unacceptable Tart Sweet
 Six Strategic Thinking Tools for Laddering Data Positive • Reinforce: Strengthen the network of positive attributes, consequences, and values. • Refocus: Add linkages between attributes and consequences or introduce new attributes and/or consequences • Redefine: Express a potential weakness so that it is perceived as a strength • Reframe: Express a competitors strength so that it is perceived as a weakness • Redirect: Divert attention away from a competitor’s strength to their weakness • Remove: Undermine a competitor’s strength by showing that the strength doesn’t exist. Negative
 MECCAS Values Bridge Personal Relevance Bridge Product Bridge Strong Leadership Gets Things Done, Decisive Leadership Message Elements Consumer Benefit Better America Driving Point More Opportunity, Confidence in White House Leverage Point Isn’t this a great framework to give to the advertising agency to spark creative thinking?
 A Framework for Developing Communication Strategy • Target • Person, situation Copy Strategy • Objective • Primary, Secondary • (Cognitive, Affective, Behavioral) • Benefit • Consumer Benefit • Reason To Believe • Message Elements • Tone • Heart Emotional Responses by… • Leverage Point/Driving Point Evaluation Execution • Communication effect • Awareness • Knowledge • Preference • Sales effect • Behavior • Message • AIDA • Promotion mix
 WHAT ARE THE KEY QUESTIONS IN DEVELOPING AND EVALUATING ADS? WHO SPOKESPERSON SAYS WHAT MESSAGE TO WHOM TARGET AUDIENCE HOW WITH WHAT EFFECT INFORMATION CHANNEL & TIMING ACTION DESIRED
 Loyalty The Consumer Thought Process: Marketing News, August 4, 1997 I’ll buy your product first Referral I’ll tell my friends to try you Satisfaction I like you Reinforcement Did I make the right decision Trial Show me what you can do Inclination I’ll look for you Image I know what you stand for Familiarity I know who you are Awareness I’ve heard of you Product Performance now counts!
 Twolevel channel (M-W-R-C) Threelevel") How Do You Reach Your Target Market Zerolevel channel (M-C) Twolevel channel (M-W-R-C) Threelevel channel (M-W-J-R-C) Retailer Wholesaler Retailer Jobber Retailer Consumer (M-R-C) Web Manufacturer Onelevel channel T 83 a
How Do You Reach Your Target Market Zerolevel channel (M-C) Twolevel channel (M-W-R-C) Threelevel channel (M-W-J-R-C) Retailer Wholesaler Retailer Jobber Retailer Consumer (M-R-C) Web Manufacturer Onelevel channel T 83 a
 Monitor Results
 Judging Good from Bad: Three Rules of Thumb Judging good from bad ads is an art not a science, but with some practice in applying these simple “rules of thumb” you can do quite well. However, to eliminate controversy with ad agencies, “ad testing” is always recommended if there is enough time. 1. Consumers can see / understand what is being sold quickly and easily 2. The product benefit is clearly shown / demonstrated 3. The product is depicted using big and/or exaggerated pictures / drawings
 Judging Good from Bad: Success Measures Ultimately, an ad is successful when it creates awareness for the product and advertiser, teaches consumers about product benefits, and sells product. When “ad testing” Starch / Roper summarize these factors into two measures. 1. Recall …percentage of people that can remember the ad and the advertiser 2. Persuasion …percentage of people that can remember the key selling point(s) from the ad Why these measures? First, an ad can’t work unless people remember the ad and associate the product with the advertiser, e. g. , recall an SUV was advertised manufactured by Honda. Second, an ad can’t work unless it conveys some benefit or point of distinction, e. g. , Honda SUVs are reliable and/or driven by the kind of smart people I aspire to be like.
 Judging Good from Bad: Why Care? Good ads work more efficiently than bad ads. On average, there will be about a 30% chance for target customers to recall a good ad, but often less than a 10% chance of recalling a bad ad. How does this translate into dollars? 1. Assume a $2 million advertising budget. If we use a bad ad, it will cost over $6 million to achieve the same impact as if we used a good ad! 2. Bad advertising is expensive, ad testing is relatively inexpensive. As a rule of thumb, spend 10% of the “media buy” testing and developing good ads. Now, try your luck at judging between good and bad ads. One ad of the pair performs above industry average. One ad of the pair performs below industry average.
 G. Measuring Marketing Results Procedures for Evaluating Specific Strategy Is Our Strategy Working? 20% not aware 100% Market 80% aware 40% did not try 60% tried 80% disappointed 20% satisfied Total Communication Expenditures Awareness Share of Voice Brand Trial Satisfaction Share of Mind and Heart Share of Market
 Major Determinants of Service Quality 1. Access: service is easy to obtain in convenient locations at convenient times with little waiting. 2. Communications: service is described accurately 3. Competence: employees possess the required skills and knowledge 4. Courtesy: employees are friendly, respectful and considerate 5. Credibility: company and employees are trustworthy 6. Reliability: service is performed with consistency 7. Security: service is free from danger, risk or doubt 8. Responsiveness: employees respond quickly and creatively 9. Tangibles: service tangibles correctly project service quality 10. Understanding the customer: know the needs of customers. Well managed Service Companies 1. Have top-management commitment to quality 2. Set high service quality standards 3. Have systems for monitoring service performance 4. Satisfy employees as well as customers *High-service businesses managed to charge more, grow faster, and make more profits on the strength of their superior service quality.
 Word-of-mouth communications Personal needs Past experiences Expected Service Consumer’s expected service-perceived service gap Consumer Perceived Service External communications to consumers Marketer Gap 1 Service delivery Gap 4 Gap 3 Management Gap 2 perceptions of consumer expectations Translation of perceptions into service quality specifications Using Gap Analysis To Evaluate Service Quality Journal of Marketing, 1985, A. Parasuraman, Zeithaml, and Berry
 You Must link Customer Satisfaction and Service Quality to Profitability and Market Share Improvement Effort Changes in Marketing Strategy and Operations Survey Customers and Employees Word-of-Mouth Attraction of New Customers Perceived Service Quality and Customer Satisfaction Customer Retention Loyalty Revenues and Market Share Profitability Cost Reductions
 Identifying Improvements in Value Chain Through Competitive Benchmarking Company Value Chain Support Activities Procurement Human Resources Management Technology Development Firm infrastructure Competitor Value Chain Primary Activities Inbound Logistics Primary Activities Potential for improved inbound logistics Inbound Logistics Operations Potential for improved operations Outbound Logistics Potential for improved outbound logistics Outbound Logistics Marketing and Sales Service Margin Potential for improved marketing activities Potential for improved service Potential for Improved Margins and profitability Marketing and Sales Service Margin