Market Analysis for Office Buildings Characteristics and Concepts


03-office_buildings.ppt
- Размер: 8.1 Mегабайта
- Количество слайдов: 44
Описание презентации Market Analysis for Office Buildings Characteristics and Concepts по слайдам
 Market Analysis for Office Buildings Characteristics and Concepts Wayne Foss, DBA, MAI, CRE, FRICS Foss Consulting Group Email: wfoss@fossconsult. com
 2 Building Users • Differentiated by Users/Tenants – Major Institutional/Professional • Occupied by banks, insurance companies, professionals, corporate headquarters – General Commercial • Smaller buildings, accessible to workers and markets • Parking is important, tenants are sales oriented – Medical and/or Dental • Generally located near hospitals
 3 Building Users • Differentiated by Users/Tenants – Quasi-industrial • may be located in industrial parks • flex and/or research and development – Pure industrial • part of a manufacturing operation – Government and/or Education
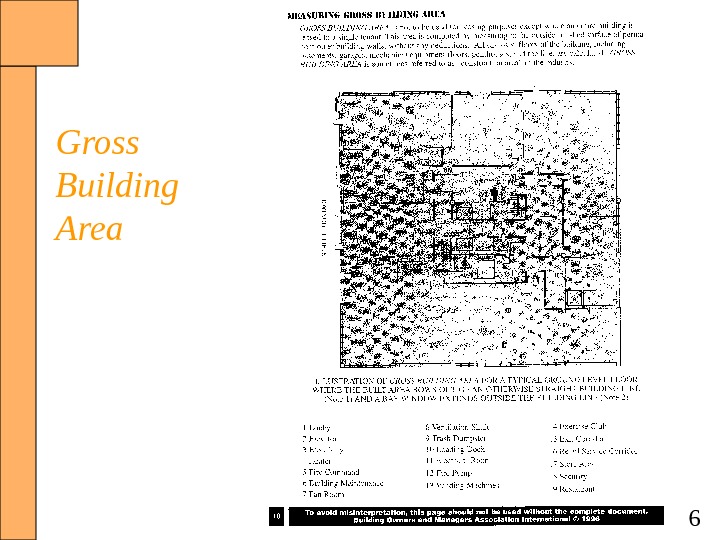
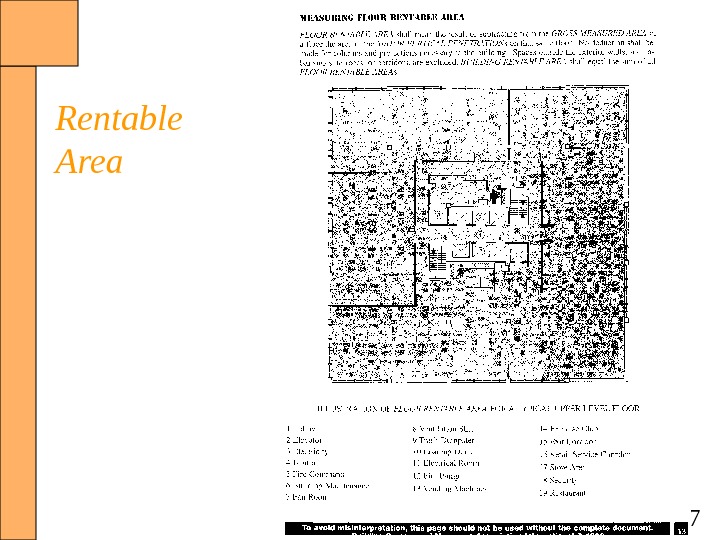
 4 Building Terms • Gross Building Area (GBA) – Total area of the building in square feet • Rentable Area – Usually considered the tenant’s pro rata share of the entire building. – Excludes elements of the building that penetrate through the floor
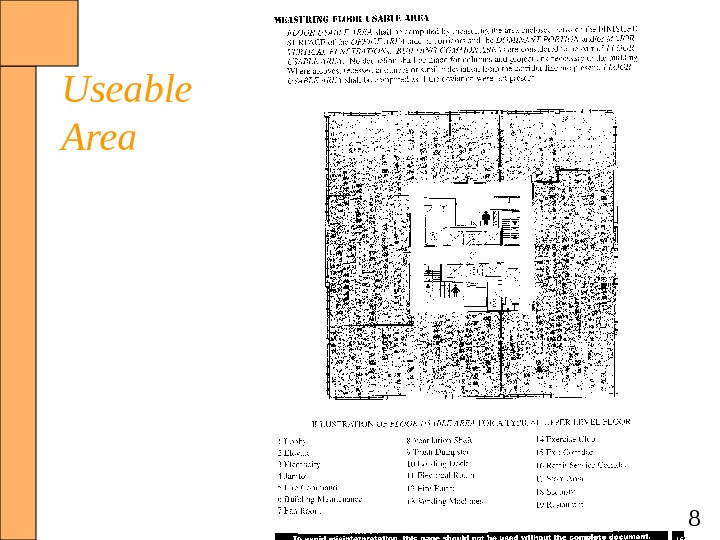
 5 Building Terms • Rented Area – Amount of space under lease in a building • Net Occupied Space (Useable) – Area within the building occupied by the tenant(s) • Efficiency ratio – Rentable area divided by gross building area • Store Area – Number of square feet in ground floor store area
 6 Gross Building Area
 7 Rentable Area
 8 Useable Area
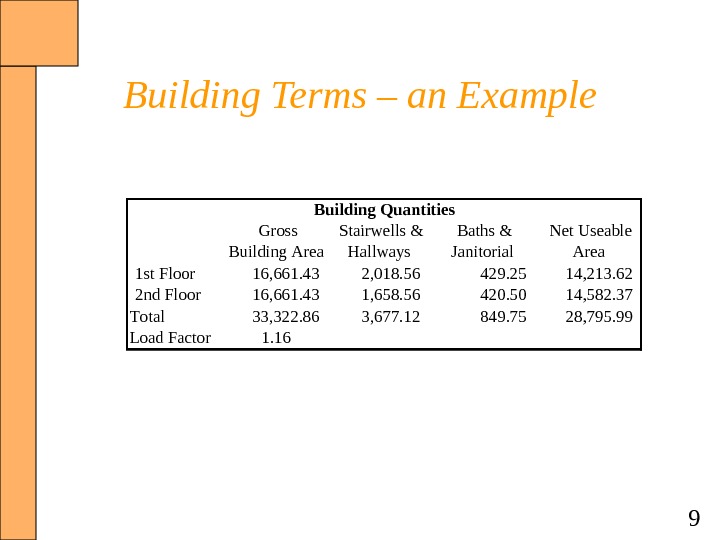
 9 Building Terms – an Example Gross Building Area Stairwells & Hallways Baths & Janitorial Net Useable Area 1 st Floor 16, 661. 43 2, 018. 56 429. 25 14, 213. 62 2 nd Floor 16, 661. 43 1, 658. 56 420. 50 14, 582. 37 Total 33, 322. 86 3, 677. 12 849. 75 28, 795. 99 Load Factor 1. 16 Building Quantities
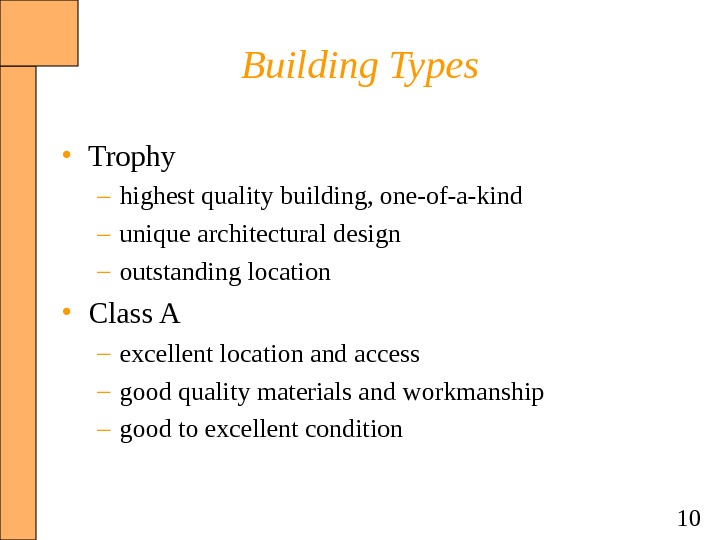
 10 Building Types • Trophy – highest quality building, one-of-a-kind – unique architectural design – outstanding location • Class A – excellent location and access – good quality materials and workmanship – good to excellent condition
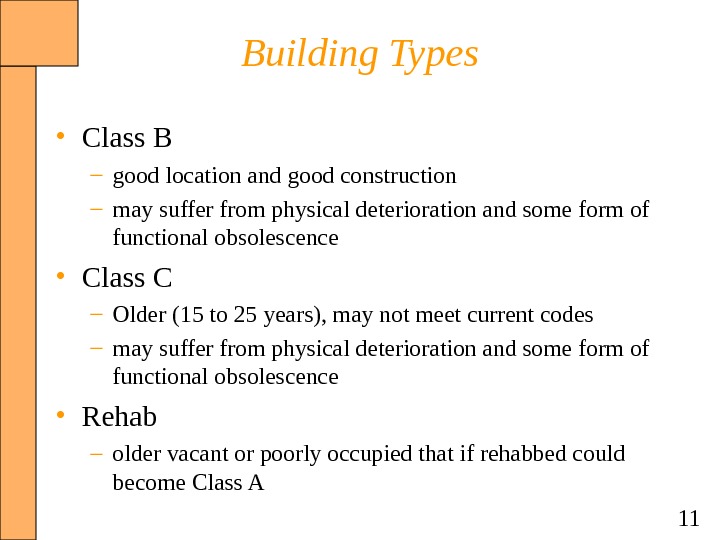
 11 Building Types • Class B – good location and good construction – may suffer from physical deterioration and some form of functional obsolescence • Class C – Older (15 to 25 years), may not meet current codes – may suffer from physical deterioration and some form of functional obsolescence • Rehab – older vacant or poorly occupied that if rehabbed could become Class
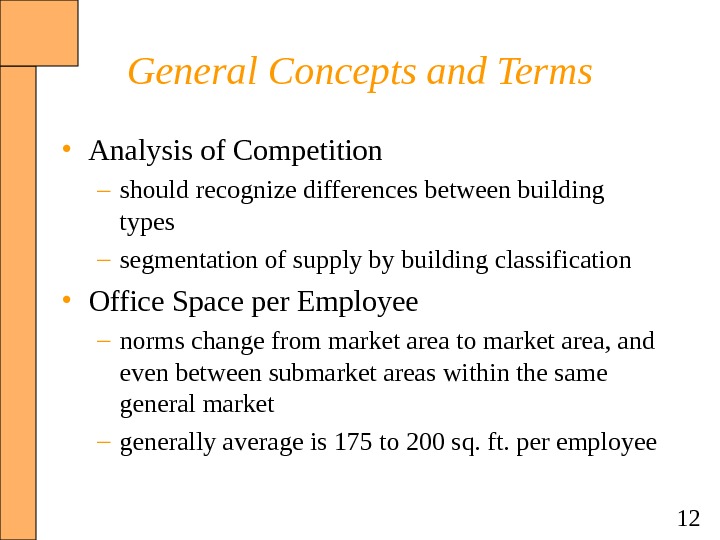
 12 General Concepts and Terms • Analysis of Competition – should recognize differences between building types – segmentation of supply by building classification • Office Space per Employee – norms change from market area to market area, and even between submarket areas within the same general market – generally average is 175 to 200 sq. ft. per employee
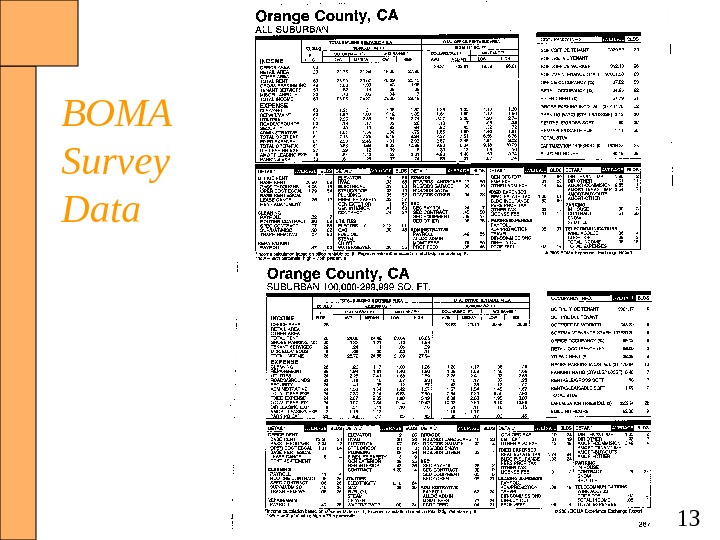
 13 BOMA Survey Data
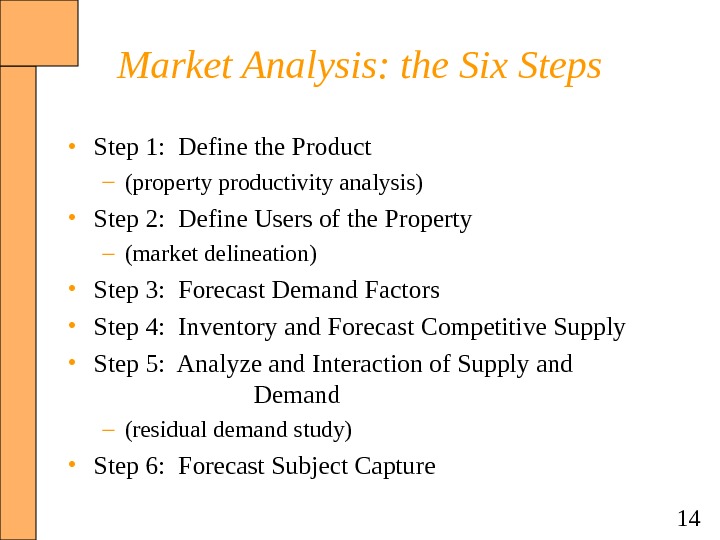
 14 Market Analysis: the Six Steps • Step 1: Define the Product – (property productivity analysis) • Step 2: Define Users of the Property – (market delineation) • Step 3: Forecast Demand Factors • Step 4: Inventory and Forecast Competitive Supply • Step 5: Analyze and Interaction of Supply and Demand – (residual demand study) • Step 6: Forecast Subject Capture
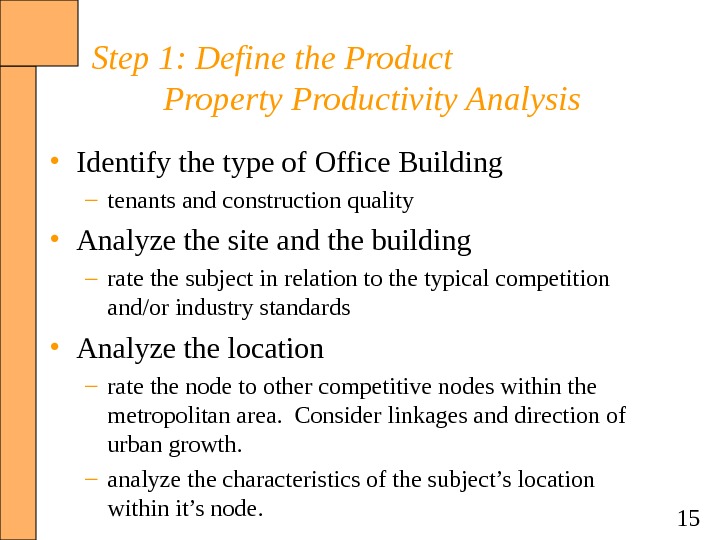
 15 Step 1: Define the Product Property Productivity Analysis • Identify the type of Office Building – tenants and construction quality • Analyze the site and the building – rate the subject in relation to the typical competition and/or industry standards • Analyze the location – rate the node to other competitive nodes within the metropolitan area. Consider linkages and direction of urban growth. – analyze the characteristics of the subject’s location within it’s node.
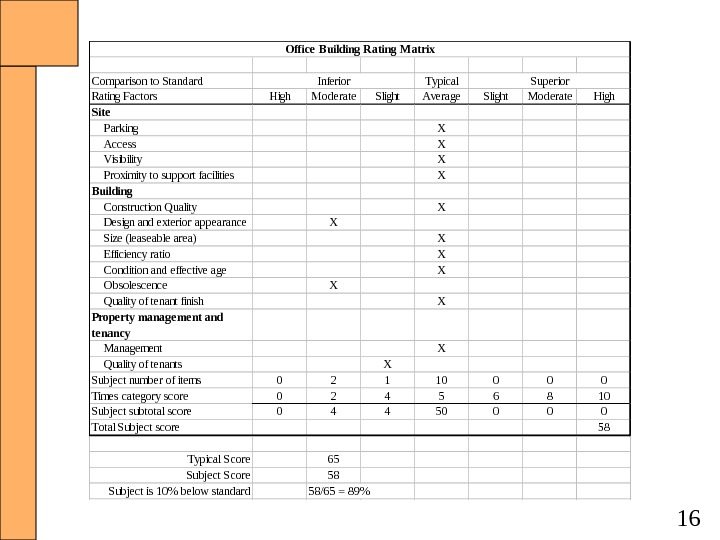
 16 Comparison to Standard Typical Rating Factors High Moderate Slight Average Slight Moderate High Site Parking X Access X Visibility X Proximity to support facilities X Building Construction Quality X Design and exterior appearance X Size (leaseable area) X Efficiency ratio X Condition and effective age X Obsolescence X Quality of tenant finish X Prope rty manage me nt and te nancy Management X Quality of tenants X Subject number of items 0 2 1 10 0 Times category score 0 2 4 5 6 8 10 Subject subtotal score 0 4 4 50 0 Total Subject score 58 Typical Score 65 Subject Score 58 Subject is 10% below standard 58/65 = 89% Inferior Superior. Office Building Rating M atrix
 17 Location Analysis • Often reflects its convenience to office workers, support facilities and executive housing areas • Office node where the subject property is located is analyzed for its linkages and position in the urban growth pattern – comparing subject’s node to competitive office nodes – direction and rate of urban growth
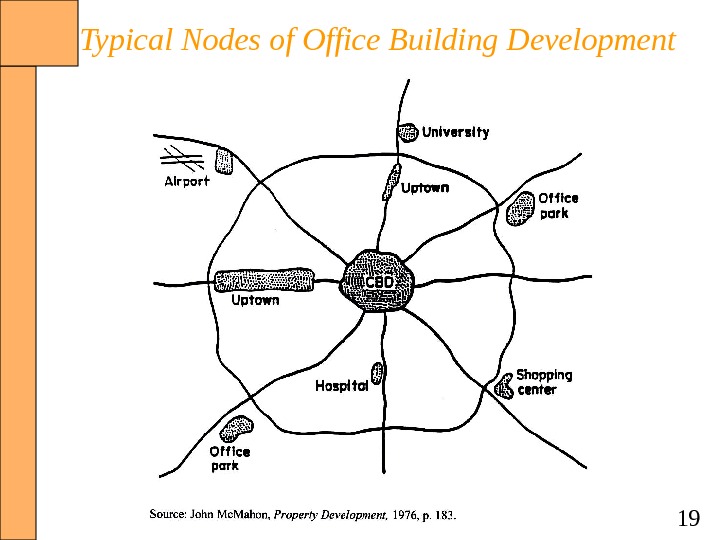
 18 Location Analysis • Identification of Office Nodes – Downtown (central business district) – Uptown • located along major arterial highways providing access to the suburbs – Shopping Centers – Office Parks • tend to be oriented toward manufacturing or research and development activity – Special Nodes • buildings serving attorneys, title companies and other uses often develop around major government buildings • Universities often provide a focal point for research and development and other office development
 19 Typical Nodes of Office Building Development
 20 Location Analysis • Identification of Node Linkages – Employee and Management Housing – Support facilities within the node • hotel, restaurants, health clubs, shopping, printing, etc. – Associated office uses • i. e. : attorneys and courthouses; doctors and hospitals – Traffic conditions – Proximity or travel time to airports – Proximity to mass transit – Proximity to interstate highways
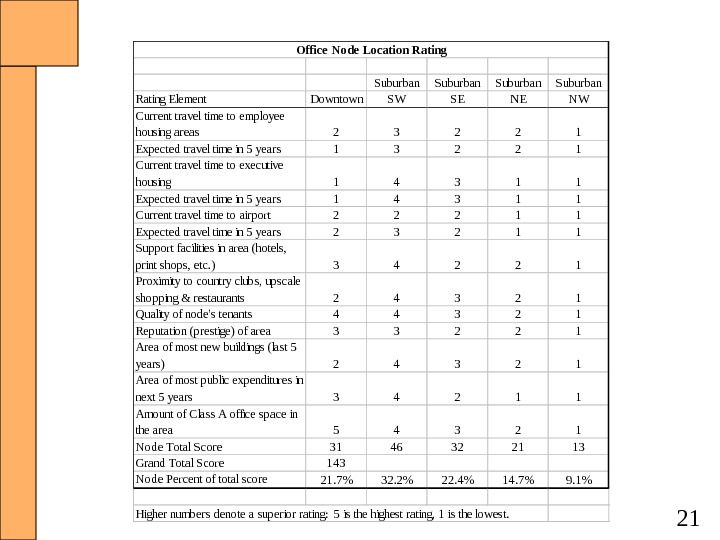
 21 Suburban Rating Element Downtown SW SE NE NW Current travel time to employee housing areas 2 3 2 2 1 Expected travel time in 5 years 1 3 2 2 1 Current travel time to executive housing 1 4 3 1 1 Expected travel time in 5 years 1 4 3 1 1 Current travel time to airport 2 2 2 1 1 Expected travel time in 5 years 2 3 2 1 1 Support facilities in area (hotels, print shops, etc. ) 3 4 2 2 1 Proximity to country clubs, upscale shopping & restaurants 2 4 3 2 1 Quality of node’s tenants 4 4 3 2 1 Reputation (prestige) of area 3 3 2 2 1 Area of most new buildings (last 5 years) 2 4 3 2 1 Area of most public expenditures in next 5 years 3 4 2 1 1 Amount of Class A office space in the area 5 4 3 2 1 Node Total Score 31 46 32 21 13 Grand Total Score 143 Node Percent of total score 21. 7% 32. 2% 22. 4% 14. 7% 9. 1% Higher numbers denote a superior rating: 5 is the highest rating, 1 is the lowest. Office Node Location Rating
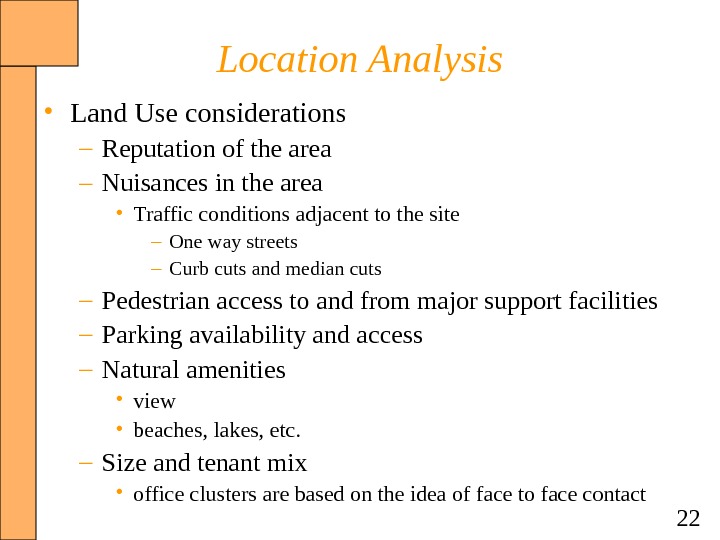
 22 Location Analysis • Land Use considerations – Reputation of the area – Nuisances in the area • Traffic conditions adjacent to the site – One way streets – Curb cuts and median cuts – Pedestrian access to and from major support facilities – Parking availability and access – Natural amenities • view • beaches, lakes, etc. – Size and tenant mix • office clusters are based on the idea of face to face contact
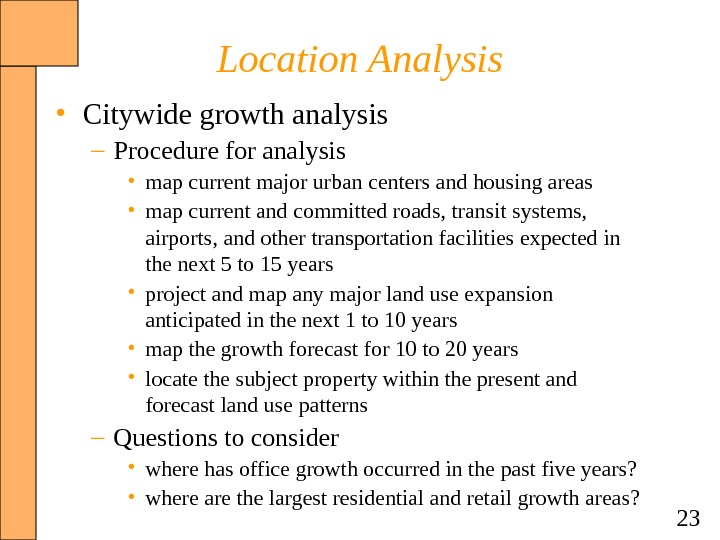
 23 Location Analysis • Citywide growth analysis – Procedure for analysis • map current major urban centers and housing areas • map current and committed roads, transit systems, airports, and other transportation facilities expected in the next 5 to 15 years • project and map any major land use expansion anticipated in the next 1 to 10 years • map the growth forecast for 10 to 20 years • locate the subject property within the present and forecast land use patterns – Questions to consider • where has office growth occurred in the past five years? • where are the largest residential and retail growth areas?
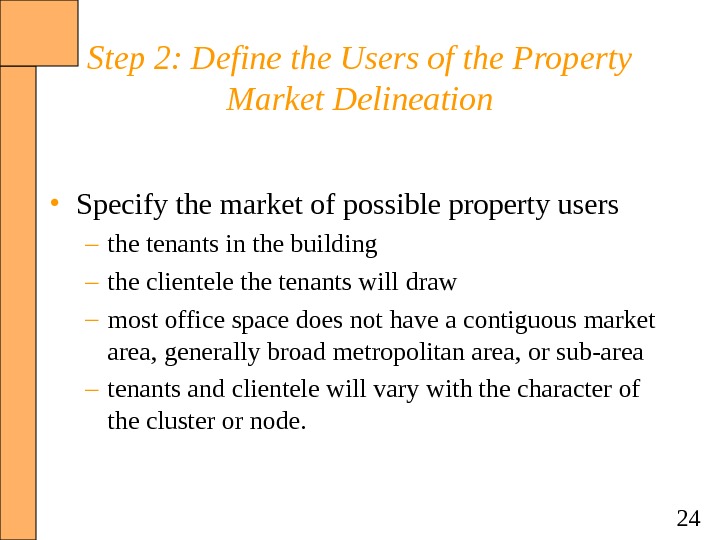
 24 Step 2: Define the Users of the Property Market Delineation • Specify the market of possible property users – the tenants in the building – the clientele the tenants will draw – most office space does not have a contiguous market area, generally broad metropolitan area, or sub-area – tenants and clientele will vary with the character of the cluster or node.
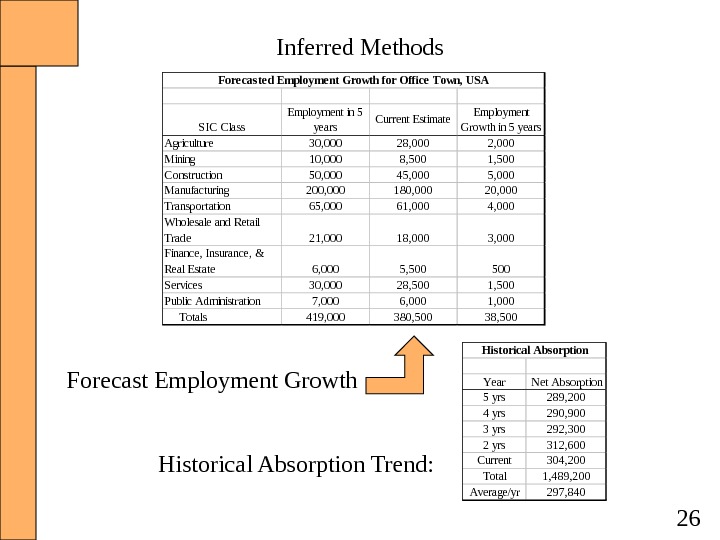
 25 Step 3: Forecast Demand Factors • Inferred (trend) methods – general employment growth (decline) trends – general secondary data that reports total market occupancy and absorption – general trends in rents and/or sales • Fundamental methods – Forecast work force occupying office space – Estimate the size of the work force occupying space in the subject’s class of office building – Estimate the requisite space per office worker – Calculate demand for the specific class of office space
 26 Inferred Methods Year Net Absorption 5 yrs 289, 200 4 yrs 290, 900 3 yrs 292, 300 2 yrs 312, 600 Current 304, 200 Total 1, 489, 200 Average/yr 297, 840 His torical Abs orption Historical Absorption Trend: Forecast Employment Growth SIC Class Employment in 5 years Current Estimate Employment Growth in 5 years Agriculture 30, 000 28, 000 2, 000 Mining 10, 000 8, 500 1, 500 Construction 50, 000 45, 000 Manufacturing 200, 000 180, 000 20, 000 Transportation 65, 000 61, 000 4, 000 Wholesale and Retail Trade 21, 000 18, 000 3, 000 Finance, Insurance, & Real Estate 6, 000 5, 500 Services 30, 000 28, 500 1, 500 Public Administration 7, 000 6, 000 1, 000 Totals 419, 000 380, 500 38, 500 Fore caste d Employme nt Growth for Office Town, US
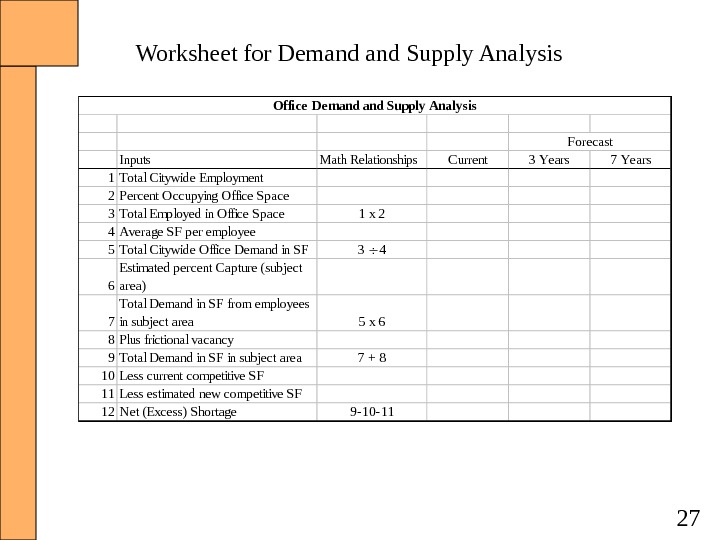
 27 Inputs. Math Relationships. Current 3 Years 7 Years 1 Total Citywide Employment 2 Percent Occupying Office Space 3 Total Employed in Office Space 1 x 2 4 Average SF per employee 5 Total Citywide Office Demand in SF 3 ¸ 4 6 Estimated percent Capture (subject area) 7 Total Demand in SF from employees in subject area 5 x 6 8 Plus frictional vacancy 9 Total Demand in SF in subject area 7 + 8 10 Less current competitive SF 11 Less estimated new competitive SF 12 Net (Excess) Shortage 9 -10 -11 Forecast Office De mand Supply Analysis. Worksheet for Demand Supply Analysis
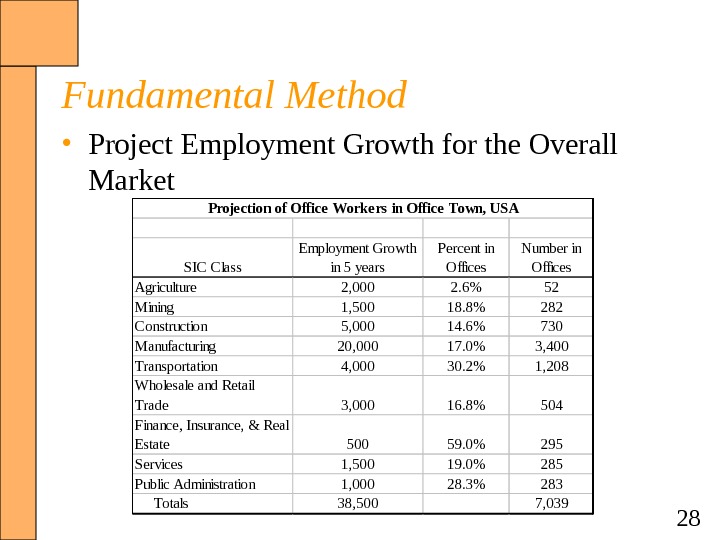
 28 Fundamental Method • Project Employment Growth for the Overall Market SIC Class Employment Growth in 5 years Percent in Offices Number in Offices Agriculture 2, 000 2. 6% 52 Mining 1, 500 18. 8% 282 Construction 5, 000 14. 6% 730 Manufacturing 20, 000 17. 0% 3, 400 Transportation 4, 000 30. 2% 1, 208 Wholesale and Retail Trade 3, 000 16. 8% 504 Finance, Insurance, & Real Estate 500 59. 0% 295 Services 1, 500 19. 0% 285 Public Administration 1, 000 28. 3% 283 Totals 38, 500 7, 039 Proje ction of Office Worke rs in Office Town, US
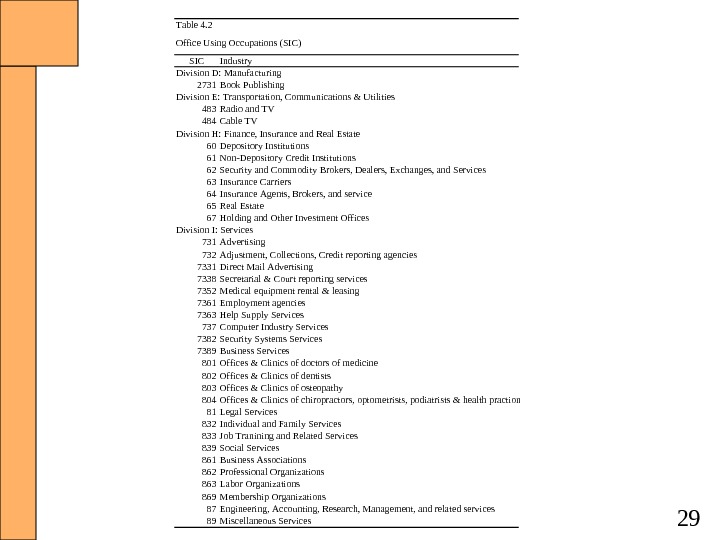
 29 Table 4. 2 SIC Industry Division D: Manufacturing 2731 Book Publishing Division E: Transportation, Communications & Utilities 483 Radio and TV 484 Cable TV Division H: Finance, Insurance and Real Estate 60 Depository Institutions 61 Non-Depository Credit Institutions 62 Security and Commodity Brokers, Dealers, Exchanges, and Services 63 Insurance Carriers 64 Insurance Agents, Brokers, and service 65 Real Estate 67 Holding and Other Investment Offices Division I: Services 731 Advertising 732 Adjustment, Collections, Credit reporting agencies 7331 Direct Mail Advertising 7338 Secretarial & Court reporting services 7352 Medical equipment rental & leasing 7361 Employment agencies 7363 Help Supply Services 737 Computer Industry Services 7382 Security Systems Services 7389 Business Services 801 Offices & Clinics of doctors of medicine 802 Offices & Clinics of dentists 803 Offices & Clinics of osteopathy 804 Offices & Clinics of chiropractors, optometrists, podiatrists & health practioners 81 Legal Services 832 Individual and Family Services 833 Job Tranining and Related Services 839 Social Services 861 Business Associations 862 Professional Organizations 863 Labor Organizations 869 Membership Organizations 87 Engineering, Accounting, Research, Management, and related services 89 Miscellaneous Services. Office Using Occupations (SIC)
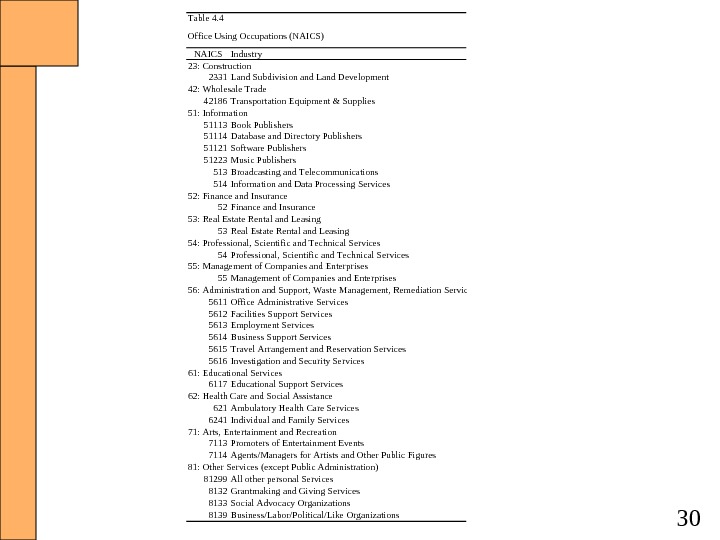
 30 Table 4. 4 NAICS Industry 23: Construction 2331 Land Subdivision and Land Development 42: Wholesale Trade 42186 Transportation Equipment & Supplies 51: Information 51113 Book Publishers 51114 Database and Directory Publishers 51121 Software Publishers 51223 Music Publishers 513 Broadcasting and Telecommunications 514 Information and Data Processing Services 52: Finance and Insurance 52 Finance and Insurance 53: Real Estate Rental and Leasing 53 Real Estate Rental and Leasing 54: Professional, Scientific and Technical Services 54 Professional, Scientific and Technical Services 55: Management of Companies and Enterprises 55 Management of Companies and Enterprises 56: Administration and Support, Waste Management, Remediation Services 5611 Office Administrative Services 5612 Facilities Support Services 5613 Employment Services 5614 Business Support Services 5615 Travel Arrangement and Reservation Services 5616 Investigation and Security Services 61: Educational Services 6117 Educational Support Services 62: Health Care and Social Assistance 621 Ambulatory Health Care Services 6241 Individual and Family Services 71: Arts, Entertainment and Recreation 7113 Promoters of Entertainment Events 7114 Agents/Managers for Artists and Other Public Figures 81: Other Services (except Public Administration) 81299 All other personal Services 8132 Grantmaking and Giving Services 8133 Social Advocacy Organizations 8139 Business/Labor/Political/Like Organizations. Office Using Occupations (NAICS)
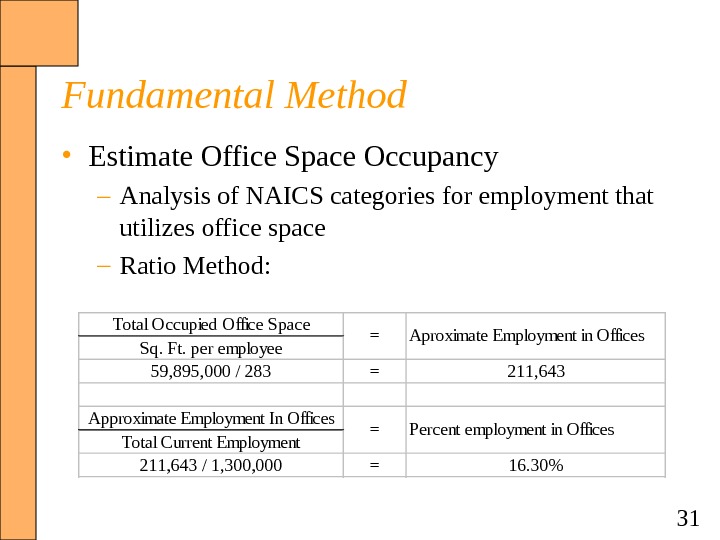
 31 Fundamental Method • Estimate Office Space Occupancy – Analysis of NAICS categories for employment that utilizes office space – Ratio Method: Total Occupied Office Space Sq. Ft. per employee 59, 895, 000 / 283 = 211, 643 Approximate Employment In Offices Total Current Employment 211, 643 / 1, 300, 000 = 16. 30%Aproximate Employment in Offices= = Percent employment in Offices
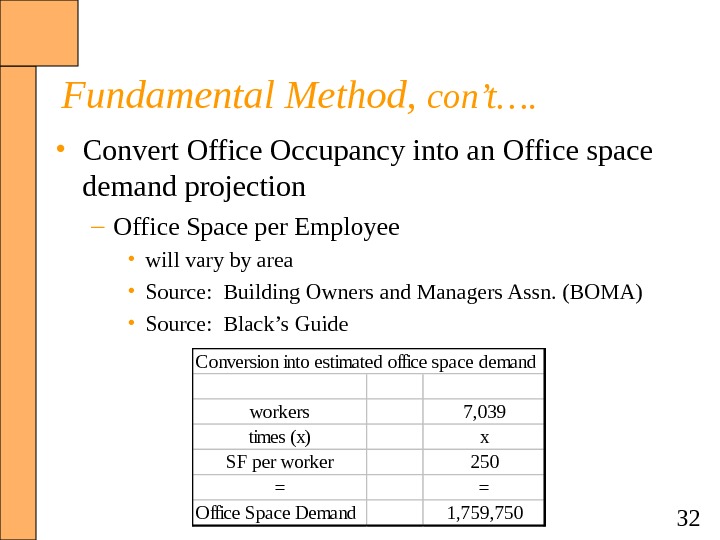
 32 Fundamental Method, con’t…. • Convert Office Occupancy into an Office space demand projection – Office Space per Employee • will vary by area • Source: Building Owners and Managers Assn. (BOMA) • Source: Black’s Guide Conversion into estimated office space demand workers 7, 039 times (x) x SF per worker 250 = = Office Space Demand 1, 759,
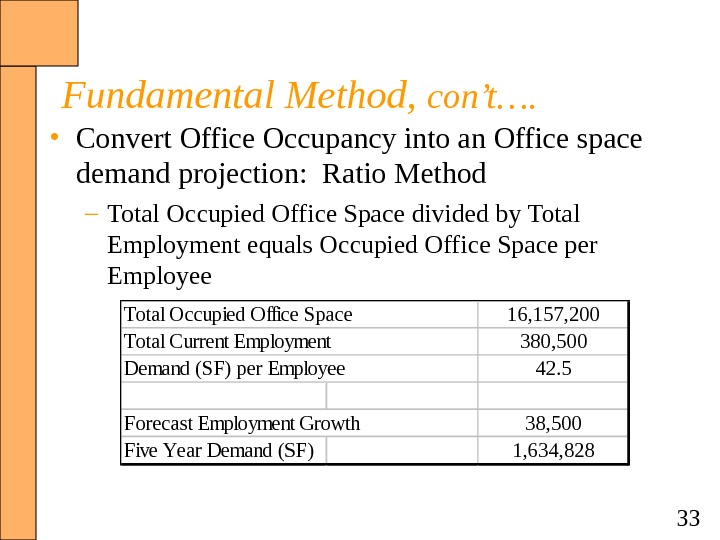
 33 Fundamental Method, con’t…. • Convert Office Occupancy into an Office space demand projection: Ratio Method – Total Occupied Office Space divided by Total Employment equals Occupied Office Space per Employee. Total Occupied Office Space 16, 157, 200 Total Current Employment 380, 500 Demand (SF) per Employee 42. 5 Forecast Employment Growth 38, 500 Five Year Demand (SF)1, 634,
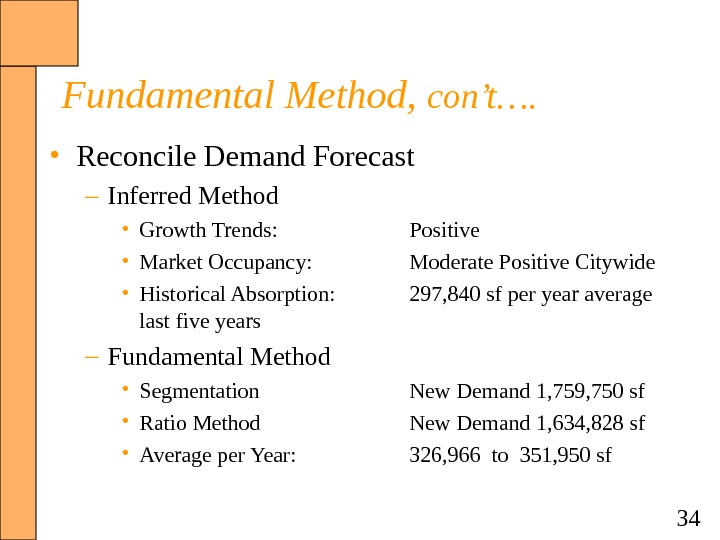
 34 Fundamental Method, con’t…. • Reconcile Demand Forecast – Inferred Method • Growth Trends: Positive • Market Occupancy: Moderate Positive Citywide • Historical Absorption: 297, 840 sf per year average last five years – Fundamental Method • Segmentation New Demand 1, 759, 750 sf • Ratio Method New Demand 1, 634, 828 sf • Average per Year: 326, 966 to 351, 950 sf
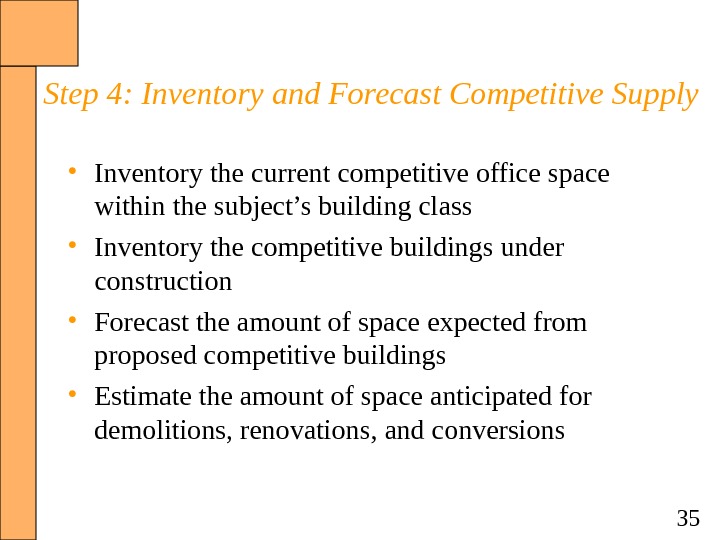
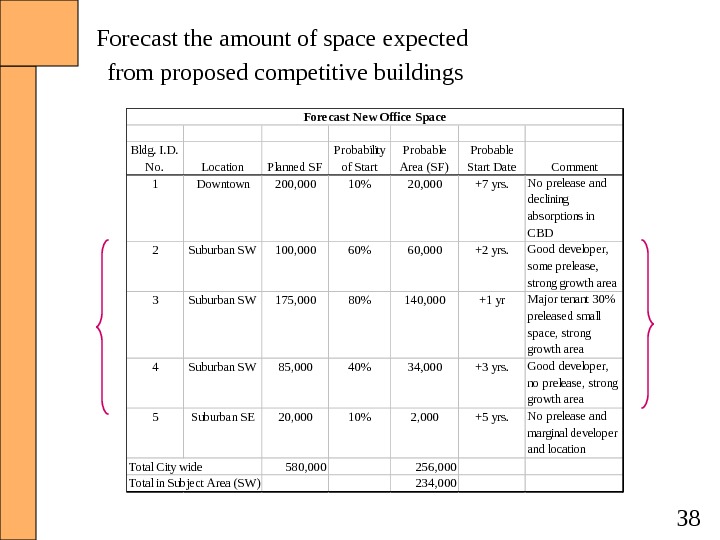
 35 Step 4: Inventory and Forecast Competitive Supply • Inventory the current competitive office space within the subject’s building class • Inventory the competitive buildings under construction • Forecast the amount of space expected from proposed competitive buildings • Estimate the amount of space anticipated for demolitions, renovations, and conversions
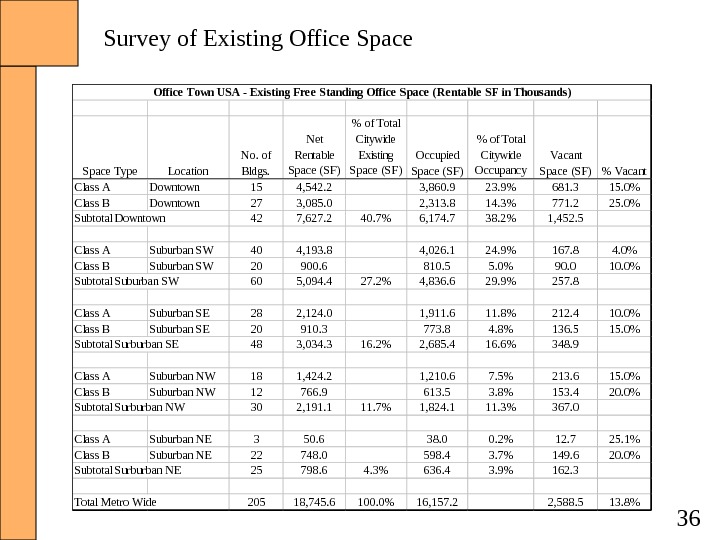
 36 Space Type Location No. of Bldgs. Net Rentable Space (SF) % of Total Citywide Existing Space (SF) Occupied Space (SF) % of Total Citywide Occupancy Vacant Space (SF) % Vacant Class A Downtown 15 4, 542. 2 3, 860. 9 23. 9% 681. 3 15. 0% Class B Downtown 27 3, 085. 0 2, 313. 8 14. 3% 771. 2 25. 0% Subtotal Downtown 42 7, 627. 2 40. 7% 6, 174. 7 38. 2% 1, 452. 5 Class A Suburban SW 40 4, 193. 8 4, 026. 1 24. 9% 167. 8 4. 0% Class B Suburban SW 20 900. 6 810. 5 5. 0% 90. 0 10. 0% Subtotal Suburban SW 60 5, 094. 4 27. 2% 4, 836. 6 29. 9% 257. 8 Class A Suburban SE 28 2, 124. 0 1, 911. 6 11. 8% 212. 4 10. 0% Class B Suburban SE 20 910. 3 773. 8 4. 8% 136. 5 15. 0% Subtotal Surburban SE 48 3, 034. 3 16. 2% 2, 685. 4 16. 6% 348. 9 Class A Suburban NW 18 1, 424. 2 1, 210. 6 7. 5% 213. 6 15. 0% Class B Suburban NW 12 766. 9 613. 5 3. 8% 153. 4 20. 0% Subtotal Surburban NW 30 2, 191. 1 11. 7% 1, 824. 1 11. 3% 367. 0 Class A Suburban NE 3 50. 6 38. 0 0. 2% 12. 7 25. 1% Class B Suburban NE 22 748. 0 598. 4 3. 7% 149. 6 20. 0% Subtotal Surburban NE 25 798. 6 4. 3% 636. 4 3. 9% 162. 3 Total Metro Wide 205 18, 745. 6 100. 0% 16, 157. 2 2, 588. 5 13. 8%Office Town USA — Existing Fre e Standing Office Space (Re ntable SF in Thous ands )Survey of Existing Office Space
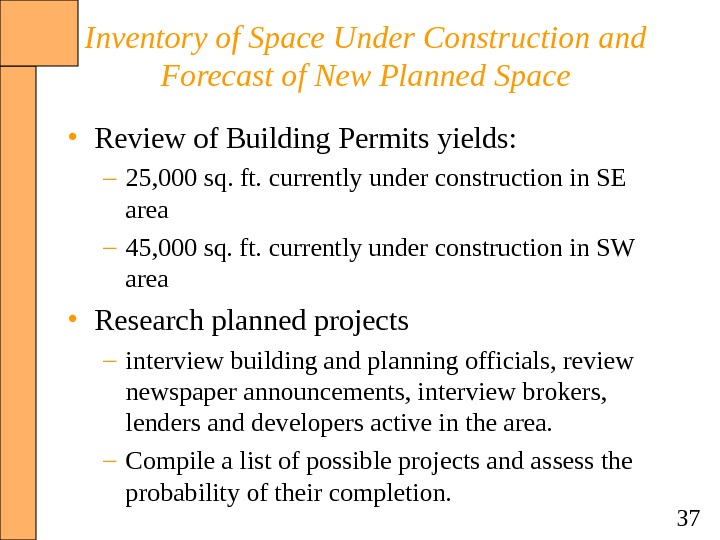
 37 Inventory of Space Under Construction and Forecast of New Planned Space • Review of Building Permits yields: – 25, 000 sq. ft. currently under construction in SE area – 45, 000 sq. ft. currently under construction in SW area • Research planned projects – interview building and planning officials, review newspaper announcements, interview brokers, lenders and developers active in the area. – Compile a list of possible projects and assess the probability of their completion.
 38 Bldg. I. D. No. Location Planned SF Probability of Start Probable Area (SF) Probable Start Date Comment 1 Downtown 200, 000 10% 20, 000 +7 yrs. No prelease and declining absorptions in CBD 2 Suburban SW 100, 000 60% 60, 000 +2 yrs. Good developer, some prelease, strong growth area 3 Suburban SW 175, 000 80% 140, 000 +1 yr Major tenant 30% preleased small space, strong growth area 4 Suburban SW 85, 000 40% 34, 000 +3 yrs. Good developer, no prelease, strong growth area 5 Suburban SE 20, 000 10% 2, 000 +5 yrs. No prelease and marginal developer and location Total City wide 580, 000 256, 000 Total in Subject Area (SW) 234, 000 Fore cas t Ne w Office Space. Forecast the amount of space expected from proposed competitive buildings
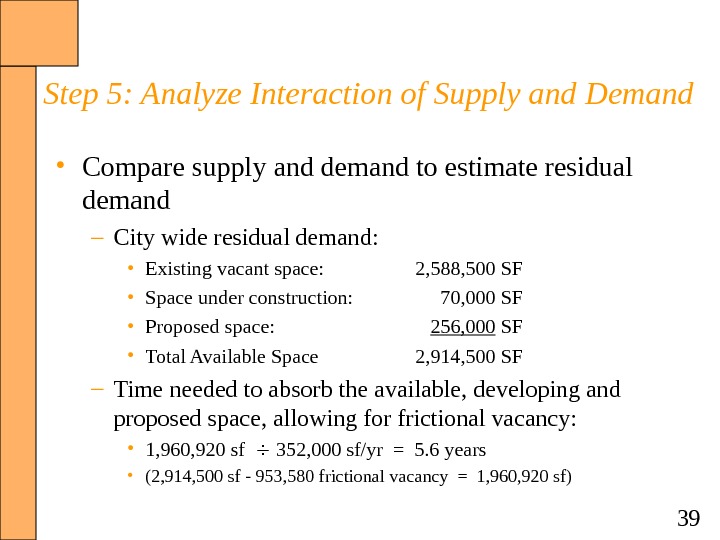
 39 Step 5: Analyze Interaction of Supply and Demand • Compare supply and demand to estimate residual demand – City wide residual demand: • Existing vacant space: 2, 588, 500 SF • Space under construction: 70, 000 SF • Proposed space: 256, 000 SF • Total Available Space 2, 914, 500 SF – Time needed to absorb the available, developing and proposed space, allowing for frictional vacancy: • 1, 960, 920 sf ¸ 352, 000 sf/yr = 5. 6 years • (2, 914, 500 sf — 953, 580 frictional vacancy = 1, 960, 920 sf)
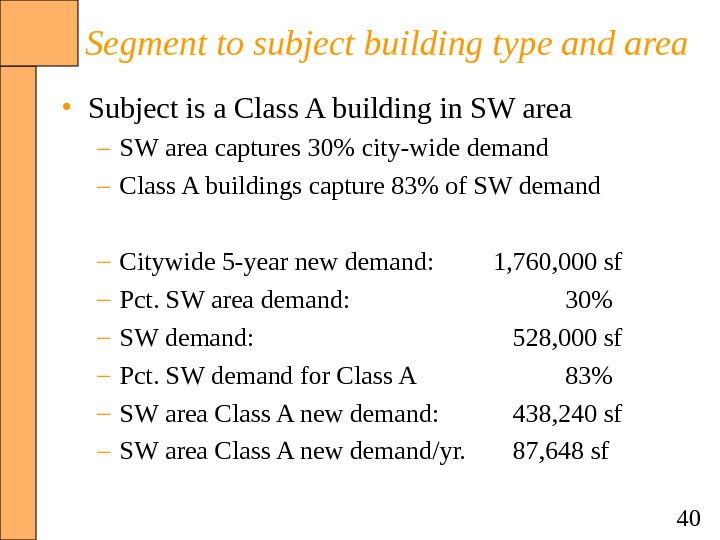
 40 Segment to subject building type and area • Subject is a Class A building in SW area – SW area captures 30% city-wide demand – Class A buildings capture 83% of SW demand – Citywide 5 -year new demand: 1, 760, 000 sf – Pct. SW area demand: 30% – SW demand: 528, 000 sf – Pct. SW demand for Class A 83% – SW area Class A new demand: 438, 240 sf – SW area Class A new demand/yr. 87, 648 sf
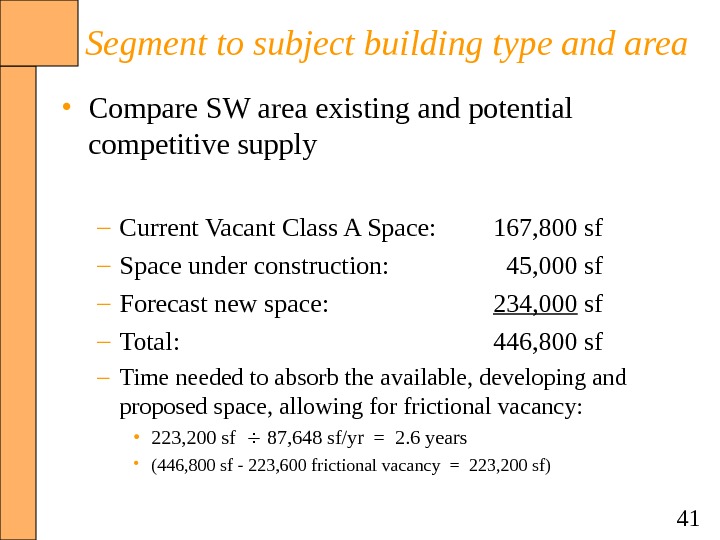
 41 Segment to subject building type and area • Compare SW area existing and potential competitive supply – Current Vacant Class A Space: 167, 800 sf – Space under construction: 45, 000 sf – Forecast new space: 234, 000 sf – Total: 446, 800 sf – Time needed to absorb the available, developing and proposed space, allowing for frictional vacancy: • 223, 200 sf ¸ 87, 648 sf/yr = 2. 6 years • (446, 800 sf — 223, 600 frictional vacancy = 223, 200 sf)
 42 Step 6: Forecast Subject Capture • Inferred methods • analyze the subject’s competitiveness in view of the overall market forecast • Subject’s current occupancy is 85%, consistent with metro area occupancy of 86%, however SW area vacancy is only 4%. • Building rating table indicates that subject building is 10% below average, due to design deficiencies. • Fundamental methods • analyze specific submarket competition; rate the subject against competitive properties • make an inventory of all buildings in the competitive area that correspond to the area of the forecast data • compile a list of the elements to be rated
 43 Step 6: Forecast Subject Capture • Reconciliation – Subject is 85% occupied – Absorption of vacant space is forecast to take about 3 years before the submarket shows excess demand. – Rating analysis suggests that subject is 10% inferior to the market – Forecast is that subject occupancy and rents will lag the market
 44 So That’s — — — Market Analysis for Office Buildings Wayne Foss, DBA, MAI, CRE, FRICS Fullerton, CA USA Email: waynefoss@usa. net

