

5b829a55981dfced0a87d54dc6fe967a.ppt
- Количество слайдов: 20
 MARK 7397 Spring 2007 Customer Relationship Management: A Database Approach Class 6 James D. Hess C. T. Bauer Professor of Marketing Science 375 H Melcher Hall jhess@uh. edu 713 743 -4175
 Past Customer Value • Computation of Customer Profitability • Past Customer Value of a customer Where i = number representing the customer, r = applicable discount rate n = number of time periods prior to current period when purchase was made GCin = Gross Contribution of transaction of the ith customer in the nth time period • Since products/services are bought at different points in time during the customer’s lifetime, all transactions have to be adjusted for the time value of money • Limitations: Does not consider whether a customer is going to be active in the future. Also does not incorporate the expected cost of maintaining the customer in the future
 Spending Pattern of a Customer Jan $ Amount GC Feb 800 50 240 March 15 April May 50 30 20 15 9 6 ´ Gross Contribution (GC) = Purchase Amount X 0. 3 Past Customer Value Scoring = 6(1 + 0. 0125 ) + 9(1 + 0. 0125 ) 2+ 3 15 (1 + 0. 0125 ) + 15 (1 + 0. 0125 ) 4 + 240 (1 + 0. 0125 ) 5 = 302. 01486 The above customer is worth $302. 01 in contribution margin, expressed in net present value in May dollars. By comparing this score among a set of customers a prioritization is arrived at for directing future marketing efforts
 • Multi-period evaluation of a customer’s value") Lifetime Value metrics (Net Present Value models) • Multi-period evaluation of a customer’s value to the firm Recurring Revenues Recurring costs Contribution margin Lifetime of a customer Lifetime Profit LTV Discount rate Acquisition cost
Lifetime Value metrics (Net Present Value models) • Multi-period evaluation of a customer’s value to the firm Recurring Revenues Recurring costs Contribution margin Lifetime of a customer Lifetime Profit LTV Discount rate Acquisition cost
 Calculation of Lifetime Value: Simple Definition T æ Rr ö = å CM t ç ÷ LTV è 1+ ø t =1 CM 2 t Rrt 1/(1+ )t 0 where LTV = lifetime value of an individual customer in $, CM = contribution margin, = interest rate, Rr = retention rate, so Rrt=survival rate for t periods • • LTV is a measure of a single customer’s worth to the firm Used for pedagogical and conceptual purposes
 LTV: Definition Accounting for Acquisition Cost and Retention Probabilities Note: many typos on page 127 T LTV = å t =1 t t æ ö æ 1 ö ç Õ Rr ÷CM it ç ÷ - AC ç ÷ k è 1+ d ø è k=1 ø Where, LTV = lifetime value of an individual customer in $ Rrk = retention rate П = Product of retention rates for each time period from 1 to T, AC = acquisition cost T = total time horizon under consideration Assuming that T and that the contribution margin CM does not vary over time, LTV i = CMi Rr - AC 1 - Rr + d
 To Calculate Customer Lifetime Value 1. You must be able to forecast profit contributions 2. You must understand the cost of marketing 3. You must be able to forecast retention rates of customers (since if the customer has abandoned the firm no profits will flow. ) 4. It is possible that customers will “churn. ” That is, they may leave and then return later. 5. The contribution of a customer may be causally tied to churn and abandonment, making this trickier than it looks. 6. You need to understand NPV calculations.
 LTV: Definition Accounting for Varying Levels of Contribution Margin Where, LTV = lifetime value of an individual customer i in $, S = Sales to customer i, DC = direct cost of products purchased by customer i, MC = marketing cost of customer i
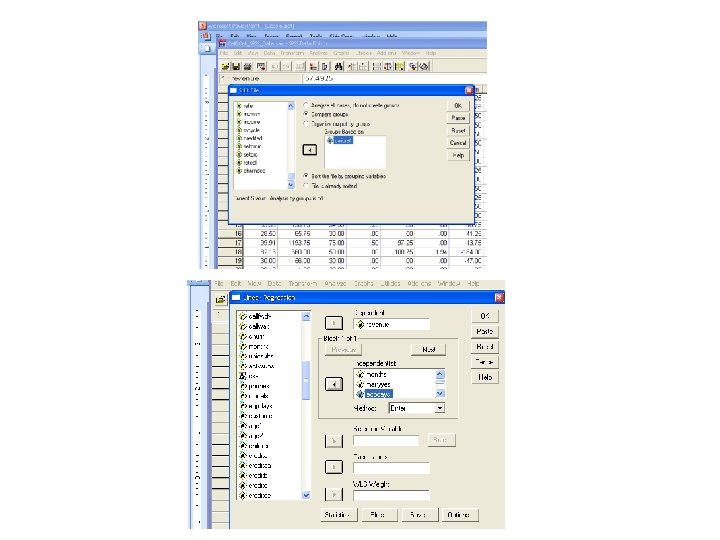
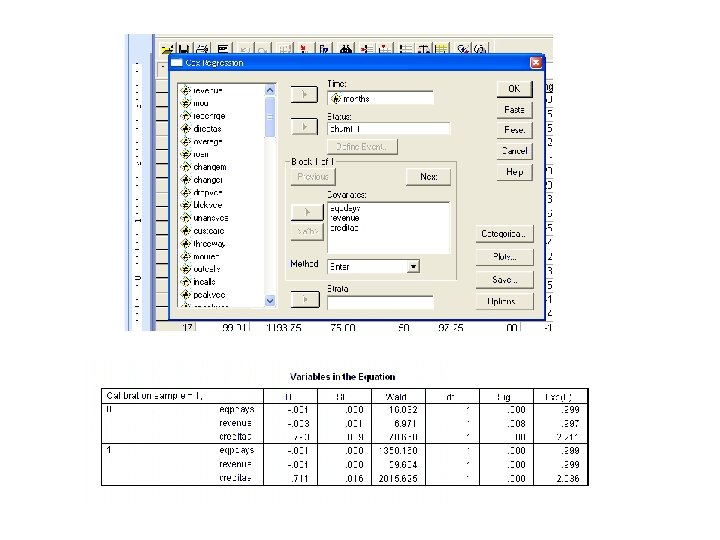
 Recall the Cell 2 Cell data from last week
*Contrib. Rate") CMi=(67. 58+. 595*Monthsi-7. 615*Marriedi-. 046*Eqp. Daysi)*Contrib. Rate
CMi=(67. 58+. 595*Monthsi-7. 615*Marriedi-. 046*Eqp. Daysi)*Contrib. Rate


 Abandonment versus Churn: Lost for Good or Missing in Action States of Customer: S 0 = bought this period S-1 = last bought one period before State Transition (Markov Matrix) Before S 0 S-1 S 0 0. 7 S-1 0. 3 Lost for Good 0. 0 =T After 1. 0 Pt=(Pt, 0, 1 -Pt, 0)’ Probability that at time t you are in the two states
 Before S 0 S-1 After S 0 0. 7 0.") Abandonment versus Churn (continued) Before S 0 S-1 After S 0 0. 7 0. 0 S-1 0. 3 1. 0 Pt= T Pt-1 = T T Pt-2 = T T …T P 0 Tk = 0. 7 k 0. 0 1 -0. 7 k 1. 0 This is the type of calculation we did above with a retention rate of 70%. However, once gone the customer never returns.
Abandonment versus Churn (continued) Before S 0 S-1 After S 0 0. 7 0. 0 S-1 0. 3 1. 0 Pt= T Pt-1 = T T Pt-2 = T T …T P 0 Tk = 0. 7 k 0. 0 1 -0. 7 k 1. 0 This is the type of calculation we did above with a retention rate of 70%. However, once gone the customer never returns.
 Abandonment versus Churn: just “Missing in Action” Before S 0 S-2 S 0 0. 7 0. 1 0. 0 S-1 0. 3 0. 0 S-2 After S-1 0. 0 0. 9 1. 0 If you haven’t bought in two periods, you are gone, but you could appear and disappear from one period to the next.
 Abandonment versus Churn: just “Missing in Action”. 52. 21 . 03 0. 0 0. 9 1. 0 . 38 T 3 = 0. 0 . 27 T 2 = . 07 . 05 0. 0 . 16 . 02 0. 0 . 48 . 93 1. 0
