
Managerial economics Teacher: Kotlik Andrey Valeriyevich Management


- Размер: 249.5 Кб
- Количество слайдов: 32
Описание презентации Managerial economics Teacher: Kotlik Andrey Valeriyevich Management по слайдам
Managerial economics Teacher: Kotlik Andrey Valeriyevich Management and business department
Modeling in Managerial Economics 1. Types of models in Managerial Economics 2. Graphical models in Managerial Economics 3. Mathematical and economic models in Managerial Economics
Types of models in Managerial Economics Modeling in management helps to: • take into account main factors influencing problem • take into account previous experience in the area of problem • to get a right decision by using modern mathematical methods • provide a visibility of the problem • Etc.
Types of models in Managerial Economics Model is a simplified imagination of a modeling object, which adequately reflects it ’ s properties , most significant in terms of modeling
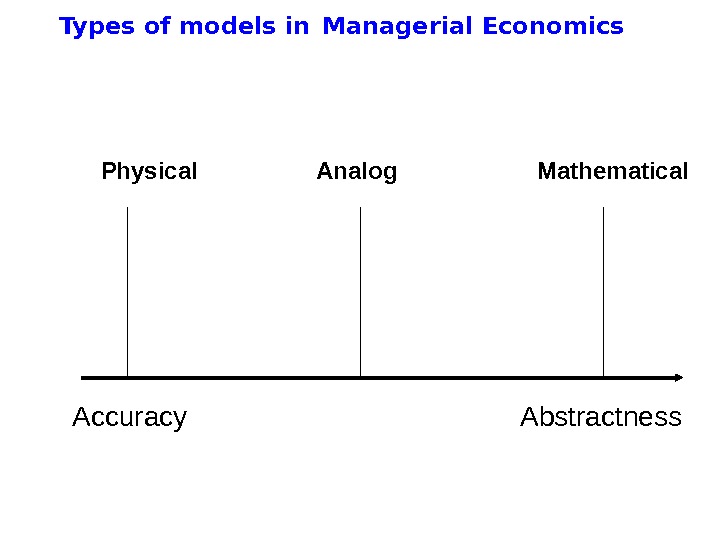
Types of models in Managerial Economics Accuracy Abstractness. Physical Analog Mathematical
Types of models in Managerial Economics Physical — a model that is a physical object which is a reduced or enlarged copy of the original, such as model airplane;
Types of models in Managerial Economics Analog — a model with the original properties, but that differ s significantly from it in appearance, such as a map, chart organizational structure, a graph between certain values, the scheme of the algorithm to perform a function. An important type of analog is a game model that allow to understand the possible way of development of real events and to train staff to operate effectively and interact in similar situations by organizing games, such as military exercises, management games
Types of models in Managerial Economics Mathematic al — a model that uses mathematical symbols and methods to describe the characteristics of the object, such as the formula for calculating revenue from sales through the sales revenue and cost of sales.
Graphical models in Managerial Economics The most frequently used graphical models in Managerial Economics are: • Graphs and diagrams; • Gantt graph; • Block chart; • Process diagrams; • PERT chart
Graphical models in Managerial Economics Graphs and diagrams are used to illustrate: • Relation between economic indicators; • Tendencies in development of economic objects, phenomena; • Probability distribution; • Structure of an object • Etc
Graphical models in Managerial Economics Gantt graphs are used to illustrate a project schedule to plan and control its performance. Elements of a chart create work breakdown structure (WBS) that is a deliverable oriented decomposition of a project into smaller components WBS should contain all elements of a project, but each element should be exclusive
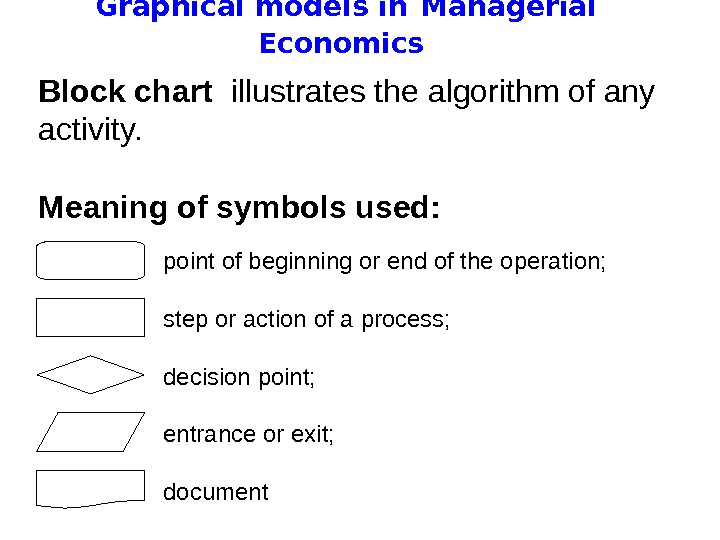
Graphical models in Managerial Economics Block chart illustrates the algorithm of any activity. Meaning of symbols used: point of beginning or end of the operation; step or action of a process; decision point; entrance or exit; document
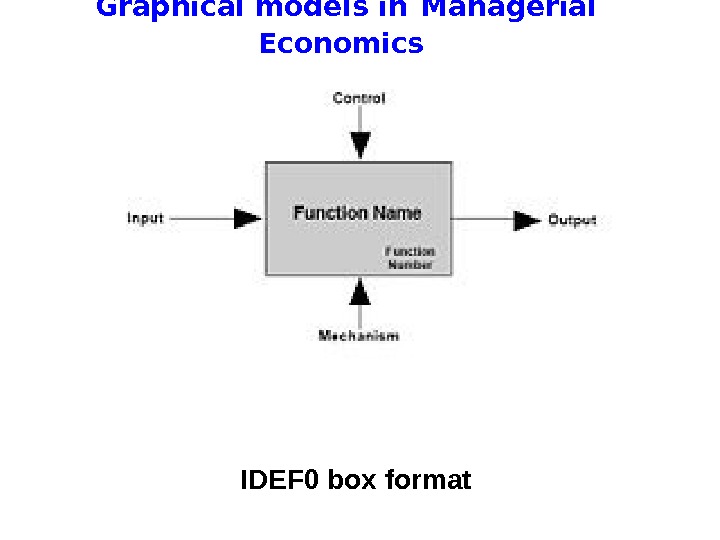
Graphical models in Managerial Economics Process diagram shows a structure of a process as a sequence of activities and flows of materials (information) between them. Process diagrams can be built according to several standards: • IDEF 0 • IDEF 3 • ARIS • BPMN • UML and so on
Graphical models in Managerial Economics IDEF 0 box format
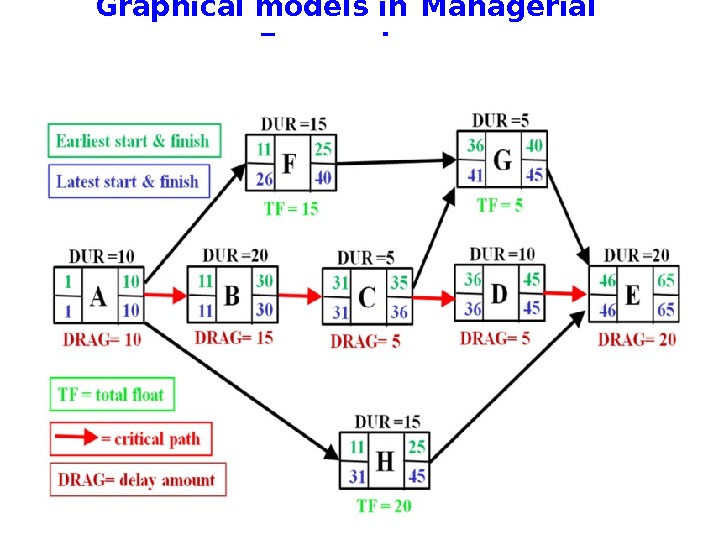
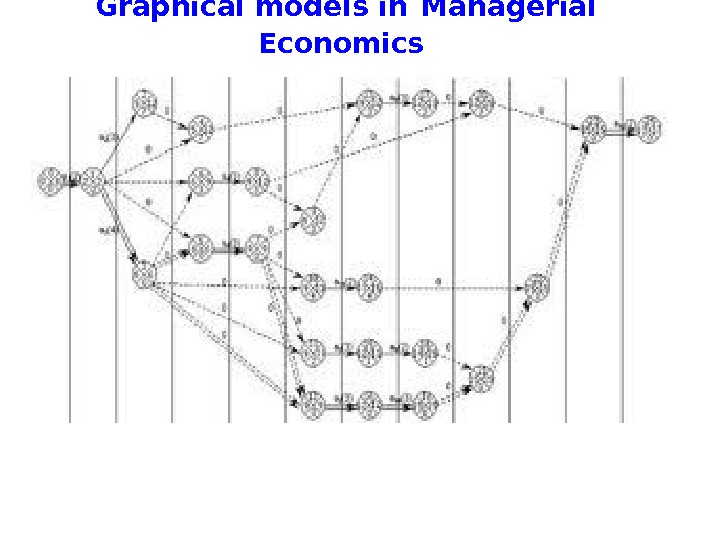
Graphical models in Managerial Economics The Program (or Project ) Evaluation and Review Technique ( PERT ) is a statistical tool, that is designed to analyze and represent the tasks involved in completing a given project.
Graphical models in Managerial Economics To create a project model it is necessary to use: • A list of all activities required to complete the project ( WBS ), • Events that are milestones between activities • The time (duration) that each activity will take to completion, • The dependencies between the activities
Graphical models in Managerial Economics Main PERT terms • PERT event : a point that marks the start or completion of one or more activities. It consumes no time and uses no resources. When it marks the completion of one or more tasks, it is not “reached” (does not occur) until all of the activities leading to that event have been completed. • predecessor event : an event that immediately precedes some other event without any other events intervening. An event can have multiple predecessor events and can be the predecessor of multiple events. • successor event : an event that immediately follows some other event without any other intervening events. An event can have multiple successor events and can be the successor of multiple events.
Graphical models in Managerial Economics Main PERT terms • PERT activity : the actual performance of a task which consumes time and requires resources (such as labor, materials, space, machinery). It can be understood as representing the time, effort, and resources required to move from one event to another. A PERT activity cannot be performed until the predecessor event has occurred.
Graphical models in Managerial Economics Main PERT terms • optimistic time (O): the minimum possible time required to accomplish a task, assuming everything proceeds better than is normally expected • pessimistic time (P): the maximum possible time required to accomplish a task, assuming everything goes wrong (but excluding major catastrophes).
Graphical models in Managerial Economics Main PERT terms • most likely time (M): the best estimate of the time required to accomplish a task, assuming everything proceeds as normal. • expected time (TE): the best estimate of the time required to accomplish a task, accounting for the fact that things don’t always proceed as normal (the implication being that the expected time is the average time the task would require if the task were repeated on a number of occasions over an extended period of time). TE = ( O + 4 M + P ) ÷
Graphical models in Managerial Economics Main PERT terms • Float (slack) is a measure of the excess time and resources available to complete a task. It is the amount of time that a project task can be delayed without causing a delay in any subsequent tasks ( free float ) or the whole project ( total float ). Positive slack would indicate ahead of schedule ; negative slack would indicate behind schedule ; and zero slack would indicate on schedule. • Critical path : the longest possible continuous pathway taken from the initial event to the terminal event. It determines the total calendar time required for the project; and, therefore, any time delays along the critical path will delay the reaching of the terminal event by at least the same amount. • Critical activity : An activity that has total float equal to zero. An activity with zero float is not necessarily on the critical path since its path may not be the longest.
Graphical models in Managerial Economics
Graphical models in Managerial Economics
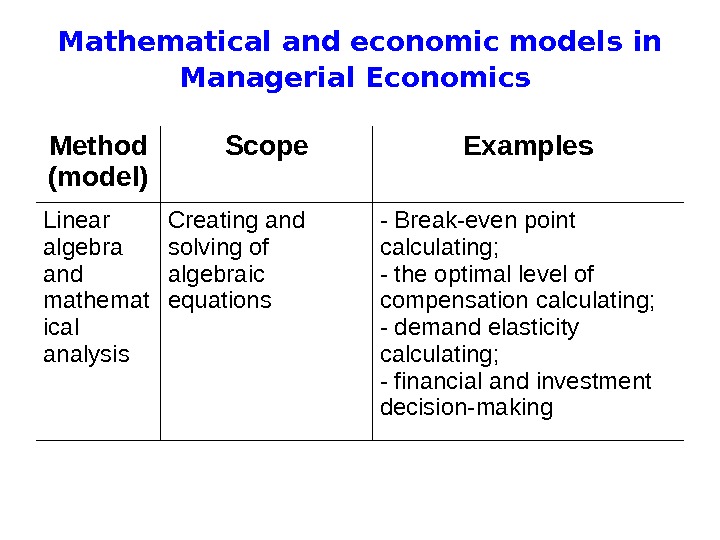
Mathematical and economic models in Managerial Economics Method (model) Scope Examples Linear algebra and mathemat ical analysis Creating and solving of algebraic equations — Break-even point calculating; — the optimal level of compensation calculating ; — demand elasticit y calculating ; — financial and investment decision — making
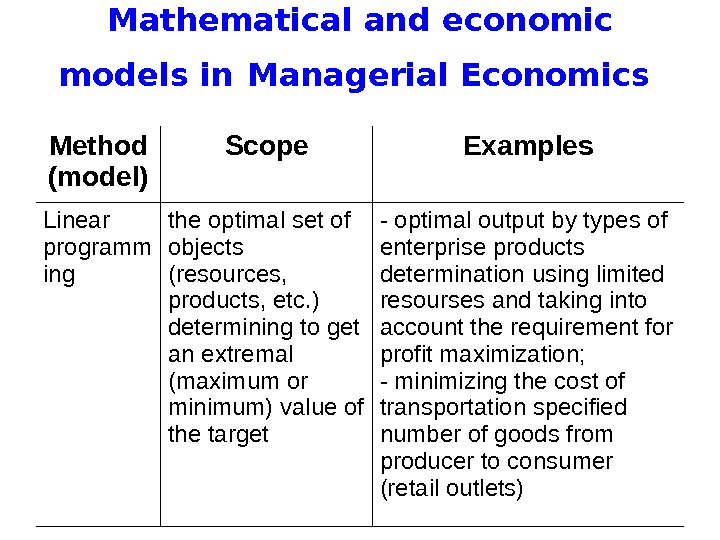
Mathematical and economic models in Managerial Economics Method (model) Scope Examples Linear programm ing the optimal set of objects (resources, products, etc. ) determining to get an extrem al (maximum or minimum) value of the target — optimal output by types of enterprise products determination using limit ed resourses and taking into account the requirement for profit maximization; — minimizing the cost of transportation specified number of goods from producer to consumer (retail outlets)
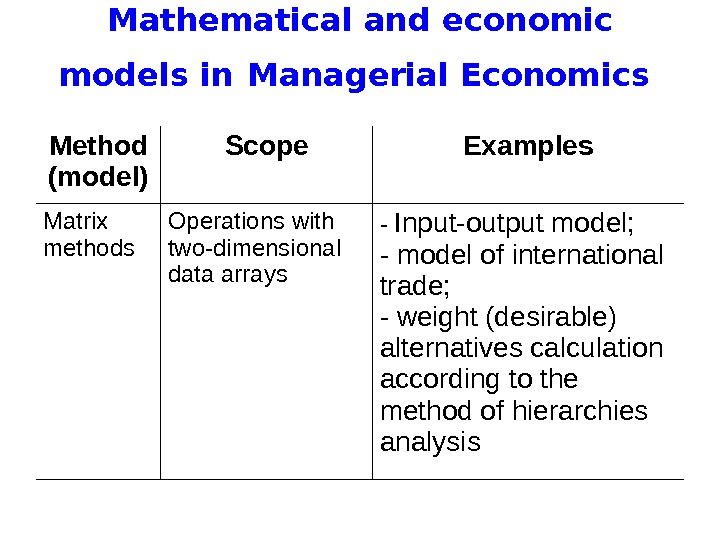
Mathematical and economic models in Managerial Economics Method (model) Scope Examples Matrix methods Operations with two-dimensional data arrays — Input-output model; — model of international trade; — weight (desirable) alternatives calculat ion according to the method of hierarchies analysis
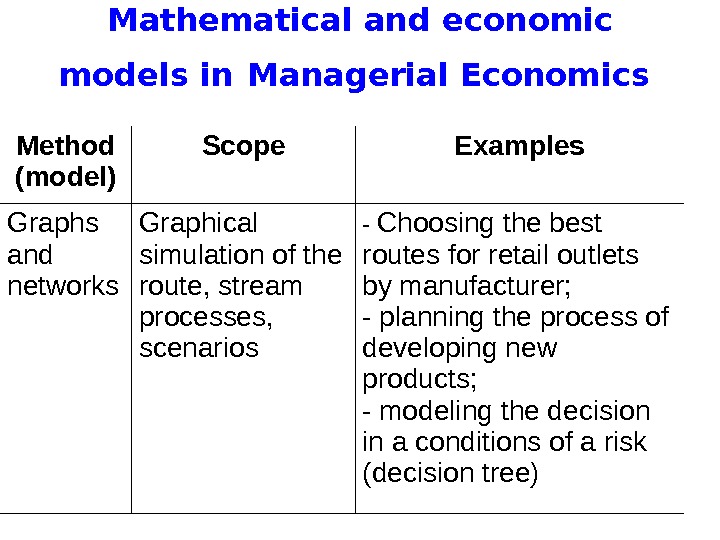
Mathematical and economic models in Managerial Economics Method (model) Scope Examples Graphs and networks Graphical simulation of the route, stream processes, scenarios — Choosing the best routes for retail outlets by manufacturer; — planning the process of developing new products; — modeling the decision in a conditions of a risk ( decision tree)
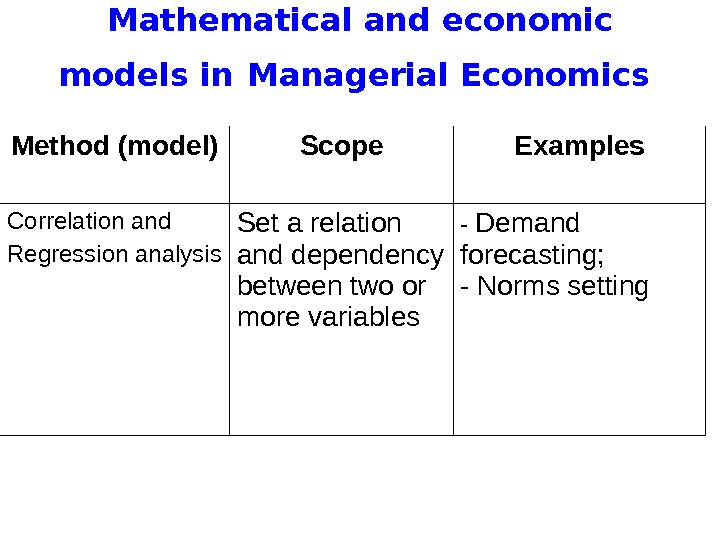
Mathematical and economic models in Managerial Economics Method (model) Scope Examples Correlation and Regression analysis Set a relation and dependency between two or more variables — Demand forecasting; — Norms setting
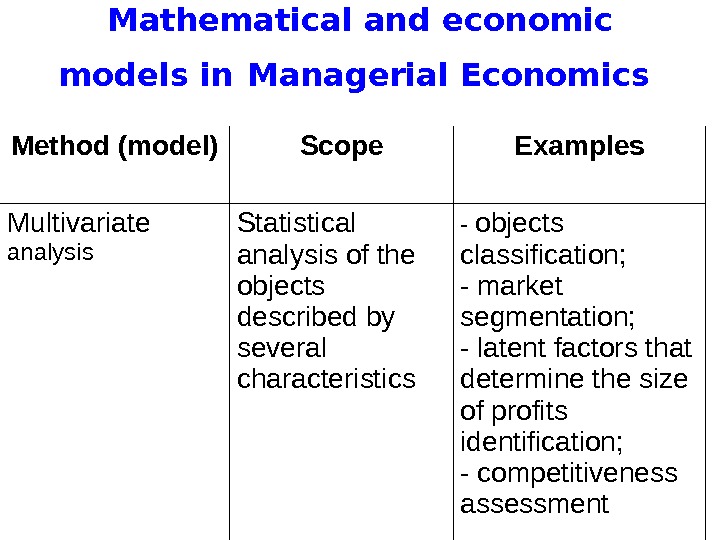
Mathematical and economic models in Managerial Economics Method (model) Scope Examples Multivariate analysis Statistical analysis of the objects described by several characteristics — objects classification; — market segmentation; — latent factors that determine the size of profits identif ication ; — competitiveness assessment
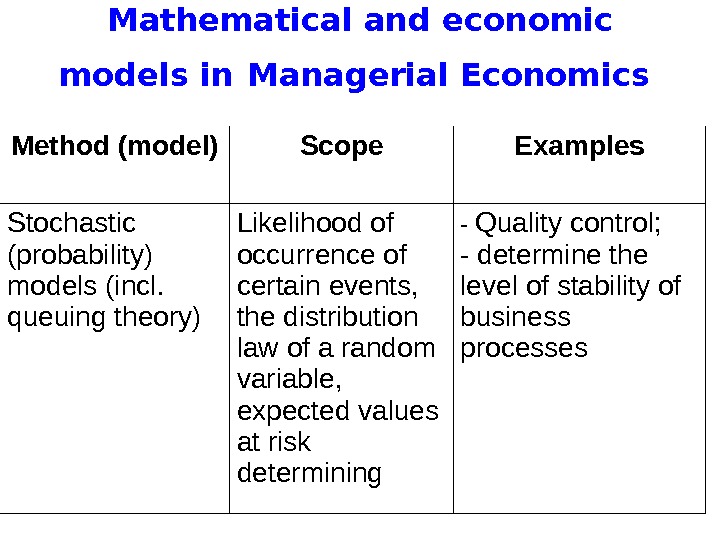
Mathematical and economic models in Managerial Economics Method (model) Scope Examples Stochastic (probabilit y ) models (incl. queuing theory) Likelihood of occurrence of certain events, the distribution law of a random variable, expected values at risk determining — Quality control; — determine the level of stability of business processes
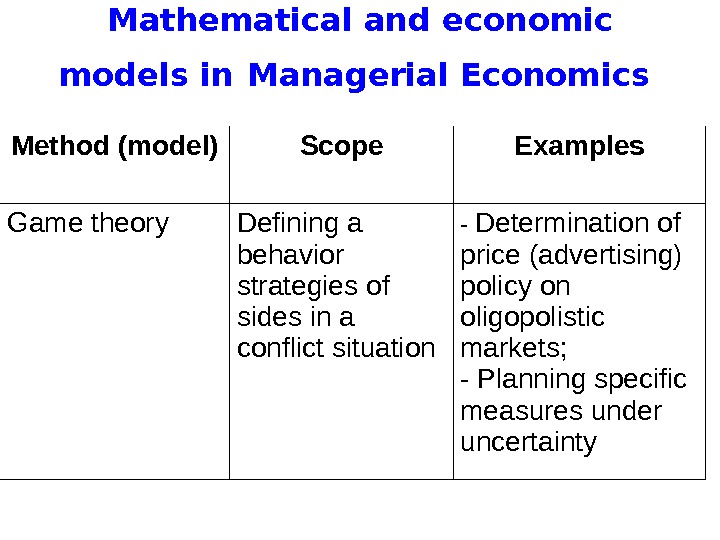
Mathematical and economic models in Managerial Economics Method (model) Scope Examples Game theory Defining a behavior strategies of sides in a conflict situation — Determination of price (advertising) policy on oligopolistic markets; — Planning specific measures under uncertainty
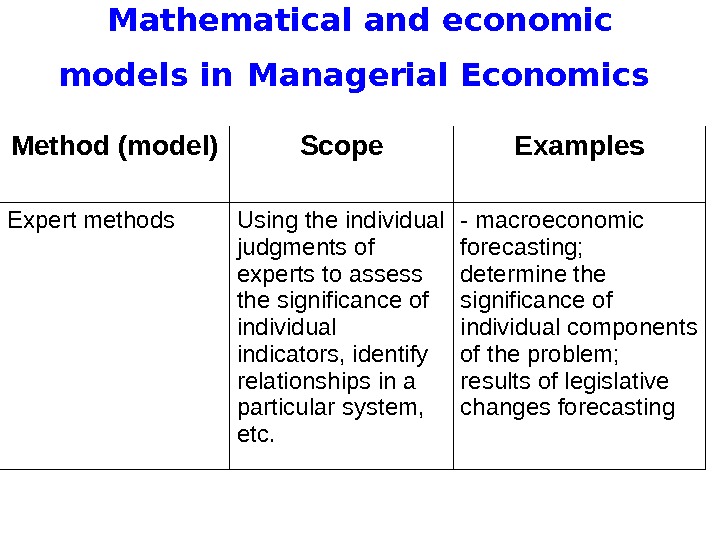
Mathematical and economic models in Managerial Economics Method (model) Scope Examples Expert methods Using the individual judgments of experts to assess the significance of individual indicators, identify relationships in a particular system, etc. — macroeconomic forecasting; determine the significance of individual components of the problem; results of legislative changes forecasting