d24f9429672bb1beff412d21e8d5ea5a.ppt
- Количество слайдов: 60


Management of Type 2 Diabetes Dr. Gayotri Goswami Attending Physician, Jacobi-North Central Bronx Hospital April 29 th, 2009
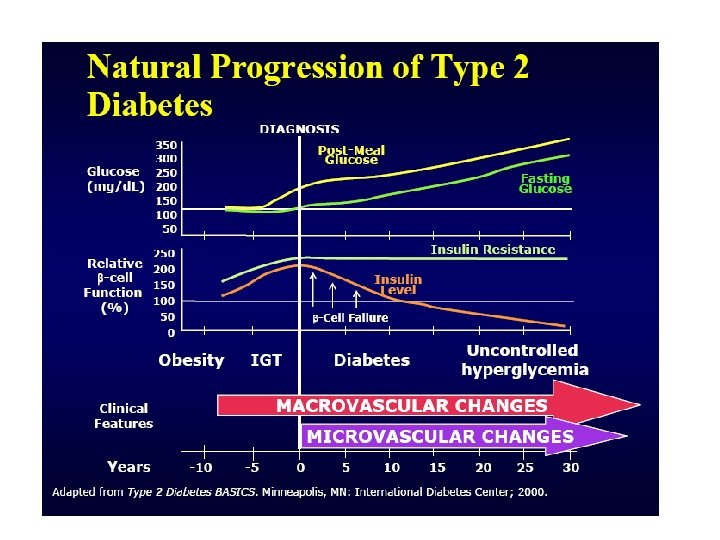

Stages of Type 2 Diabetes Related to Beta-Cell Function 100 75 Beta ell C Function 50 (%) Type 2 Phase 1 IGT 25 Postprandial Hyperglycemia 0 1 1 2 0 6 2 Type 2 Phase 3 Type 2 Phase 2 0 2 6 Years from Diagnosis Adapted from Lebovitz HE. Diabetes Reviews. 1999; 7(3). 10 14

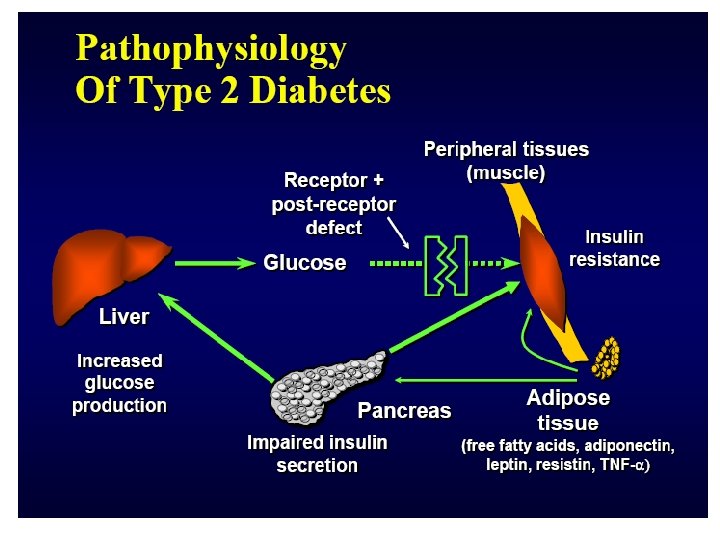
TREATMENT OF T 2 DM IS NOT JUST TREATING HYPERGLYEMIA PREVENTION AND TREATMENT OF MACROVASCULAR DISEASE REQUIRES ADDRESSING ALL CARDIOVASCULAR RISK FACTORS
 Reduces Complications DCCT Kumamoto UKPDS 9")
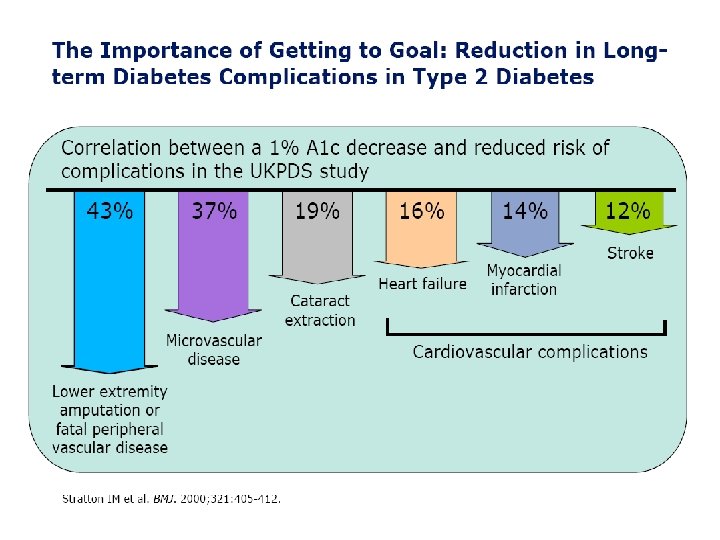
Good Glycemic Control (Lower Hb. A 1 c) Reduces Complications DCCT Kumamoto UKPDS 9 7% 8 7% Retinopathy 76% 69% 17 21% Nephropathy 54% 70% 24 33% Neuropathy Macrovascular disease 60% 41%* 16%* Hb. A 1 c * not statistically significant DCCT Study Group: N Engl J Med 329: 977 -86, 1993 Ohkubo Y: Diabetes Res Clin Prac 28: 103 -17, 1995 UKPDS Study Group: Lancet 352: 837 -53, 1998

Targets for Glycemic Control* Normal Goal <6. 0 <110 <7. 0 90 -130 <180 <6. 0 <110 <6. 5 <110 <135 <6. 0 <110 <6. 5 <110 <140 American Diabetes Association 1 A 1 C (%) Preprandial plasma glucose (mg/d. L) Peak postprandial plasma glucose (mg/d. L) European Diabetes Policy Group 2 A 1 C (%) Preprandial plasma glucose (mg/d. L) Postprandial glucose (mg/d. L) American Association of Clinical Endocrinologists 3 A 1 C (%) Preprandial plasma glucose (mg/d. L) Postprandial glucose (mg/d. L) *More stringent goal of <6. 0% should be considered for individual patients. Generally, A 1 C goal for each patient is an A 1 C as close to normal as possible without significant hypoglycemia. A 1 C = glycosylated hemoglobin A 1 C. 14 1. ADA. Diabetes Care. 2006; 29(suppl 1): S 4 -S 42. 2. European Diabetes Policy Group 1999. Diabet Med. 1999; 16: 716 -730. 3. Feld S. Endocr Pract. 2002; 8(suppl 1): 40 -82.

Major components for patient centered care International Diabetes Center model of patient-centered team care

Metabolic Management of type 2 DM Nathan et al, A Consensus Statement from the American Diabetes Association and the European Association for the Study of Diabetes Care, 29: 759 -764, 2006
 Lifestyle Interventions • Ongoing Patient Education")
NON PHARMACOLOGIC MEASURES Diabetes Self Management Training (DSMT) Lifestyle Interventions • Ongoing Patient Education • Medical Nutrition Therapy (MNT) • Physical Activity • SMBG Behavioral Health • Emotional assessment • Support Needs

Medical Nutrition Therapy • A 1 c has been shown to decrease by 1% in a RCT in Type 1 Diabetics • In Type 2, a decrease in A 1 c of 2% in newly diagnosed cases and 1% in cases of 4 years duration • Most effective during the early stages after diagnosis of Type 2 when insulin resistance is the highest • Messages on physical activity and MNT should be the most aggressive during the early stages

‘Healthy Plate Concept’

Contributions of FPG and PPG to Overall Glycemia in T 2 DM <7. 3 - 8. 4 8. 5 - 9. 2 9. 3 - 10. 2 >10. 2 FPG = fasting plasma glucose. PPG: Post prandial glucose Adapted with permission from Monnier L et al. Diabetes Care. 2003; 26: 881 -885.

PHARMACOLOGIC MEASURES

Sites of Action of Oral Antidiabetic Agents Liver: Glucose production BIGUANIDES Pancreas: Insulin secretion SULFONYLUREAS MEGLITINIDES Amylin secretion Muscle and adipose tissue: Peripheral glucose uptake THIAZOLIDINEDIONES GIT : Increase glucose stimulated insulin secretion INCRETIN MIMETICS Intestine: Digestion and absorption of carbohydrates GLUCOSIDASE INHIBITORS

Effect of Oral Therapies on A 1 c
 500 mg 850")
Biguanides: inhibits hepatic glucose production, slow titration dose • Glucophage (metformin) 500 mg 850 mg 1000 mg 500 to 2550 mg daily (b. i. d. ) • Glucophage XR (extended release delivery system) 500 mg 750 mg 500 to 2000 mg daily (q. d. or b. i. d. )

Metformin Dose-Response Study Mean Hb. A 1 c Reductions 0. 5 0 Mean Difference 0. 5 in Hb. A 1 c (%) vs. Placebo at 1 End of Study (14 weeks) 1. 5 0. 9 * 1. 2 * 2 2. 5 *P<0. 001 1. 6 1. 7 * 500 mg (n=73) 1000 mg (n=73) 1500 mg (n=76) 2. 0 * 2000 mg (n=73) * 2500 mg (n=77) Garber AJ et al. , Am J Med 1997.
 Treatment* † § ¶ ‡ Any")
% Risk Reduction UKPDS: Effects of Intensive (Metformin) Treatment* † § ¶ ‡ Any Diabetes Related Endpoint Diabetes Related Mortality * Compared with conventional treatment; † P=0. 0023; ‡ P=0. 017; §P=0. 011; ¶ P=0. 01 All Cause Mortality MI American Diabetes Association. Diabetes Care. 1999; 22(suppl 1): S 27 -S 31. UK Prospective Diabetes Study (UKPDS) Group. Lancet. 1998; 352: 854 -865.

Sulphonylureas • Lower BG by increasing insulin secretion from the pancreatic beta cells • The glucose lowering effect usually plateaus at approximately one half of the maximum recommended dose * • Should be used cautiously in the elderly and those with hepatic or renal impairment *Simonson et al. Diabetes care, 1997; 20: 597 -606 Stenman et al. Ann. Int. Med, 1993; 118: 169 -172
 • FIRST GENERATION AGENTS- lower binding affinity to the SFU receptor")
Sulfonylureas (insulin secretagogues) • FIRST GENERATION AGENTS- lower binding affinity to the SFU receptor and must be given in higher doses • SECOND GENERATION AGENTS – – – Glucotrol (glipizide) Glucotrol XL (glipizide GITS) Micronase, Dia. Beta (glyburide) Glynase (micronized glyburide) Amaryl (glimepiride score tabs) 2. 5 to 20 mg daily (b. i. d. ) 2. 5 to 20 mg daily (q. d. ) 1. 5 to 6 mg daily (q. d. ) 0. 5 to 8 mg daily (q. d. )

Thiazolidinediones • Pharmacological ligands for a nuclear receptor known as the PPAR • When activated, this receptor binds to response elements on DNA and alters transcription in various genes to regulate carbohydrate and lipid metabolism • Through this process increase insulin stimulated glucose uptake in the skeletal muscle cells

Molecular Targets of PPAR & PPAR action NEJM 2004; 351: 1106 -18

Thiazolidinediones • Indicated as monotherapy and in combination with SFU, metformin & insulin • Weight gain & edema are commonly seen when used with insulin • Contraindicated in patients with CHF and hepatic impairment • Additionally combining 2 sensitizers produces and additive effect* *Einhorn et al. Clin. Ther. 2000; 22: 1395 -1409
 • Rapid but short lived release of insulin that lasts")
Glinides (Nateglinide and Repaglinide) • Rapid but short lived release of insulin that lasts 1 to 2 hours • Attenuate post prandial glucose excursions, therefore should be used to target PP blood glucose levels • Repaglinide (Prandin) is more potent , is minimally cleared by the kidneys and can be used safely with severe renal impairment
 After 1")
Nateglinide: Meal-Related Insulin Levels in type 2 diabetes 120 (n = 10) After 1 Wk Tx NAT 120 mg ac x 3* Placebo ac x 3 Insulin (µU/m. L) 100 80 60 40 Meal 20 Meal Snack Meal 0 0 4 8 12 16 Time (hours post morning dose) *No dose taken with snack. Walter YH, et al. Eur J Clin Pharm. 2000; 56: 129– 133. 20

-Glucosidase Inhibitors delays digestion of carbohydrates and slows glucose absorption, slow titration dose • Precose (acarbose) – 25 mg – 50 mg – 100 mg 75 to 300 mg daily (t. i. d. ) before meals • Glyset (miglitol) – 25 mg – 50 mg – 100 mg 75 to 300 mg daily (t. i. d. ) before meals

-Glucosidase Inhibitors Advantage • • • Long history of use Good safety profile No weight gain Mild stool softening No substantial systemic drug-drug interaction • Good adjunctive therapy Disadvantage • Require highcarbohydrate diet • Must be taken before every meal • Modest efficacy • Flatulence and GI side effects • Elevated LFT’s have been reported Lebovitz HE, Diabetes Reviews 1998.

INCRETINS GLP 1 – Glucagon like peptide 1 GIP – Glucose dependant insulinotropic polypeptide

GLP 1 GIP § Is released from L cells in ileum and colon 1, 2 § Is released from K cells in duodenum 1, 2 § Stimulates insulin response from beta cells in a glucose dependent manner 1 § Inhibits gastric emptying 1, 2 § Has minimal effects on gastric emptying 2 § Reduces food intake and body weight 2 § Has no significant effects on satiety or body weight 2 § Inhibits glucagon secretion from alpha cells in a glucose dependent manner 1 § Does not appear to inhibit glucagon secretion from alpha cells 1, 2 1. Meier JJ et al. Best Pract Res Clin Endocrinol Metab. 2004; 18: 587– 606. 2. Drucker DJ. Diabetes Care. 2003; 26: 2929– 2940.

Modulation of Insulin and Glucagon Levels: The Enteroinsular Axis Hormonal signals • GLP 1 • GIP Glucagon (GLP-1) Neural signals alpha cells beta cells Pancreas Gut Insulin (GLP-1, GIP) Nutrient signals Adapted with permission from Creutzfeldt W. Diabetologia. 1979; 16: 75– 85. Copyright © 1979 Springer Verlag. Drucker DJ. Diabetes Care. 2003; 26: 2929– 2940. Kieffer T et al. Endocr Rev. 1999; 20: 876– 913. Nauck MA et al. Diabetologia. 1993; 36: 741– 744. 42
")
The Incretin Effect in Subjects Without and With Type 2 Diabetes Control Subjects (n=8) 0. 6 Incretin Effect 80 0. 4 0. 2 20 0. 1 0 0 0 60 120 180 Time, min 60 0. 5 0. 4 0. 3 40 0. 2 20 0. 1 0 0 0 60 120 180 Time, min Oral glucose load Intravenous (IV) glucose infusion Adapted with permission from Nauck M et al. Diabetologia. 1986; 29: 46– 52. Copyright © 1986 Springer Verlag. 43 nmol/L 0. 3 40 IR Insulin, m. U/L 60 0. 6 The incretin effect is diminished in type 2 diabetes. 0. 5 nmol / L IR Insulin, m. U/L 80 Patients With Type 2 Diabetes (n=14)

GLP-1 and GIP Are Degraded by the DPP-4 Enzyme Meal Intestinal GIP and GLP 1 release GIP-(1– 42) GLP-1(7– 36) Intact GIP and GLP 1 Actions DPP 4 Enzyme Rapid Inactivation GIP-(3– 42) GLP-1(9– 36) Metabolites Half life* GLP 1 ~ 2 minutes GIP ~ 5 minutes Deacon CF et al. Diabetes. 1995; 44: 1126– 1131. *Meier JJ et al. Diabetes. 2004; 53: 654– 662.
– binds to and activates the GLP 1 receptor")
Effective GLP 1 therapies: Exenatide (Byetta)– binds to and activates the GLP 1 receptor and resists degradation by DPP-4 (April 2005) Sitagliptin (Januvia) – resistant to DPP-4 degradation (October 2006) Vildagliptin – inhibits the DPP-4 enzyme (Under review by FDA)
 • Indicated as an adjunctive therapy in patients with. Type 2 DM")
Byetta (Exenatide) • Indicated as an adjunctive therapy in patients with. Type 2 DM who are taking Metformin, SFU or a combination and TZD but has not achieved adequate control • Not recommended for use in patients with ESRD, severe renal impairment, or severe gastrointestinal disease and in Type 1 Diabetics
 • Major side effect is nausea. Recent FDA warning of acute pancreatitis")
Byetta (Exenatide) • Major side effect is nausea. Recent FDA warning of acute pancreatitis being associated with Byetta. • Prescribed as a subcutaneous injection given within 1 hour before the morning and evening meal • Starting dose is 5 ug BID and can be increased to 10 ug BID
 DDP-4 inhibitor • Monotherapy or in combination with Metformin, TZD, Glimepiride ±")
Sitagliptin (Januvia) DDP-4 inhibitor • Monotherapy or in combination with Metformin, TZD, Glimepiride ± Metformin • Mainly target PPG but have been shown to decrease FBG levels • Daily recommended dose is 100 mg orally once a day • Dose adjustment is required in moderate to severe renal insufficiency

“Although insulin therapy has not traditionally been implemented early in the course of Type 2 diabetes, there is no reason why it should not be…” Nathan DM. NEJM. Oct 24, 2002; 347(17): 1342 -1349.
")
75 Physiologic Blood Insulin Secretion Profile Breakfast Lunch Dinner 50 Plasma Insulin (µU/m. L) 25 4: 00 8: 00 12: 00 16: 00 20: 00 Time Adapted from White JR, Campbell RK, Hirsch I. Postgraduate Medicine. June 2003; 113(6): 30 -36. 24: 00 8: 00

Loss of Early Insulin Release Leads to Postprandial Hyperglycemia Plasma Insulin Plasma Glucose 60 360 270 40 (mg/d. L) (m. U/L) 180 20 90 0 – 1 0 1 2 3 4 5 – 1 Hours After Glucose Ingestion Healthy Subjects Patients With Type 2 Diabetes Mitrakou A, et al. Diabetes. 1990; 39: 1381– 1390. 0 1 2 3 4 5
 – Novolog (aspart)")
INSULINS • • • RAPID ACTING INSULIN ANALOGS – Humalog (lispro) – Novolog (aspart) – Glulisine (epidra) SHORT ACTING Regular 1 2 1 2 (2 6) 2 4 (3 6) INTERMEDIATE ACTING – NPH • Peak (duration) hrs LONG ACTING – Lantus / glargine – Levemir / detemir 6 12 (10 24) none (10 24)
 – 70/30 – 50/50 HUMALOG (Prot lispro/free lispro)")
Fixed dose insulin mixes HUMULIN (NPH/REG) – 70/30 – 50/50 HUMALOG (Prot lispro/free lispro) – 75/25 NOVOLIN (NPH/REG) – 70/30 NOVOLOG MIX (Prot aspart/aspart) – 70/30

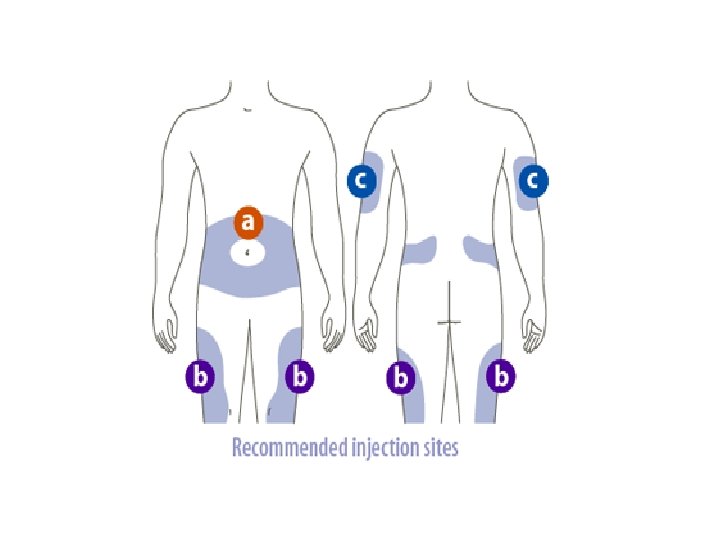
Insulin delivery devices

OPTIONS……… 1. Once daily background or basal insulin if fasting BG is elevated but glucose values remain stable during the day, 2. Once daily or twice daily pre-mixed insulin analogue, orally administered drugs may or may not be continued 3. Basal bolus therapy…. . first initiate basal along with 1 bolus injection before the largest meal and eventually at each meal , if needed

What doses to start with……. . • With Hb. A 1 c <8%, begin 0. 1 U/Kg body weight • Hb. A 1 c 8 -10%, start 0. 2 U/kg body weight • Hb. A 1 c >10%, start 0. 3 U/Kg body weight • With pre-mixes can divide the total dose by 2 if used twice a day • With insulin glargine, adjust dose every 37 days until target fasting dose is reached Bergenstal Endocrine Practice, Jan 2006

Advantages of rapid acting insulin analogs • Restores the early insulin peak in combination with meal ingestion • Prevents the hyperinsulinemia resulting from the late absorption of regular insulin and thereby protects against hypoglycemia

Human Insulin Time-Action Patterns Change in serum insulin Normal insulin secretion at mealtime Theoretical representation of expected insulin release in nondiabetic subjects Baseline Level Time (hours) SC injection

Human Insulin Time-Action Patterns Change in serum insulin Normal insulin secretion at mealtime Regular insulin (human) Theoretical representation of profile associated with Regular Insulin (human) Baseline Level Time (hours) SC injection

Analog Insulin Time-Action Patterns Change in serum insulin Normal insulin secretion at mealtime Theoretical representation of expected insulin release in nondiabetic subjects Baseline Level Time (hours) SC injection

Analog Insulin Time-Action Patterns Change in serum insulin Normal insulin secretion at mealtime Rapid Acting Insulin Analog Theoretical representation of profile associated with rapid acting Insulin Analog Baseline Level Time (hours) SC injection

Human Insulin Time-Action Patterns Change in serum insulin Normal insulin secretion at mealtime NPH insulin (human) Theoretical representation of profile associated with NPH Insulin Baseline Level Time (hours) SC injection

Human Insulin Time-Action Patterns Change in serum insulin Normal insulin secretion at mealtime Human Premix 70/30 (70% NPH & 30% Regular) Theoretical representation of profile associated with Human Premix 70/30 Baseline Level Time (hours) SC injection

Analog Insulin Time-Action Patterns Change in serum insulin Normal insulin secretion at mealtime QD (basal) Analog Insulin Theoretical representation of profile associated with Basal Analog Insulin Baseline Level Time (hours) SC injection

Analog Insulin Time-Action Patterns Change in serum insulin Normal insulin secretion at mealtime Insulin Analog Premix Theoretical representation of profile associated with Insulin Analog Premix Baseline Level Time (hours) SC injection

USE COMBINATION THERAPY AND GET PATIENTS TO GOAL AS SOON AS POSSIBLE

COMBINATION THERAPY AACE Guidelines, Endocrine Practice, May/June 2007

• Finally, Type 2 DM is a progressive disease with worsening glycemia over time. • Therefore, addition of medications is the rule, not the exception, if treatment goals are to be met over time.
d24f9429672bb1beff412d21e8d5ea5a.ppt