

1429d35bfa2f28e7b81ca31e71256974.ppt
- Количество слайдов: 80
 Machine Learning for Healthcare David Page Dept. of Biostatistics & Medical Informatics and Dept. of Computer Sciences University of Wisconsin-Madison
 Electronic Medical Record Patient. ID Date Patient. ID Gender Birthdate P 1 M Patient. ID Date P 1 Patient. ID P 1 P 1 3/22/63 Lab Test Result 1/1/01 blood glucose 1/9/01 blood glucose Date Prescribed 5/17/98 42 45 Physician Symptoms 1/1/01 2/1/03 Smith Jones Diagnosis palpitations hypoglycemic fever, aches influenza Patient. ID SNP 1 SNP 2 … SNP 500 K P 1 P 2 AA AB AB BB BB AA Date Filled Physician Medication Dose Duration 5/18/98 Jones prilosec 10 mg 3 months
 Predictive Personalized Medicine Genetic, Clinical, & Environmental Data Repeat for thousands of patients State-of-the-Art Machine Learning Individual Patient G+C+E Predictive Model for Disease Susceptibility & Treatment Response Personalized Treatment Repeat for hundreds of diseases and treatments 3
 Estimation of the Warfarin Dose with Clinical and Pharmacogenetic Data n n International Warfarin Pharmacogenetics Consortium n (IWPC) NEJM, February 19, 2009, vol. 360, no. 8
 Motivation n n “In Milestone, FDA Pushes Genetic Tests Tied to Drug” Where: Front-page article, Wall Street Journal, August 16, 2007 Why: FDA released new warfarin product labeling with pharmacogenomics dosing recommendations What: New pharmacogenetics section and changes in initial dosage section with pharmacogentics in the warnings section http: //www. fda. gov/cder/foi/label/2007/009218 s 105 lblv 2. pdf
") “In Milestone, FDA Pushes Genetic Tests Tied to Drug” Initial dosing (warfarin package insert) “The dosing of COUMADIN must be individualized according to patient’s sensitivity to the drug as indicated by the PT/INR…. . It is recommended that COUMADIN therapy be initiated with a dose of 2 to 5 mg per day with dosage adjustments based on the results of PT/INR determinations. The lower initiation doses should be considered for patients with certain genetic variations in CYP 2 C 9 and VKORC 1 enzymes as well as for elderly and/or debilitated patients…. ” http: //www. fda. gov/cder/foi/label/2007/009218 s 105 lblv 2. pdf
“In Milestone, FDA Pushes Genetic Tests Tied to Drug” Initial dosing (warfarin package insert) “The dosing of COUMADIN must be individualized according to patient’s sensitivity to the drug as indicated by the PT/INR…. . It is recommended that COUMADIN therapy be initiated with a dose of 2 to 5 mg per day with dosage adjustments based on the results of PT/INR determinations. The lower initiation doses should be considered for patients with certain genetic variations in CYP 2 C 9 and VKORC 1 enzymes as well as for elderly and/or debilitated patients…. ” http: //www. fda. gov/cder/foi/label/2007/009218 s 105 lblv 2. pdf
 Clinicians’ responses to FDA labeling change for warfarins n n How, exactly, would I use this information? Nice science, but prove to me that it’s better than what we already do n n i. e. , I have to see a randomized trial comparing genotype-guided versus usual dosing Summer 2009: the NHLBI Clarification of Optimal Anticoagulation through Genetics (COAG) trial (PI: Stephen Kimmel, MD)
 will") Current warfarin pharmacogenetics information limitations n n Clinical utility (or a randomized trial) will require dosing equation that incorporates genetic and non-genetic, demographic information. Numerous such equations have been proposed, but: • • n most are highly geographically confined none were developed from robust data in Asians, Caucasians, and Africans Thus, an equation derived from a large, geographically and ethnically diverse population was needed to help insure global clinical utility.
Current warfarin pharmacogenetics information limitations n n Clinical utility (or a randomized trial) will require dosing equation that incorporates genetic and non-genetic, demographic information. Numerous such equations have been proposed, but: • • n most are highly geographically confined none were developed from robust data in Asians, Caucasians, and Africans Thus, an equation derived from a large, geographically and ethnically diverse population was needed to help insure global clinical utility.
 IWPC - 21 research groups 4 continents and 9 countries n Asia n n Europe n n Sweden, United Kingdom North America n n Israel, Japan, Korea, Taiwan, Singapore USA (11 states: Alabama, California, Florida, Illinois, Missouri, North Carolina, Pennsylvania, Tennessee, Utah, Washington, Wisconsin) South America n Brazil
 Dataset n n n 5, 700 patients treated with warfarin Demographic characteristics Primary indication for warfarin treatment Stable therapeutic dose of warfarin Treatment INR Target INR n n 5, 052 patients with a target INR of 2 -3 Concomitant medications n n Grouped by increased or decreased effect on INR n CYP 2 C 9 (*1, *2 and *3) Presence of genotype variants n VKORC 1 (one of seven SNPs in linkage disequilibrium) n blinded re-genotyping for quality control
 Age, height and weight
") Average warfarin doses for stable INR (median – 2. 5)
Average warfarin doses for stable INR (median – 2. 5)
 Race, inducers and amiodarone
 CYP 2 C 9 and VKORC 1 genotypes
 Weekly dose by CYP 2 C 9 genotype
 CYP 2 C 9 genotype by race
 Weekly dose by VKORC 1 -1639 genotype
 VKORC 1 -1639 genotype by race
 Modeling of VKORC 1 SNPs n Missing values of VKORC 1 -1639 G>A (rs 9923231) n n Imputed based on race and VKORC 1 SNP data at 2255 C>T (rs 2359612), 1173 C>T (rs 9934438), or 1542 G>Crs 8050894 If the VKORC 1 genotype could not be imputed, it was treated as “missing” (a distinct variable) in the model.
 Data Analysis Methodology n Derivation Cohort n n 4, 043 patients with a stable dose of warfarin and target INR of 2 -3 mg/week Used for developing dose prediction models Validation Cohort • • 1, 009 patients (20% of dataset) Used for testing final selected model Analysis group did not have access to validation set until after the final model was selected
 Real-valued prediction methods used n Included, among others n Support vector regression n Regression trees n Model trees n Multivariate adaptive regression splines n Least-angle regression n Lasso n Logarithmic and square-root transformations n Direct prediction of dose Support vector regression and Ordinary least-squares linear regression gave the lowest mean absolute error n n Predicted the square root of the dose Incorporated both genetic and clinical data
 IWPC pharmacogenetic dosing algorithm n n **The output of this algorithm must be squared to compute weekly dose in mg ^All references to VKORC 1 refer to genotype for rs 9923231
 IWPC clinical dosing algorithm n **The output of this algorithm must be squared to compute weekly dose in mg
 Results Inclusion of genotypes for CYP 2 C 9 and VKORC 1, in addition to clinical variables, are significantly closer to estimating the appropriate initial dose of warfarin than just a clinical or fixed-dose approach 46. 2% of the population with ≤ 21 mg/wk or ≥ 49 mg/wk benefit the most n These are the patients for whom an underdose or overdose could have adverse clinical consequences. Patients requiring an intermediate dose are likely to obtain little benefit including genotypes
 Model comparisons
 Warfarin doses predicted for the clinical and PGx algorithms with and without amiodarone 50 yr old White Male 175 cm 80 kg Genotypes can change the recommended dose from >45 mg/wk to <10 mg/wk when all other factors equal!
 Warfarin doses predicted for the clinical and PGx algorithms based on race and genotype 50 yr old Male 175 cm 80 kg Racial differences in the estimated dose are insignificant when genotypes included. Clinical algorithm may substantially overestimate or underestimate the dose.
 % Patients with dose estimates within 20% of actual dose • Comparison of PGx, clinical and fixed dose approaches • 3 dose groups shown (mg/wk) • low (≤ 21) • intermediate (>21 to <49) • high (≥ 49) • Fixed dose (35 mg/wk) • None of the estimates for low and high dose groups were within 20% of actual dose
 Limitations of this study Did not address the issue of whether a precise initial dose of warfarin translates into 1. n improved clinical end points reduction in time needed to achieve a stable therapeutic INR, fewer INRs out of range, reduced incidence of bleeding or thromboembolic events Did not have sufficient data across the 21 groups to include potentially important factors such as 2. n smoking status, vitamin K intake, alcohol consumption, other genetic factors (e. g. , CYP 4 F 2, Apo. E, GGCX), environmental factors
 New England Journal of Medicine, Feb 2009 Data available at Pharm. GKB • www. pharmgkb. org • Accession number: PA 162355460
 IWPC Authors Writing committee: Teri E. Klein, Russ B. Altman, Niklas Eriksson, Brian F. Gage, Stephen E. Kimmel, Ming-Ta M. Lee, Nita A. Limdi, David Page, Dan M. Roden, Michael J. Wagner, Michael D. Caldwell, Julie A. Johnson Data Contributors: Academic Sinica, Taiwan, ROC: Ming-Ta M. Lee, Yuan-Tsong Chen Chang Gung Memorial Hospital, Chang Gung University, Taiwan, ROC: Ming-Shien Wen China Medical University, Graduate Institute of Chinese Medical Science, Taichung, Taiwan, ROC: Ming-Ta M. Lee Hadassah Medical Organization, Israel: Yoseph Caraco, Idit Achache, Simha Blotnick, Mordechai Muszkat Inje University, Korea: Jae-Gook Shin, Ho-Sook Kim Instituto Nacional de Câncer, Brazil: Guilherme Suarez-Kurtz, Jamila Alessandra Perini Instituto Nacional de Cardiologia Laranjeiras, Brazil: Edimilson Silva-Assunção Intermountain Healthcare, USA: Jeffrey L. Anderson, Benjamin D. Horne, John F. Carlquist Marshfield Clinic, USA: Michael D. Caldwell, Richard L. Berg, James K. Burmester National University Hospital, Singapore: Boon Cher Goh, Soo-Chin Lee Newcastle University, United Kingdom: Farhad Kamali, Elizabeth Sconce, Ann K. Daly University of Alabama, USA: Nita A. Limdi University of California, San Francisco, USA: Alan H. B. Wu University of Florida, USA: Julie A. Johnson, Taimour Y. Langaee, Hua Feng University of Illinois, Chicago, USA: Larisa Cavallari, Kathryn Momary University of Liverpool, United Kingdom: Munir Pirmohamed, Andrea Jorgensen, Cheng Hok Toh, Paula Williamson University of North Carolina, USA: Howard Mc. Leod, James P. Evans, Karen E. Weck University of Pennsylvania, USA: Stephen E. Kimmel, Colleen Brensinger University of Tokyo and RIKEN Center for Genomic Medicine, Japan: Yusuke Nakamura, Taisei Mushiroda University of Washington, USA: David Veenstra, Lisa Meckley, Mark J. Rieder, Allan E. Rettie Uppsala University, Sweden: Mia Wadelius, Niclas Eriksson, Håkan Melhus Vanderbilt University, USA: C. Michael Stein, Dan M. Roden, Ute Schwartz, Daniel Kurnik Washington University in St. Louis, USA: Brian F. Gage, Elena Deych, Petra Lenzini, Charles Eby Wellcome Trust Sanger Institute, United Kingdom: Leslie Y. Chen, Panos Deloukas Statistical Analysis: University of Alabama, USA: Nita A. Limdi Marshfield Clinic, USA: Michael D. Caldwell North Carolina State University, USA: Alison Motsinger-Reif Stanford University, USA: Russ B. Altman, Hersh Sagrieya, Teri E. Klein, Balaji S. Srinivasan Uppsala University, Uppsala Clinical Research Center, Sweden: Niclas Eriksson University of California, San Francisco, USA: Alan H. B. Wu University of North Carolina, USA: Michael J. Wagner University of Florida, USA: Julie A. Johnson University of Pennsylvania, USA: Stephen E. Kimmel University of Wisconsin-Madison, USA: David Page, Eric Lantz, Tim Chang Vanderbilt University, USA: Marylyn Ritchie Washington University in St. Louis, USA: Brian F. Gage, Elena Deych Genotyping QC of IWPC Samples: Academic Sinica, Taiwan, ROC: Ming-Ta M. Lee, Liang-Suei Lu Genotype and Phenotype QC: Inje University, Korea: Jae-Gook Shin Marshfield Clinic, USA: Michael D. Caldwell Stanford University, USA: Teri E. Klein, Russ B. Altman, Balaji S. Srinivasan University of Alabama, USA: Nita A. Limdi University of Florida, USA: Julie A. Johnson University of Pennsylvania, USA: Stephen E. Kimmel University of North Carolina, USA: Michael J. Wagner University of Wisconsin-Madison, USA: David Page Washington University in St. Louis, USA: Brian F. Gage Vanderbilt University, USA: Marylyn Ritchie Data Curation: Stanford University, USA: Teri E. Klein, Russ B. Altman, Balaji S. Srinivasan University of North Carolina, USA: Michael J. Wagner Washington University in St. Louis, USA: Elena Deych
 Application: Mammography § § Provide decision support for radiologists Variability due to differences in training and experience… to get 90% of cancers, have high false positive rate § Experts have higher cancer detection and fewer benign biopsies § Shortage of experts
 n Kahn, Roberts,") Bayes Net for Mammography n Kahn, Roberts, Wang, Jenks, Haddawy (1995) n Kahn, Roberts, Shaffer, Haddawy (1997) n Burnside, Rubin, Shachter (2000) n Note: not CAD (computer-assisted diagnosis), which circles abnormalities in an image… this is based on data entered into National Mammography Database schema by radiologists
Bayes Net for Mammography n Kahn, Roberts, Wang, Jenks, Haddawy (1995) n Kahn, Roberts, Shaffer, Haddawy (1997) n Burnside, Rubin, Shachter (2000) n Note: not CAD (computer-assisted diagnosis), which circles abnormalities in an image… this is based on data entered into National Mammography Database schema by radiologists
 Mass Stability Mass Margins Ca++ Lucent Milk of Centered Calcium ++ Ca Dermal Mass Density Ca++ Round Mass Shape Ca++ Dystrophic Mass Size Breast Density Mass P/A/O Benign v. Malignant Skin Lesion Tubular Density Architectural LN Asymmetric Distortion Density Ca++ Popcorn Ca++ Fine/ Linear Ca++ Eggshell Ca++ Pleomorphic Age FHx HRT Ca++ Punctate Ca++ Amorphous Ca++ Rod-like
 Mammography Database Patient Abnormality Date Calcification … Fine/Linear Mass Size Loc Benign/ Malignant P 1 1 5/02 No 0. 03 RU 4 B P 1 2 5/04 Yes 0. 05 RU 4 M P 1 3 5/04 No 0. 04 LL 3 B P 2 … 4 … 6/00 … No … 0. 02 … RL 2 … B …
 = ? ? . 99 Benign v. Malignant Calc Fine") Level 1: Parameters P(Benign) = ? ? . 99 Benign v. Malignant Calc Fine Linear Mass Size P(Yes| Benign) = . 01 ? ? P( size > 5| Benign) = P(Yes| Malignant) = . 55 ? ? P(size > 5| Malignant) = . 33 ? ? . 42 ? ?
Level 1: Parameters P(Benign) = ? ? . 99 Benign v. Malignant Calc Fine Linear Mass Size P(Yes| Benign) = . 01 ? ? P( size > 5| Benign) = P(Yes| Malignant) = . 55 ? ? P(size > 5| Malignant) = . 33 ? ? . 42 ? ?
 =.") Level 2: Structure + Parameters Benign v. Malignant Calc Fine Linear P(Yes| Benign) =. 01 P(Yes) =. 02 P(Yes| Malignant) =. 55 P(Benign) =. 99 Mass Size P( size > 5 )=. 1 P(size > 5| Benign ^ Yes) =. 4 P( size > 5| Benign) =. 33 P(size > 5| Malignant ^ Yes) =. 6 P(size > 5| Malignant) =. 42 P(size > 5| Benign ^ No) =. 05 P(size > 5| Malignant ^ No) =. 2
Level 2: Structure + Parameters Benign v. Malignant Calc Fine Linear P(Yes| Benign) =. 01 P(Yes) =. 02 P(Yes| Malignant) =. 55 P(Benign) =. 99 Mass Size P( size > 5 )=. 1 P(size > 5| Benign ^ Yes) =. 4 P( size > 5| Benign) =. 33 P(size > 5| Malignant ^ Yes) =. 6 P(size > 5| Malignant) =. 42 P(size > 5| Benign ^ No) =. 05 P(size > 5| Malignant ^ No) =. 2
 Data n n Structured data from actual practice National Mammography Database n n Standard for reporting all abnormalities Our dataset contains 435 malignancies n 65, 365 benign abnormalities n n Link to biopsy results n Obtain disease diagnosis – our ground truth
 Hypotheses n n Learn relationships that are useful to radiologist Improve by moving up learning hierarchy
 n n n Trained (Level 2, TAN) Bayesian network model achieved") Results (Radiology, 2009) n n n Trained (Level 2, TAN) Bayesian network model achieved an AUC of 0. 966 which was significantly better than the radiologists’ AUC of 0. 940 (P = 0. 005) Trained BN demonstrated significantly better sensitivity than the radiologist (89. 5% vs. 82. 3% —P = 0. 009) at a specificity of 90% Trained BN demonstrated significantly better specificity than the radiologist (93. 4% versus 86. 5%—P = 0. 007) at a sensitivity of 85%
Results (Radiology, 2009) n n n Trained (Level 2, TAN) Bayesian network model achieved an AUC of 0. 966 which was significantly better than the radiologists’ AUC of 0. 940 (P = 0. 005) Trained BN demonstrated significantly better sensitivity than the radiologist (89. 5% vs. 82. 3% —P = 0. 009) at a specificity of 90% Trained BN demonstrated significantly better specificity than the radiologist (93. 4% versus 86. 5%—P = 0. 007) at a sensitivity of 85%
 vs. Level 1") ROC: Level 2 (TAN) vs. Level 1
ROC: Level 2 (TAN) vs. Level 1
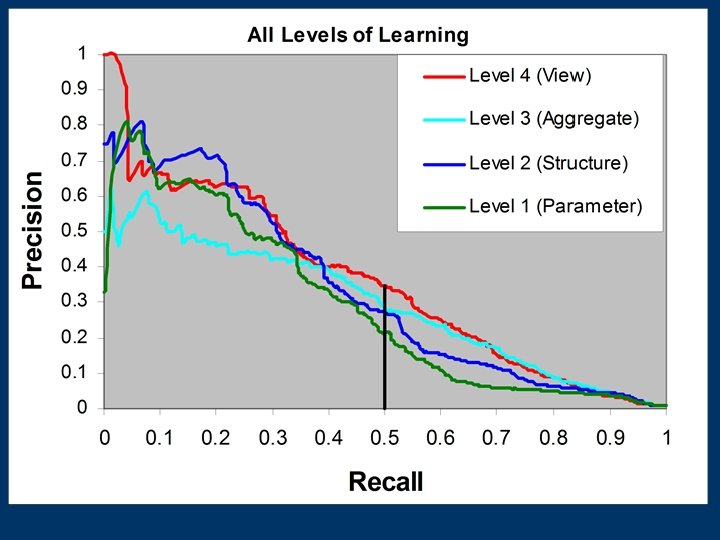
 Precision-Recall Curves
 Mammography Database Patient Abnormality Date Calcification … Fine/Linear Mass Size Loc Benign/ Malignant P 1 1 5/02 No 0. 03 RU 4 B P 1 2 5/04 Yes 0. 05 RU 4 M P 1 3 5/04 No 0. 04 LL 3 B P 2 … 4 … 6/00 … No … 0. 02 … RL 2 … B …
 Statistical Relational Learning n n Learn probabilistic model, but don’t assume iid data: there may be relevant data in other rows or even other tables Database schema: defines set of features
 SRL Aggregates Information from Related Rows or Tables n n Extend probabilistic models to relational databases Probabilistic Relational Models (Friedman et al. 1999, Getoor et al. 2001) n n n Tricky issue: one to many relationships Approach: use aggregation PRMs cannot capture all relevant concepts
 Aggregation Function: Aggregate Illustration Min, Max, Average, etc. Patient Abnormality Date Calcification … Fine/Linear Mass Size Loc Benign/ Malignant P 1 1 5/02 No 0. 03 RU 4 B P 1 2 5/04 Yes 0. 05 RU 4 M P 1 3 5/04 No 0. 04 LL 3 B P 2 … 4 … 6/00 … No … 0. 02 … RL 2 … B …
 New Schema Patient Abnormality Date Calcification … Mass. Avg Size Loc this Date Fine/Linear Size this date Benign/ Malignant P 1 1 5/02 No 0. 03 RU 4 B P 1 2 5/04 Yes 0. 05 0. 045 RU 4 M P 1 3 5/04 No 0. 045 LL 3 B P 2 … 4 … 6/00 … No … 0. 02 … B … 0. 02 … … RL 2 …
 Level 3: Aggregates Benign v. Malignant Calc Fine Linear Avg Size this date Mass Size Note: Learn parameters for each node
 Database Notion of View n n n New tables or fields defined in terms of existing tables and fields known as views A view corresponds to alteration in database schema Goal: automate the learning of views
 Possible View Patient Abnormality Date Calcification … Fine/Linear Mass Size Loc Benign/ Malignant P 1 1 5/02 No 0. 03 RU 4 B P 1 2 5/04 Yes 0. 05 RU 4 M P 1 3 5/04 No 0. 04 LL 3 B P 2 … 4 … 6/00 … No … 0. 02 … RL 2 … B …
 New Schema Patient Abnormality Date Calcification … Mass Increase Fine/Linear Size in size In Size Loc Benign/ Malignant P 1 1 5/02 No 0. 03 No No RU 4 B P 1 2 5/04 Yes 0. 05 Yes RU 4 M P 1 3 5/04 No 0. 04 No No LL 3 B P 2 … 4 … 6/00 … No … 0. 02 … No No … … RL 2 … B …
 Level 4: View Learning Increase in Size Benign v. Malignant Calc Fine Linear Avg Size this date Mass Size Note: Include aggregate features Learn parameters for each node
 Level 4: View Learning n Learn rules predictive of “malignant” n n We used Aleph (Srinivasan) Treat each rule as a new field 1 if abnormality matches rule n 0 otherwise n n New view consists of original table extended with new fields
 Experimental Methodology n n 10 -fold cross validation Split at the patient level Roughly 40 malignant cases and 6000 benign cases in each fold Tree Augmented Naïve Bayes (TAN) as structure learner (Friedman, Geiger & Goldszmidt ’ 97)
![Sample View [Burnside et al. AMIA 05] malignant(A) : birads_category(A, b 5), mass. PAO(A,](https://present5.com/presentation/1429d35bfa2f28e7b81ca31e71256974/image-55.jpg "Sample View [Burnside et al. AMIA 05] malignant(A) : birads_category(A, b 5), mass. PAO(A,") Sample View [Burnside et al. AMIA 05] malignant(A) : birads_category(A, b 5), mass. PAO(A, present), masses. Density(A, high), ho_breast. CA(A, hx. DCor. LC), in_same_mammogram(A, B), calc_pleomorphic(B, not. Present), calc_punctate(B, not. Present).
Sample View [Burnside et al. AMIA 05] malignant(A) : birads_category(A, b 5), mass. PAO(A, present), masses. Density(A, high), ho_breast. CA(A, hx. DCor. LC), in_same_mammogram(A, B), calc_pleomorphic(B, not. Present), calc_punctate(B, not. Present).
![View Learning: First Approach [Davis et al. IA 05, Davis et al. IJCAI 05]](https://present5.com/presentation/1429d35bfa2f28e7b81ca31e71256974/image-57.jpg "View Learning: First Approach [Davis et al. IA 05, Davis et al. IJCAI 05]") View Learning: First Approach [Davis et al. IA 05, Davis et al. IJCAI 05] Step 1 Step 2 Target Predicate Rule Learner Rule 1 Learn Step 3 Rule 2 … Rule N Select Build Model
View Learning: First Approach [Davis et al. IA 05, Davis et al. IJCAI 05] Step 1 Step 2 Target Predicate Rule Learner Rule 1 Learn Step 3 Rule 2 … Rule N Select Build Model
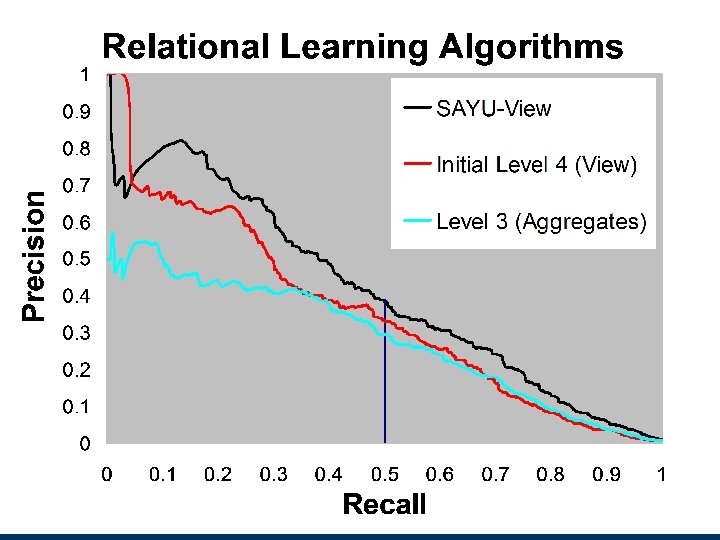
 Drawback to First Approach n Mismatch between Rule building n Model’s use of rules n n Should Score As You Use (SAYU)
![SAYU [Davis et al. ECML 05] n Build network as we learn rules [Landwehr](https://present5.com/presentation/1429d35bfa2f28e7b81ca31e71256974/image-59.jpg "SAYU [Davis et al. ECML 05] n Build network as we learn rules [Landwehr") SAYU [Davis et al. ECML 05] n Build network as we learn rules [Landwehr et al. AAAI 2005] n n Score rule on whether it improves network Results in tight coupling between rule generation, selection and usage
SAYU [Davis et al. ECML 05] n Build network as we learn rules [Landwehr et al. AAAI 2005] n n Score rule on whether it improves network Results in tight coupling between rule generation, selection and usage
 SAYU-NB Class Value 0. 35 0. 10 0. 12 Score = 0. 02 … Rule 14 seed 1 2 Rule 2 1 Rule 3 Rule N
![SAYU-View [Davis et al. Intro to SRL 06] Class Value … … Feat 1](https://present5.com/presentation/1429d35bfa2f28e7b81ca31e71256974/image-61.jpg "SAYU-View [Davis et al. Intro to SRL 06] Class Value … … Feat 1") SAYU-View [Davis et al. Intro to SRL 06] Class Value … … Feat 1 Feat N Agg 1 … Agg M Rule 1 Rule L
SAYU-View [Davis et al. Intro to SRL 06] Class Value … … Feat 1 Feat N Agg 1 … Agg M Rule 1 Rule L
 Keep a rule:") Parameter Settings n n n Score using AUC-PR (recall >=. 5) Keep a rule: 2% increase in AUC Switch seeds after adding a rule Train set to learn network structure and parameters Tune set to score structures
Parameter Settings n n n Score using AUC-PR (recall >=. 5) Keep a rule: 2% increase in AUC Switch seeds after adding a rule Train set to learn network structure and parameters Tune set to score structures
 Electronic Medical Record Patient. ID Date Patient. ID Gender Birthdate P 1 M Patient. ID Date P 1 Patient. ID P 1 P 1 3/22/63 Lab Test Result 1/1/01 blood glucose 1/9/01 blood glucose Date Prescribed 5/17/98 42 45 Physician Symptoms 1/1/01 2/1/03 Smith Jones Diagnosis palpitations hypoglycemic fever, aches influenza Patient. ID SNP 1 SNP 2 … SNP 500 K P 1 P 2 AA AB AB BB BB AA Date Filled Physician Medication Dose Duration 5/18/98 Jones prilosec 10 mg 3 months
 Cox Inhibition n n Non-steroidal anti-inflammatory drug Cox-2 goal: reduce stomach trouble Cox-1 Aspirin, Aleve, Ibuprofen, etc block both pathways Cox-2 Vioxx, Bextra, Celebrex block this pathway
 Cox-2 Timeline Dec. 1998 -May 1999, Celebrex, Vioxx approved 2002, Beginning of APPROVe Study Dec. 2004, FDA issues warning 2001, Cox-2 sales top $6 billion/year in US Sept 2004, Vioxx voluntarily pulled from market April 2005, FDA removes Bextra from market
 Predicting Adverse Reaction to Cox-2 Inhibitors Given: A patient’s clinical history Do: Predict whether the patient will have a myocardial infarction (MI) Note: This is work in progress
 Data n n 492 patients who took Cox-2, MI 77077 patients who took Cox-2, no MI n n Sub-sampled 651 patients Relational tables for Lab tests n Drugs taken n Diagnoses n Observations n
 Q: What Data to Use? n n All data for a patient? Many perfect predictors Cut off data right before MI Model not relevant pre-Cox 2 ib n Uniformly more data for non-MI cases n n Our choice: cut off data for each patient at first Cox 2 ib prescription
 Approaches Tried n n n Propositional: Linear SVM, naïve Bayes, TAN, trees, boosted rules Relational: Inductive Logic Programming (ILP) system Aleph SRL: View learning with SAYU
 Experimental Methodology n 10 -fold cross validation n Feature selection pick top 50/fold n ROC curves to evaluate n Paired t-test for significance
") Algorithms Compared n Naïve Bayes Best feature vector approaches n Boosted rules (C 5) n SAYU-TAN (w/initial feature set) Note: Preliminary results with Aleph were poor/slow
Algorithms Compared n Naïve Bayes Best feature vector approaches n Boosted rules (C 5) n SAYU-TAN (w/initial feature set) Note: Preliminary results with Aleph were poor/slow
 Algorithm Comparison
 ROC Area
 : hasdrug(A, GLUCOSE), diagnosis(A, ischemic heart disease).") Sample Rule n myocardial_infarction(A) : hasdrug(A, GLUCOSE), diagnosis(A, ischemic heart disease).
Sample Rule n myocardial_infarction(A) : hasdrug(A, GLUCOSE), diagnosis(A, ischemic heart disease).
 : diagnosis(A, B, INFECTIOUS AND PARASITIC DISEASES), before(B, 10/26/1982), age(A,") Sample Rule n myocardial_infarction(A) : diagnosis(A, B, INFECTIOUS AND PARASITIC DISEASES), before(B, 10/26/1982), age(A, B, C), younger(C, 51).
Sample Rule n myocardial_infarction(A) : diagnosis(A, B, INFECTIOUS AND PARASITIC DISEASES), before(B, 10/26/1982), age(A, B, C), younger(C, 51).
 Lingering Questions n Are we predicting predisposition to MI? n Can we do better with data we have? n How much will genotype data help?
 Conclusions n EMRs and genotyping give machine learning a new opportunity for great impact on healthcare in next few years Personalized medicine n Pharmacovigilance (FDA’s Sentinel, OMOP) n Decision support n n Statistical relational learning helps for some tasks (but not all)
 n Fancy new algorithms not always the best… healthcare applications raise other") Conclusions (Continued) n Fancy new algorithms not always the best… healthcare applications raise other issues Missing data (not missing at random) n Need simple, comprehensible models… clinicians may prefer slightly less accurate model if it makes more sense to them n Different evaluation metrics n
Conclusions (Continued) n Fancy new algorithms not always the best… healthcare applications raise other issues Missing data (not missing at random) n Need simple, comprehensible models… clinicians may prefer slightly less accurate model if it makes more sense to them n Different evaluation metrics n
 Thanks n n n n n Jesse Davis Beth Burnside Vitor Santos Costa Michael Caldwell Peggy Peissig Eric Lantz Jude Shavlik IWPC WGI (Wisconsin Genomics Initiative)