

e1485807026d684587dce41ae2f620ab.ppt
- Количество слайдов: 20
 Location of the High-Latitude Reconnection Site on 14 February 2003 S. Eriksson 1, M. M. Kuznetsova 2, M. W. Dunlop 3, and H. Reme 4 1 LASP, University of Colorado, Boulder, CO, USA 2 NASA/GSFC, Greenbelt, MD, USA 3 Rutherford Appleton Laboratory, Chilton, UK 4 Centre d’Etude Spatiale des Rayonnements, Toulouse, France Contact: eriksson@lasp. colorado. edu
 Outline Northward IMF • Remote Cluster lobe reconnection observations 14 February 2003 1840 -1955 UT (C 1 and C 3) • BATSRUS MHD simulation comparison http: //ccmc. gsfc. nasa. gov [c. f. “Stefan_Eriksson_060905_1”] Summary
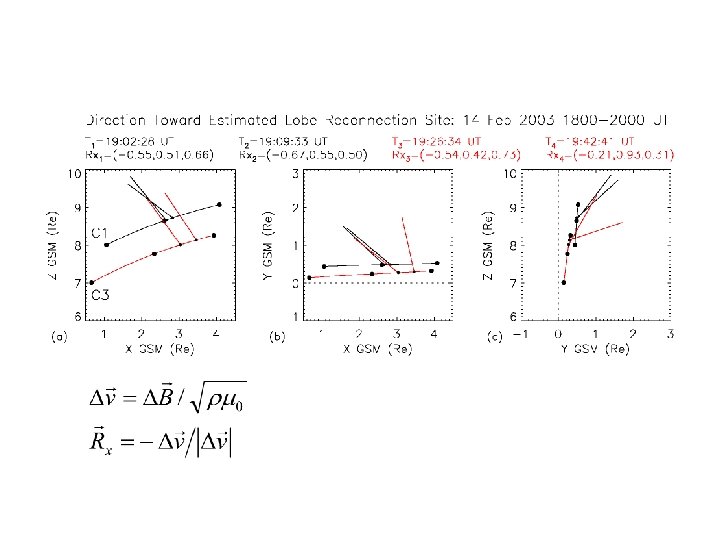
 Summary • The relative location of the magnetopause reconnection site as predicted by MHD simulations is in good agreement with the remote observations by the Cluster s/c. This will be shown for northward IMF conditions during the 14 February 2003 event. • Initial estimates suggest that the angle between Rx and Rs=[Rm-Rc] is 15 -20 o. Here, Rx= - d. V / |d. V|, Rm is the location of the MHD reconnection site and Rc is the Cluster location at the time of the observed jet (d. V). • The actual magnitude of the enhanced plasma velocity due to the jx. B force is off by an order of magnitude (~40 km/s versus ~400 km/s).
![Lobe Reconnection Schematic Dungey [1963] (courtesy of J. C. Dorelli, UNH)](https://present5.com/presentation/e1485807026d684587dce41ae2f620ab/image-4.jpg "Lobe Reconnection Schematic Dungey [1963] (courtesy of J. C. Dorelli, UNH)") Lobe Reconnection Schematic Dungey [1963] (courtesy of J. C. Dorelli, UNH)
Lobe Reconnection Schematic Dungey [1963] (courtesy of J. C. Dorelli, UNH)
 Cluster orbits 1800 -2010 UT Side view 19 View from above 20 UT 18 Solar Direction Cluster C 1 Cluster C 2 Cluster C 3 Cluster C 4 Solar Direction
![Ni [cm-3] T [K] Vx [km/s] Vy [km/s] Vz [km/s] Bx [n. T] By](https://present5.com/presentation/e1485807026d684587dce41ae2f620ab/image-6.jpg "Ni [cm-3] T [K] Vx [km/s] Vy [km/s] Vz [km/s] Bx [n. T] By") Ni [cm-3] T [K] Vx [km/s] Vy [km/s] Vz [km/s] Bx [n. T] By [n. T] Bz [n. T] Northward IMF 18: 30 19: 00 19: 30 20: 00 20: 30 UT Solar Wind Input to BATSRUS MHD Simulation at the CCMC
Ni [cm-3] T [K] Vx [km/s] Vy [km/s] Vz [km/s] Bx [n. T] By [n. T] Bz [n. T] Northward IMF 18: 30 19: 00 19: 30 20: 00 20: 30 UT Solar Wind Input to BATSRUS MHD Simulation at the CCMC
 Cluster C 1 Ni MHD @ C 1 Cluster C 3 MHD @ C 3 Bx By Bz Vx Vy Vz 18: 00 19: 00 20: 00
 Cusp Schematic - Cluster FGM Lobe field Cluster C 1 Cluster C 3 Dayside closed field z x Direction of magnetic field
 Vx Vy Vz Bx By Bz 18: 40 19: 40 20: 40
 Walen Test: Quantitative agreement with high-latitude magnetic reconnection: Northward IMF Vx Vy Vz x-comp y-comp z-comp Bx By Bz Same Cluster C 1 & C 3 data 1840 -2040 UT: Ni & V merged
 How well do these -d. V directions compare with MHD simulation results of Vx and B?
 MHD Simulation Northward IMF YZ GSM Plane 1900 UT B Vx J|| Vy Cluster C 1 position ~1800 -1900 UT
 Northward IMF MHD Simulation XZ GSM Plane at 1900 UT Vx Vy B P
 Northward IMF: Vx -d. V for northward IMF -d. V for southward IMF
 Northward IMF: B -d. V for northward IMF -d. V for southward IMF
 Northward IMF MHD Simulation XZ GSM Plane at 1900 UT Vx jx. B vectors shown on top Vx and Vy Vy
 Northward IMF MHD Simulation XZ GSM Plane at 1900 UT Vx jx. B vectors shown on top Vx and Vy …. field lines shown as well Vy
 Summary • The relative location of the magnetopause reconnection site as predicted by MHD simulations is in good agreement with the remote observations by the Cluster s/c. This was shown for northward IMF conditions during the 14 February 2003 event. • Initial estimates suggest that the angle between Rx and Rs=[Rm-Rc] is 15 -20 o. Here, Rx= - d. V / |d. V|, Rm is the location of the MHD reconnection site and Rc is the Cluster location at the time of the observed jet (d. V). • The actual magnitude of the enhanced plasma velocity due to the jx. B force is off by an order of magnitude (~40 km/s versus ~400 km/s).
 Walen Test: Quantitative agreement with high-latitude magnetic reconnection magnetosheath Bn magnetotail lobe z x