

d40d45e0c88aa9cee39de4be5d103b4d.ppt
- Количество слайдов: 92
 “LIPOMICS” David C. White, MD, Ph. D, milipids@aol. com, 865 -974 -8001 Current team: Peacock. A. D. , C. Lytle, Y-J. Chang, Y-D. Gan, J. Cantu, K. Salone, L. Kline, J. Bownas, S. Pfiffner, R Thomas Collaborators in the last 48 Months: A my, Penny S. , Univ. Nevada (Las Vegas); Appelgate, Bruce, UTK; Balkwill, David L. , Florida State Univ. ; Bienkowski, Paul R. , UTK; Bjornstad, B. N. , DOE PNNL; Boone, David R. , Univ. Portland (Oregon); Brockman, Fred J. , DOE PNNL; Coleman, Max L. , Univ. Reading (UK); Colwell, Fredrick S. , DOE INNEL; Curtis, Peter S. , Univ. Michigan; Davis, Wayne T. , UTK; De. Flaun, Mary F. , Envirogen; Dever, Molly, UTK; Eagenhouse, Robert, USGS, Reston; Fayer, Ronald, USDA (Beltsville); Flemming, Hans-Kurt, Univ. of Druisberg (Germany); Fredrickson, James K. , DOE , PNNL; Geesey, Gill G. , Montana State Univ. ; Ghiorse, William C. , Cornell, Univ. ; Griffin, Tim, Golder Associates; Griffiths, Robert. P. , Univ. Oregon; Gsell, T. C. , DOE PNNL; Guezennec, Jon. G. , IFMER (Brest, France); Haldeman, Dana S. , Univ. Nevada (Las Vegas); Heitzer, Armin, ABB Consulting (Zurich Switzerland); Hersman, Larry E. , DOE Los Alamos; Holben, William E. , Univ. , Montana; Kaneshiro, Edna S. , Univ. Cincinnati; Kieft, Thomas L. , New Mexico State Univ. ; Kjelleberg, Stephan, Univ. New South Wales (Australia); Krumholtz, Lee R. , Univ. Oklahoma; Larsson, Lennart, Univ. Lund (Sweden); Lehman, Robert M. , DOE INEEL; Li, S-M. , DOE PNNL; Little, Brenda, Naval Research Lab. Stennis; Lovell, Charles R. , Univ. South Carolina; Mc. Donald, E. V. , DOE PNNL; Mc. Kinley, James P. , DOE PNNL; Murphy, Ellen M. , DOE PNNL; Nichols, Peter. D. , CSIRO (Hobart, Taz); Nierzwicki-Bauer, S. A. , Rensselaer Polytec. Inst. ; Nold, Steven C. , Montana State Univ. ; Norby, Robert J. , DOE ORNL; O'Neill, Eugena G. , DOE ORNL; O'Neill, Robert V. , DOE ORNL: Onstott, T. C. , Princeton Univ. ; Palumbo, Anthony V. , DOE ORNL; Pfiffner, Susan M. , DOE ORNL; Phelps, Tommy J. , DOE ORNL; Pregitzer, K. S. , Michigan Univ. ; Randlett, D. L. , DOE INEEL; Rawson, Sally, A. , DOE INNEL; Ringelberg, David B. , US Army Corps of Engineers Watershed Experiment Station; Rogers, Rob, DOE, INEEL; Russell, Bert, Golder Associates; Sayler, Gary S. , UTK; Schmitt, Jurgen, University of Druisberg (Germany); Stevens, Todd O. , DOE PNNL; Suflita, Joseph M. , Univ. , Oklahoma; Sutton, Sue D. , Miami Univ. (Ohio); Venosa, Albert. D. , USEPA (Cincinnati); Whitaker Kylen W. , Microbial Insights, Inc. ; Wobber, Frank J. DOE (Germantown); Wolfram, James W. , DOE INEEL; Zac, Donald R. , Univ. , Michigan; Zogg, G. P. , Univ. Michigan. Associated post doctoral, and student advisees of White in last 5 years Almeida, J. S. , Univ. Lisbon, Portugal; Angell, Peter, Canadian Atomic Energy Commission; Burkhalter, Robert S. , UTK; Chen, George, Vapor Technologies, Inc. , Co. ; Kehrmeyer, Stacy, DOE LLNL; Lou, Jung. S. , US Patent Office; Macnaughton, Sarah, J. , UTK; Nivens, David E. , UTK; Palmer, Robert J. , UTK; Phiefer, Charles B. , Celmar MD; Pinkart, Holly C. , Univ. Central Washington; Rice, James F. , UTK; Smith, Carol A. , UTK; Sonesson, Anders, Univ. Lund Sweden; Stephen, John R. , UTK; Tunlid, Anders, Univ. Lund Sweden; Webb, Oren. F. , DOE ORNL; Zinn, Manfred, Harvard.
 “LIPOMICS” Inception: 1972 U. Kentucky Med Center Biochemistry of membrane bound electron transport system including lipids ( GC) Florida State Univ. Marine & Estuarine Lab microbial ecology PLFA of detrital biofilms Note shifts in membrane lipids with growth conditions in monocultures Fungus Heaven & Hell otherwise ignored as “too difficult and chemical”. Myron Sasser at Delaware carefully grew plant and then clinical isolates with rigidly standardized conditions, extracted, did acid hydrolysis, methylated and identified on capillary GC. HP developed pattern recognition algorithm for 4 major peaks and he developed a large library (10, 000 strains) now founded MIDI (0 M for HP) international company. Myron says DC got famous Myron got Rich 1991 Andrew B. White founded Microbial Insights, Inc to do PLFA & DNA in environmental matrices commercially 1999 sold Microbial Insights, Inc.
 “LIPOMICS” Inception: MIDI 1. Requires isolate grown under standard conditions 2. Economical Not need MS to identify analytes can do analyses $30/sample and make money. 3. Now Automated Quick ~identify in 30 min 4. Specific tells E. coli from Salmonella if isolate grown under standard conditions 5. Unknown organisms have been a disaster miss 99. 9% of the cells in a soil or sediment often the dominants 6. Excellent way to quickly tell if new isolates are identical PLFA 1. Much more specific Extract lipid the fractionate on silicic acid column into neutral lipids, Phospholipids, and residue lipids requiring hydrolysis before extraction LPS, spores etc. 2. Mild alkaline methanolysis vs acid hydrolysis Transesterify only Esters 3. (need mild acid to find Plasmalogen vinyl ethers) 4. 3. Identify analytes with MS vs adding pig fat to the sample 5. 4. Requires days, expensive equipment, compulsive analysts $300/sample
 “LIPOMICS” Development: ~ Effectiveness methods, resources & tools limited Establish interpretation in environmental samples with 8000 species/g 1. Add a microbe and recover it 13 C labeled or with distinctive lipids [Sphingomonas] 2. Manipulate and detect expected responses Anaerobic Aerobic Anaerobic Sulfate [SRB] & DSR genes Aerobic Anaerobic Nitrate nif. S, nif. X, nox. E genes Aerobic Anaerobic + Acetate & Fe(III), U (III) Geobacter 3 OH 21, r. DNA Aerobic Anaerobic + Hydrogen + molybdate Methanogens (ether lipids) 3. Manipulate with toxins, p. H, antibiotics Fungus heaven vs Fungus Hell, hydrocarbons, pesticides, or PCB expected response 4. Add specific predators protozoa, amphipods, bacteriophage specific disappearance 5. Correspondence of r. DNA and signature lipids derived from isolates
 “LIPOMICS” Current Status: [a[pplication limited by, analytical skill, equipment Cost, time & arcane literature for intrepretation Most comprehensive, rapid, quantitative, measure of in-situ microbial communities Combines phenotypic and genotypic responses “Cathedral from a brick” 1. Viable & Total Microbial Biomass, Community Composition, Physiological Status 2. Rhizosphere & defining forest biodiversity 3. Waste treatment effectiveness monitoring 4. Validating source of deep subsurface microbiota 5. Defining food sources & effectiveness of utilization (with 13 C “) 6. Monitoring bioremediation effectiveness & defensible treatment endpoints 7, Multi-species toxicological assessment 8. Ultrasensitive detection of biomarkers forward contamination of spacecraft 9. 9. Quantitatively defining soil quality and effects of tilth 10. Monitoring carbon sequestration in soils 11. Rapid detection of biocontamination & antigenic immune potentiators in indoor air 12. Rapid detection and monitoring of contamination in drinking water biofilms 13. Detecting pathogens in microbial consortia & food 14. Defining food source effectiveness [Triglyceride/sterol or PLFA] 15. Defining disturbance artifacts in soils and sediments [PHA/PLFA] 16. Lipid extraction purifies DNA for PCR
![Signature Lipid Biomarker Analysis Phospholipid Fatty Acid [PLFA] Biomarker Analysis = Single most](https://present5.com/presentation/d40d45e0c88aa9cee39de4be5d103b4d/image-6.jpg "Signature Lipid Biomarker Analysis Phospholipid Fatty Acid [PLFA] Biomarker Analysis = Single most") Signature Lipid Biomarker Analysis Phospholipid Fatty Acid [PLFA] Biomarker Analysis = Single most quantitative, comprehensive insight into insitu microbial community Why not Universally utilized? 1. Requires 8 hr extraction with ultrapure solvents [emulsions]. 2. Ultra clean glassware [incinerated 450 o. C]. 3. Fractionation of Polar Lipids 4. Derivatization [transesterification] 5. GC/MS analysis ~ picomole detection ~ 104 cells LOD 6. Arcane Interpretation [Scattered Literature] 7. 3 -4 Days and ~ $250
Signature Lipid Biomarker Analysis Phospholipid Fatty Acid [PLFA] Biomarker Analysis = Single most quantitative, comprehensive insight into insitu microbial community Why not Universally utilized? 1. Requires 8 hr extraction with ultrapure solvents [emulsions]. 2. Ultra clean glassware [incinerated 450 o. C]. 3. Fractionation of Polar Lipids 4. Derivatization [transesterification] 5. GC/MS analysis ~ picomole detection ~ 104 cells LOD 6. Arcane Interpretation [Scattered Literature] 7. 3 -4 Days and ~ $250
 “LIPOMICS” Future: Automated sequential extraction tandem MS detection of Lipid Biomarkers DNA / m. RNA with arrays coupled data bases & GPS map 20 min? Analysis of microbial contamination & insight into infectivity Ft. Johnson Seminar Clinical & Veterinary Monitor Airports Buses, Ports to data base CBW Defense Food Safety, Indoor Air vs adult Asthsma & Sick Building Syndrome Monitor exhaled breath (capture in silicone bottle) GC/TOFMS Monitor bioremediation, use in-situ microbial community define end points ~ multispecies, multi trophic levels Monitor effects of GMO plants Drugs, hormones, endocrine disrupters, antibiotics are most often hydrophobic as they interact with the membranes of cells. collect biofilms (act as solid phase extractor) analyze with HPLC/ES/MS/MS Urban watershed monitoring & Toilet to Tap
 for") “LIPOMICS” Tools: Thou shall know structure & concentration of each analyte Progress (equipment) for speed, specificity, selectivity and sensitivity) Extraction 1. Extraction high pressure/temperature faster more complete 2. Supercritical CO 2 pressure becomes gas directly into MS inlet 3. Sequential saves time & effort Chromatography 1. GC high pressure , 0. 1 mm controlled flow, > resolution & faster 2. SFC not much used 3. HPLC smaller diameter, Chiral, 4. CZE high resolution, requires charge, presently difficult 5. Detection (lipids generally lack chromophores) 6. NMR insensitive, expensive, 7. Laser fluorescence not as specific but incredibly sensitive 8. Light scattering cheep & nonspecific 9. Mass Spectrometry 10. Ionization 11. Electron impact 70 e. V known structure catalogue but inefficient 12. Electrospray the dream but needs charged analyte ~ 100%
“LIPOMICS” Tools: Thou shall know structure & concentration of each analyte Progress (equipment) for speed, specificity, selectivity and sensitivity) Extraction 1. Extraction high pressure/temperature faster more complete 2. Supercritical CO 2 pressure becomes gas directly into MS inlet 3. Sequential saves time & effort Chromatography 1. GC high pressure , 0. 1 mm controlled flow, > resolution & faster 2. SFC not much used 3. HPLC smaller diameter, Chiral, 4. CZE high resolution, requires charge, presently difficult 5. Detection (lipids generally lack chromophores) 6. NMR insensitive, expensive, 7. Laser fluorescence not as specific but incredibly sensitive 8. Light scattering cheep & nonspecific 9. Mass Spectrometry 10. Ionization 11. Electron impact 70 e. V known structure catalogue but inefficient 12. Electrospray the dream but needs charged analyte ~ 100%
 “LIPOMICS” Tools: Thou shall know structure & concentration of each analyte Mass Spectrometry Ionization EI Electron impact 70 e. V known structure catalogue but inefficient ES Electrospray the dream but needs charged analyte ~100% APCI less sensitive not require charge Photometric APCI potential mild “booster” + light SIMS to map Phospholipids have that charge Detection Quadrupole slow and good to 3000 m/z MS/MS sensitive chemical noise MRM ITMS (MS)n sensitive. Exploring TOFMS Speed increases scans sensitivity & resolution, m/z 200 K Q/TOF Sequence on the fly but 650 K FTMS mass resolution to 0. 0000001 , large capacity in trap, expensive, difficult require superconducting magnet & often not working Data Analysis Jonas Almeida comprehensiveness of ANN ~ PLFA, Neutral Lipids, r. DNA functional genes, activity measures Biolog (samples “weeds”)
 Q-1 ESI/MS/MS CAD Q-3") ESI (cone voltage) Q-1 ESI/MS/MS CAD Q-3
ESI (cone voltage) Q-1 ESI/MS/MS CAD Q-3
 PE-Sciex API 365 HPLC/ESI/MS/MS Functional Sept 29, 2000
 Lipid Biomarker Analysis Expanded Lipid Analysis Greatly Increase Specificity ~ Electrospray Ionization ( Cone voltage between skimmer and inlet ) In-Source Collision-induced dissociation (CID) Tandem Mass Spectrometry Scan Q-1 CID* Q-3 Difference Product ion Fix Vary Precursor ion Vary Fix Vary Neutral loss Vary Fix Neutral gain Vary Fix MRM Fix (Multiple Reaction Monitoring) *Collision-induced dissociation (CID) is a reaction region between quadrupoles
 Smaller, Least Expensive, >Sensitive (full") Tandem Mass Spectrometers Ion trap MSn (Tandem in Time) Smaller, Least Expensive, >Sensitive (full scan) Quadrupole/TOF > Mass Range, > Resolution MS/CAD/MS (Tandem in Space) 1. True Parent Ion Scan to Product Ion Scan 2. True Neutral Loss Scan 3. Generate Neutral Gain Scan 4. More Quantitative 5. > Sensitivity for MRM 6. > Dynamic Range JPL CEB
Tandem Mass Spectrometers Ion trap MSn (Tandem in Time) Smaller, Least Expensive, >Sensitive (full scan) Quadrupole/TOF > Mass Range, > Resolution MS/CAD/MS (Tandem in Space) 1. True Parent Ion Scan to Product Ion Scan 2. True Neutral Loss Scan 3. Generate Neutral Gain Scan 4. More Quantitative 5. > Sensitivity for MRM 6. > Dynamic Range JPL CEB
 LIPIDS Lipids 1. Defined by process as Cellular components extracted from by organic solvents 2. Diverse Chemical Structure characterized by hydrophobic properties 3. Relatively small molecules compared to Biopolymers [molecular weights < 2000] 4. Not with properties of the Biopolymer macromolecules Polysaccharides, Nucleic Acids, Proteins
 LIPIDS PROBLEM IN Assessing the microbes : 1. The largest and most critical biomass on Earth is essentially invisible Earth did well (Geochemical Cycles maintaining disequilibrium) for 3 billion years without multicellular eukaryotes 2. Methods Limited Classical plate counts miss 99. 9%, NPN need to grow and be isolated from matrices into single cells, VBNC common 3. Morphology not define function Direct counts need. > 104 to detect matricides often fluorescent 4. Live as multispecies biofilms with interactions and communication 5. Disturbance artifact ~live like coiled spring waiting for nutrient
 LIPIDS A Solution look for biomarkers : 1. Not persist with death of cells ATP. DNA, RNA, Enzymes, Uronic acid polymers, Cell walls, neutral lipids (petroleum) , lignin, KDO, Muramic Acid all found outside of cells and persist POLAR LIPIDS ~ Metabolically Labile not found in petroleum 2. Universally present in the same ~ amount /cell ~pmol in 2 -6 x 10⁴ cells size of E. coli 3. Structurally diverse enough to provide insight into composition Bacteria make ~ 1000 Fatty acids, eukaryotes (except plant seeds) ~ 100; Diverse structures-- rings, branches, amides, ethers, . . . 4. Present at measurable quantities & be Readily determined HPLC/ES/MS/MS, ~ 10 -16 moles/ L GC/MS, ~ 10 -9 moles/ L GC/TOFMS ? 10 --12 moles/ L ? ?
![LIPIDS Intact lipid membrane a necessary but not sufficient criteria of life [ON Earth]](https://present5.com/presentation/d40d45e0c88aa9cee39de4be5d103b4d/image-17.jpg "LIPIDS Intact lipid membrane a necessary but not sufficient criteria of life [ON Earth]") LIPIDS Intact lipid membrane a necessary but not sufficient criteria of life [ON Earth] 1. Cannot have a functional cell without an intact lipid membrane Phospholipid Diglyceride evidence of cell lysis deeper in the subsurface the > the diglyceride to phospholipid ratio 2. Intact membrane ~ Lipids form micelles in water [not living] Micelles do not show orderly reproduction & evolution Micelles do not have porins and show transport Micelles do not maintain disequilibrium > Donnan Equilibrium Usually not all the same size & do not move Why is the lipid composition so exact in each species of bacteria when enzymes requiring lipids for function can be relatively nonspecific?
LIPIDS Intact lipid membrane a necessary but not sufficient criteria of life [ON Earth] 1. Cannot have a functional cell without an intact lipid membrane Phospholipid Diglyceride evidence of cell lysis deeper in the subsurface the > the diglyceride to phospholipid ratio 2. Intact membrane ~ Lipids form micelles in water [not living] Micelles do not show orderly reproduction & evolution Micelles do not have porins and show transport Micelles do not maintain disequilibrium > Donnan Equilibrium Usually not all the same size & do not move Why is the lipid composition so exact in each species of bacteria when enzymes requiring lipids for function can be relatively nonspecific?
 LIPID Biomarker Analysis 1. Intact Membranes essential for Earth-based life 2. Membranes contain Phospholipids 3. Phospholipids have a rapid turnover from endogenous phospholipases. 4. Sufficiently complex to provide biomarkers for viable biomass, community composition, nutritional/physiological status 5. Analysis with extraction provides concentration & purification 6. Structure identifiable by Electrospray Ionization Mass Spectrometry at attomoles/u. L (near single bacterial cell) 7. Surface localization, high concentration ideal for organic SIMS mapping localization
 VIABLE NON-VIABLE O O || || O H 2 COC phospholipase") Membrane Liability (turnover) VIABLE NON-VIABLE O O || || O H 2 COC phospholipase || | cell death C O CH O | | || H 2 C O H H 2 C O P O CH 2 CN+ H 3 | Neutral lipid, ~DGFA OPolar lipid, ~ PLFA
Membrane Liability (turnover) VIABLE NON-VIABLE O O || || O H 2 COC phospholipase || | cell death C O CH O | | || H 2 C O H H 2 C O P O CH 2 CN+ H 3 | Neutral lipid, ~DGFA OPolar lipid, ~ PLFA
 Bacterial Phospholipid ester linked fatty acids -CH 2 - CH=CH cis Monoenoic -CH 2 Isomer conformation CH 3(CH 2)XCH=CHCH 2 CH(CH 2)YCOOH 0 H OH, = position Microbial Insights, Inc. JPL CH=CH CH 2 trans -CH 2 CHCHCH 2 cyclopropyl CEB
 Bacterial Phospholipid ester-linked fatty acids CH 3 RCH 2 CH CH 3 iso RCH 2 CH 3 | CH 3 anteiso Methyl Branching Microbial Insights, Inc. RCH 2 CH 2 R’ | CH 3 mid-chain JPL CEB
 Biofilm Community Composition Detect viable microbes & Cell-fragment biomarkers : Legionella pneumophila, Francisella tularensis, Coxellia burnetii, Dienococcus, PLFA oocysts of Cryptosporidium parvum, Fungal spores PLFA Actinomycetes Me-br PLFA Mycobacteria Mycocerosic acids, (species and drug resistance) Sphingomonas paucimobilis Sphingolipids Pseudomonas Ornithine lipids Enterics LPS fragments Clostridia Plasmalogens Bacterial spores Dipicolinic acid Arthropod Frass PLFA, Sterols Human desquamata PLFA, Sterols Fungi PLFA, Sterols Algae Sterols, PLFA, Pigments
 In-situ Microbial Community Assessment What do you want to know? Characterization of the microbial community: 1. Viable and Total biomass ( < 0. 1% culturable & VBNC ) 2. Community Composition General + proportions of clades Specific organisms (? Pathogens) Functional groups [Signature Lipids]-Specific Strains [PCR-DGGE] 3. Physiological/Nutritional Status ~ Evidence for Almeida Manifesto Cathedral from a brick 4 Metabolic Activities (Genes +Enzymes + Action) Consequences of Activities = Gene frequency & Phenotypic Responses vs the Disturbance Artifact 5. Community Interactions & Communications
 Signature Lipid Biomarker Analysis Microniche Properties from Lipids 1. Aerobic microniche/high redox potential. ~ high respiratory benzoquinone/PLFA ratio, high proportions of Actinomycetes, and low levels of i 15: 0/a 15: 0 (< 0. 1) characteristic of Gram-positive Micrococci type bacteria, Sphinganine from Sphingomonas 2. Anaerobic microniches ~high plasmalogen/PLFA ratios (plasmalogens are characteristic Clostridia), the isoprenoid ether lipids of the methanogenic Archae. 3. Microeukaryote predation ~ high proportions of phospholipid polyenoic fatty acids in phosphatidylcholine (PC) and cardiolipin (CL). Decrease Viable biomass (total PLFA) 4. Cell lysis ~ high diglyceride/PLFA ratio.
 Signature Lipid Biomarker Analysis Microniche Properties from Lipids 5. Microniches with carbon & terminal electron acceptors with limiting N or Trace growth factors ~ high ( > 0. 2) poly β-hydroxyalkonate (PHA)/PLFA ratios 6. Microniches with suboptimal growth conditions (low water activity, nutrients or trace components) ~ high ( > 1) cyclopropane to monoenoic fatty acid ratios in the PG and PE, as well as greater ratios of cardiolipin (CL) to PG ratios. 7. Inadequate bioavailable phosphate ~ high lipid ornithine levels 8. Low p. H ~ high lysyl esters of phosphatidyl glycerol (PG) in Gram-positive Micrococci. 9. Toxic exposure ~ high Trans/Cis monoenoic PLFA
 Capillary GC PLFA 20 m x 0. 1 mm i. d. x 0. 1 m film thickness, 0. 3 ml/min flow rate Quadrupole MS 41 -450 m/z scan, 1. 84 scan/sec ~av. Peak = 6 sec /sec 11 scans. TOFMS 6 sec = 280, 000 scans resolution & sensitivity ~ 50 times greater EI off during solvent elution
 Details of GC/MS tracing showing deconvolution of PLFA
 LIPIDS –DATA ANAYSIS Problem: PLFA Analysis is like comparing spectra Few replications but huge data load/sample 1. Classic Statistics likes replications of simple data ~ group data in rational clusters 2. Do replications then test the variance between them perform ANOVA Assumes variables are independent and form a normal distribution 3. Do a Tukeys post hoc test for more stringent test of significant difference to control better for chance in large replications 4. Assume Linear Relationships and display graphically with: Hierarchical Cluster Analysis Principal components Analysis PCA Essentially a huge correlation matrix
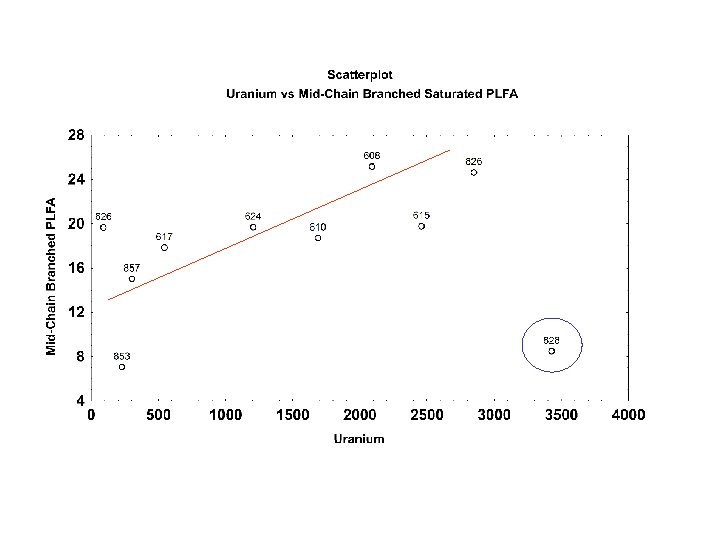
 PCA 2 Analysis of Forest Community Soil total PLFA October 2 -1 PCA Analysis Sugar Maple. Basswood Black Oak White Oak Sugar Maple- Red Oak 1 -1 PCA 1 August 1 -1 -1
 LIPIDS-DATA ANALYSIS Problem: PLFA Analysis is like comparing spectra Few replications but huge data load/sample 5. Assume non-Linear Relationship ANN Use data for training to generate a Artificial neural network using nodes for interactions. If relatively few nodes are required easier to interpret Predictability is the test and with “training” gets better and better but must test for ‘OVERTRAINING” ie memorization Perform a sensitivity analysis ~ components contribute most to predictability Now map on a surface to explore spatial and temporal interactions
 ANN Analysis of CR impacted Soil Microbial Communities 1. Cannelton Tannery Superfund Site, 75 Acres on the Saint Marie River near Sault St. Marie, Upper Peninsula, MI 2. Contaminated with Cr+3 and other heavy metals between 1900 -1958 by the Northwestern Leather Co. 3. Cr+3 background ~10 -50 mg/Kg to 200, 000 mg/Kg. 4. Contained between ~107 -109/g dry wt. viable biomass by PLFA; no correlation with [Cr] (P>0. 05) 5. PLFA biomass correlated (P<001) with TOM &TOC but not with viable counts (P=0. 5) -CEB
 Wooded Wetland Grassy Wetland Swampy/Cattails Woodland Running Water Grass Pond Beach Removed A Cannelton Tannery Superfund Site
 ND 1 -50 51 -100 101 -500 501 -1, 000 1, 001 -2, 000 2, 001 -3, 000 3, 001 -5, 000 5, 001 -7, 000 7, 001 -10, 000 10, 001 -25, 000 25, 001 -50, 000 50, 001 -75, 000 75, 001 -100, 000 100, 001 -300, 000 Cr+3 Concentrations Site map
") Total Biomass (~108 cells)
Total Biomass (~108 cells)
 Biomarkers for Sulfate/metal reducing bacteria NABIR
 Metabolic stress “Stress” biomarkers NABIR
 Eukaryote PLFA Principal components analysis~ associated with wetlands, eukaryote biomarkers and bacterial stress markers
: ~ 6 x 10⁷ to 109 • •") Summary: Biomass • Biomass (bacterial abundance): ~ 6 x 10⁷ to 109 • • cells gram-1. No correlation between [Cr] and total biomass (P>0. 05) • Viable cell counts were between 1 -3 orders of magnitude lower than bacterial abundance from PLFA • Biomass (PLFA) correlated positively with both TOM and TOC (P<0. 001)
Summary: Biomass • Biomass (bacterial abundance): ~ 6 x 10⁷ to 109 • • cells gram-1. No correlation between [Cr] and total biomass (P>0. 05) • Viable cell counts were between 1 -3 orders of magnitude lower than bacterial abundance from PLFA • Biomass (PLFA) correlated positively with both TOM and TOC (P<0. 001)
![Summary: community composition/physiological status • Significant shifts in PLFA profiles with [Cr] • [10](https://present5.com/presentation/d40d45e0c88aa9cee39de4be5d103b4d/image-40.jpg "Summary: community composition/physiological status • Significant shifts in PLFA profiles with [Cr] • [10") Summary: community composition/physiological status • Significant shifts in PLFA profiles with [Cr] • [10 me 16: 0] (sulfate/metal reducers) peaked at 103 mg kg-1 Cr • No clear pattern was determined between bacterial sequence identity (from PCR/DGGE) and increasing [Cr] • Bacterial Stress markers (18: 1 7 t/18: 1 7 c) increased at the higher [Cr] • PCA - association between [Cr] and wetlands, biomarkers for eukaryotes and “stress”. Needs a different analysis.
Summary: community composition/physiological status • Significant shifts in PLFA profiles with [Cr] • [10 me 16: 0] (sulfate/metal reducers) peaked at 103 mg kg-1 Cr • No clear pattern was determined between bacterial sequence identity (from PCR/DGGE) and increasing [Cr] • Bacterial Stress markers (18: 1 7 t/18: 1 7 c) increased at the higher [Cr] • PCA - association between [Cr] and wetlands, biomarkers for eukaryotes and “stress”. Needs a different analysis.
 ANN are universal predictors Schematic architecture of a three layer feedforward network used to associate microbial community typing profiles (MCT) with classification vectors. Symbols correspond to neuronal nodes Capable of learning from examples Generalization is assured by cross-validation
 Good Predictive Accuracy at > 100 mg Cr+3 /Kg 1 E+006 slope = 1. 09 Predicted Cr 3+ concentration (mg Kg-1) 100000 R 2 = 0. 98 10000 100 training set validation set regression identity 10 1 1 10 10000 Observed Cr 3+ concentration (mg Kg-1) 100000 1 E+006
![Sensitivity analysis ranks the inputs by importance in predicting [Cr+3] PLFA have a significant](https://present5.com/presentation/d40d45e0c88aa9cee39de4be5d103b4d/image-43.jpg "Sensitivity analysis ranks the inputs by importance in predicting [Cr+3] PLFA have a significant") Sensitivity analysis ranks the inputs by importance in predicting [Cr+3] PLFA have a significant larger predictive value than environment parameters (marked with arrows). PLFA profiles are a can be used as a general purpose biosensor
Sensitivity analysis ranks the inputs by importance in predicting [Cr+3] PLFA have a significant larger predictive value than environment parameters (marked with arrows). PLFA profiles are a can be used as a general purpose biosensor
 Biological systems are so complex that prediction of function from the composition of system components is inversely proportional to the distance to the function itself OR It’s hard to see the forest for the trees! One cannot easily predict if a brick (DNA) will be used to build a cathedral or a prison but the structure of the windows will tell. BUT Cellular membranes are in contact with the environment and the intracellular space. So Cellular membranes are in contact with the environment and the intracellular space. Cellular membranes are in contact with the environment and the int PLFA is an ideal sensor of the environmental composition and the biological response, e. g. degree of contamination by a pollutant and its bioremediation.
 20% of the") ANN Analysis of CR impacted Soil Microbial Communities SENSITIVITY (from ANN) 20% of the variables accounted for 50% of the predictive of Cr+3 concentration Of these 20 %: 18: 1 w 9 c (6. 6%) Eukaryote (Fungal) correlated with 18: 2 6 (P<0. 02) 10 Me 16: 0 (2. 5%) correlated with i 17: 0 (4. 8), 16: 1 11 c (2. 9), i 15: 0 (3. 1) (P<0. 001). Thus all are most likely indicative of SRBs or MRBs. 18: 1 7 c (4. 6%) = Gram negative bacteria 10 Me 18: 0 (4. 3%) (Actinomycetes) NABIR -CEB
ANN Analysis of CR impacted Soil Microbial Communities SENSITIVITY (from ANN) 20% of the variables accounted for 50% of the predictive of Cr+3 concentration Of these 20 %: 18: 1 w 9 c (6. 6%) Eukaryote (Fungal) correlated with 18: 2 6 (P<0. 02) 10 Me 16: 0 (2. 5%) correlated with i 17: 0 (4. 8), 16: 1 11 c (2. 9), i 15: 0 (3. 1) (P<0. 001). Thus all are most likely indicative of SRBs or MRBs. 18: 1 7 c (4. 6%) = Gram negative bacteria 10 Me 18: 0 (4. 3%) (Actinomycetes) NABIR -CEB
 ANN Analysis of CR impacted Soil Microbial Communities CONCLUSIONS: 1. Non-Linear ANN >> predictor than Linear PCA (principal Components Analysis) 2. No Direct Correlation (P>0. 05) Cr+3 with Biomass (PLFA), Positive correlation between biomass (PLFA) and TOC, TOM 3. ANN: Sensitivity to Cr+3 Correlates with Microeukaryotes (Fungi)18: 1 9 c, and SRB/Metal reducers (i 15: 0, i 17: 0, 16: 1 w 11, and 10 Me 16: 0) 4. SRB & Metal reducers peaked 10, 000 mg/Kg Cr+3 5. PLFA of stress > trans/cis monoenoic, > aliphatic saturated with > Cr+3 NABIR -CEB
 “LIPOMICS” Future: Automated sequential extraction tandem MS detection of Lipid Biomarkers DNA / m. RNA with arrays coupled data bases & GPS map 20 min? Analysis of microbial contamination & insight into infectivity Ft. Johnson Seminar Clinical & Veterinary Monitor Airports Buses, Ports to data base CBW Defense Food Safety, Indoor Air vs adult Asthsma & Sick Building Syndrome Monitor exhaled breath (capture in silicone bottle) GC/TOFMS Monitor bioremediation, use in-situ microbial community define end points ~ multispecies, multi trophic levels Monitor effects of GMO plants Drugs, hormones, endocrine disrupters, antibiotics are most often hydrophobic as they interact with the membranes of cells. collect biofilms (act as solid phase extractor) analyze with HPLC/ES/MS/MS Urban watershed monitoring & Toilet to Tap
 Sequential Extraction & HPLC/ESI/MS analysis ~ 1 -2 hrs Concentration/ Recovery Detection Extraction Fractionation SFE/ESE Separation HPLC/in-line HPLC/ESI/MS(CAD)MS or HPLC/ESI/IT(MS)n CEB Microbial Insights, Inc.
 Supercritical CO 2 +") Lipid Biomarker Analysis Sequential High Pressure/Temperature Extraction (~ 1 Hour) Supercritical CO 2 + Methanol enhancer Neutral Lipids, (Sterols, Diglycerides, Ubiquinones) Lyses Cells Facilitates DNA Recovery (for off-line analysis 2. Polar solvent Extraction Phospholipids CID detect negative ions Plasmalogens Archeal Ethers 3). In-situ Derivatize & Extract Supercritical CO 2 + Methanol enhancer 2, 6 Dipicolinic acid Bacterial Spores Amide-Linked Hydroxy Fatty acids [Gram-negative LPS] Three Fractions for HPLC/ESI/MS/MS Analysis
Lipid Biomarker Analysis Sequential High Pressure/Temperature Extraction (~ 1 Hour) Supercritical CO 2 + Methanol enhancer Neutral Lipids, (Sterols, Diglycerides, Ubiquinones) Lyses Cells Facilitates DNA Recovery (for off-line analysis 2. Polar solvent Extraction Phospholipids CID detect negative ions Plasmalogens Archeal Ethers 3). In-situ Derivatize & Extract Supercritical CO 2 + Methanol enhancer 2, 6 Dipicolinic acid Bacterial Spores Amide-Linked Hydroxy Fatty acids [Gram-negative LPS] Three Fractions for HPLC/ESI/MS/MS Analysis
 for Neutral Lipids Liquid Gas 1.") Supercritical Fluid Extraction (SFECO 2 + Methanol Enhancer) for Neutral Lipids Liquid Gas 1. vs. liquids greater solute diffusivity less solute viscosity density varies with pressure 2. Fractionate with sequential addition of modifiers 3. Effective in situ derivatization 4. Less toxic than solvents 5. Fast 20 min vs. 8 hrs with solvents 6. Potential for automation 7. Compatible with ES/MS/MS & IT(MS)n 8. Generate micellar emulsions + water + surfactants 9. SFCO 2 becomes a gas < 1070 psi 10. Low Temperature Possible ~ 390 C Microbial Insights, Inc. CEB
Supercritical Fluid Extraction (SFECO 2 + Methanol Enhancer) for Neutral Lipids Liquid Gas 1. vs. liquids greater solute diffusivity less solute viscosity density varies with pressure 2. Fractionate with sequential addition of modifiers 3. Effective in situ derivatization 4. Less toxic than solvents 5. Fast 20 min vs. 8 hrs with solvents 6. Potential for automation 7. Compatible with ES/MS/MS & IT(MS)n 8. Generate micellar emulsions + water + surfactants 9. SFCO 2 becomes a gas < 1070 psi 10. Low Temperature Possible ~ 390 C Microbial Insights, Inc. CEB
 Feasibility of “Flash” Extraction ASE vs B&D solvent extraction* Bacteria = B&D, no distortion Fungal Spores = 2 x B&D Bacterial Spores = 3 x B&D Eukaryotic = 3 x polyenoic FA [2 cycles 80 o. C, 1200 psi, 20 min] vs B&D = 8 -14 Hours *Macnaughton, S. J. , T. L. Jenkins, M. H. Wimpee, M. R. Cormier, and D. C. White. 1997. Rapid extraction of lipid biomarkers from pure culture and environmental samples using pressurized accelerated hot solvent extraction. J. Microbial Methods 31: 19 -27(1997) Microbial Insights, Inc. CEB
 Problem: Rapid Detection/Identification of Microbes Propose a Sequential High Pressure/Temperature Extractor Delivers Three Analytes to HPLC/ESI/MS/MS
 Signature Lipid Biomarker Analysis Expand the Lipid Biomarker Analysis 1. Increase speed and recovery of extraction “Flash” 2. Include new lipids responsive to physiological status HPLC (not need derivatization) Respiratory quinone ~ redox & terminal electron acceptor Diglyceride ~ cell lysis Archea ~ methanogens Lipid ornithine ~ bioavailable phosphate Lysyl-phosphatidyl glycerol ~ low p. H Poly beta-hydroxy alkanoate ~ unbalanced growth 3. Increased Sensitivity and Specificity ESI/MS/MS
 Lyophilized Soil Fractions, Pipe Biofilm SFECO 2 1. Neutral Lipids UQ isoprenologues ESE Chloroform. methanol Derivatize –N-methyl pyridyl Diglycerides Sterols Ergostrerol Cholesterol 2. Polar Lipids Transesterify Intact Lipids PLFA CG/MS Phospholipids PG, PE, PC, Cl, & sn 1 sn 2 FA Amino Acid PG Ornithine lipid Archea ether lipids Plamalogens 3. In-situ acidolysis in SFECO 2 PHA Thansesterify & Derivatize N-methyl pyridyl 2, 6 DPA (Spores) LPS-Lipid A OH FA HPLC/ES/MS/MS
 Monensin Q 1 scan 693. 7 675. 4 461. 3
 Gram-negative Bacteria with Oxygen as terminal acceptor LOQ = 580 femtomole/ul,") Respiratory Benzoquinone (UQ) Gram-negative Bacteria with Oxygen as terminal acceptor LOQ = 580 femtomole/ul, LOD = 200 femtomole/ul ~ 104 E. coli Q 7 Q 6 Q 10 197 m/z
Respiratory Benzoquinone (UQ) Gram-negative Bacteria with Oxygen as terminal acceptor LOQ = 580 femtomole/ul, LOD = 200 femtomole/ul ~ 104 E. coli Q 7 Q 6 Q 10 197 m/z
![Pyridinium Derivative of 1, 2 Dipalmitin [M+92 -109]+ M = mass of original Diglyceride](https://present5.com/presentation/d40d45e0c88aa9cee39de4be5d103b4d/image-57.jpg "Pyridinium Derivative of 1, 2 Dipalmitin [M+92 -109]+ M = mass of original Diglyceride") Pyridinium Derivative of 1, 2 Dipalmitin [M+92 -109]+ M = mass of original Diglyceride LOD ~100 attomoles/ u. L [M+92]+
Pyridinium Derivative of 1, 2 Dipalmitin [M+92 -109]+ M = mass of original Diglyceride LOD ~100 attomoles/ u. L [M+92]+
 HPLC/ESI/MS • Enhanced Sensitivity • Less Sample Preparation • Increased Structural Information • Fragmentation highly specific i. e. no proton donor/acceptor fragmentation processes occurring CEB
 Parent product ion MS/MS of synthetic PG Q-1 1 ppm PG scan m/z 110 -990 Sn 1 16: 0, (M –H) - Sn 2 18: 2 Q-3 product ion scan of m/z 747 scanned m/z 110 -990 Note 50 X > sensitivity SIM additional 5 x > sensitivity ~ 250 X
 for") “LIPOMICS” Tools: Thou shall know structure & concentration of each analyte Progress (equipment) for speed, specificity, selectivity and sensitivity) Extraction 1. Extraction high pressure/temperature faster more complete 2. Supercritical CO 2 pressure becomes gas directly into MS inlet 3. Sequential saves time & effort Chromatography 1. GC high pressure , 0. 1 mm controlled flow, > resolution & faster 2. SFC not much used 3. HPLC smaller diameter, Chiral, 4. CZE high resolution, requires charge, presently difficult 5. Detection (lipids generally lack chromophores) 6. NMR insensitive, expensive, 7. Laser fluorescence not as specific but incredibly sensitive 8. Light scattering cheep & nonspecific 9. Mass Spectrometry 10. Ionization 11. Electron impact 70 e. V known structure catalogue but inefficient 12. Electrospray the dream but needs charged analyte ~ 100%
“LIPOMICS” Tools: Thou shall know structure & concentration of each analyte Progress (equipment) for speed, specificity, selectivity and sensitivity) Extraction 1. Extraction high pressure/temperature faster more complete 2. Supercritical CO 2 pressure becomes gas directly into MS inlet 3. Sequential saves time & effort Chromatography 1. GC high pressure , 0. 1 mm controlled flow, > resolution & faster 2. SFC not much used 3. HPLC smaller diameter, Chiral, 4. CZE high resolution, requires charge, presently difficult 5. Detection (lipids generally lack chromophores) 6. NMR insensitive, expensive, 7. Laser fluorescence not as specific but incredibly sensitive 8. Light scattering cheep & nonspecific 9. Mass Spectrometry 10. Ionization 11. Electron impact 70 e. V known structure catalogue but inefficient 12. Electrospray the dream but needs charged analyte ~ 100%
 Petroleum Bioremediation of soils at Kwajalein Nutrient Amendment and Ex Situ Composting vs Control Showed: 1. VIABLE BIOMASS (PLFA) 2. SHIFT PROPORTIONS: Gram + , Gram - (Terminal branched PLFA, : : Monoenoic, normal PLFA ) 3. Cyclo 17: 0/16: 17 c : : Cyclo 19: 0/18: 17 c (Stress) 4. = 16: 17 t/16: 7 c (Toxicity), [often ] 5. 16: 9 c/16: 17 c (Decreased Aerobic Desaturase) 6. % 10 Me 16: 0 & Br 17: 1 PLFA (Sulfate-reducing bacteria) 7. % 10 Me 18: 0 (Actinomycetes) 8. = PROTOZOA, FUNGI + (Polyenoic PLFA) [ often ] In other studies also usually see: 1. PHA/PLFA (Decreased Unbalanced Growth) 2. RATIO BENZOQUINONE/NAPHTHOQUINONE (Increased Aerobic Metabolism) DEGREE OF SHIFT IN SIGNATURE LIPID BIOMARKERS PROPORTIONAL TO DEGRADATION
 Sampling Drinking Water-- Collect Biofilms on Coupons Biofilms not pelagic in the fluid 1. 104 -106 cells/cm 2 vs ~ 103 -104 /Liter 2. Integrates Over Time 3. Pathogen trap & nurture 4. (including Cryptosporidum oocysts) 4. Serves as a built in solid phase extractor for hydrophobic drugs, hormones, bioactive agents 5. Convenient to recover & analyze for biomarkers Its not in the water but the slime on the pipe
 In the Drinking Water Biofilm Reproducibly Generate a Drinking Water Biofilm: 1. Add from continuous culture vessels: Pseudomonas Spp. Acetovorax spp. Bacillus spp. 2. Seed with trace surrogate/pathogen E. coli (GFP), Mycobacterium pflei (GFP), Legionella bosmanii , Sphingomonas
 Tap Water Biofilm ~ 600 L in 3 weeks on 200 cm 2 stainless steel beads Microbial Insights, Inc. CEB
 Tap Water Biofilm ~ 600 L in 3 weeks on 200 cm 2 stainless steel beads 1. Biomass = 2, 85 pmoles PLFA ~ 2, 8 x 10⁷ 2. Largely Gram - heterotrophs monoenoic PLFA derivatives Cyclopropane (Stationary Phase) No trans PLFA (little toxicity) 3. Gram + aerobes Terminally branched saturated PLFA i 17: 0/a 17: 0 = 0. 7 4. No actinomycetes, Mycobacteria (10 Me 18: 0) 5. No microeukaryotes (polyenoic PLFA) 6. No Cryptosporidium Cholesterol 7. No Legionella (2, 3 di OH i 14: ) UQ-13 8. No Sphingomonas (sphanganine-uronic acid) 9. Pseudomonas >>> Enterics (LPS 3 0 H 10, 12: 0 >> 30 H 14: 0) 10. Chlorine toxicity = oxirane & dioic PLFA Microbial Insights, Inc. CEB
 Biofilm Test System
 Rapid Detection of Bacterial Spores & LPS OH Fatty Acids in Complex Matrices From the lipid-extracted residue, Acid methanolysis & Extract: Strong Acid methanolysis SPORE Biomarker 1. Detect 2, 6 dipicolinate with HPLC/ES/MS/MS 1 hour and 100% yield vs Pasteurize& Plate ---- 3 days and ~ 20% viable 2. Weak acid methanolysis ( 1% HAc, 100 o. C, 30 min. ) 3. 2. Detect 3 -OH Fatty Acids Ester-linked to Lipid A in LPS of Gram-negative Bacteria with HPLC/ES/MS/MS or GC/MS 4. 5. 6. Enterics & Pathogens 3 OH 14: 0 Pseudomonad's 3 OH 10: 0 & 3 OH 12: 0 (Should Dog Drink from Toilet Bowl? )
![Gram-negative Bacteria lipid-extracted residue, hydrolize [1% Acetic acid, 30 min, 100 o. C], extract](https://present5.com/presentation/d40d45e0c88aa9cee39de4be5d103b4d/image-68.jpg "Gram-negative Bacteria lipid-extracted residue, hydrolize [1% Acetic acid, 30 min, 100 o. C], extract") Gram-negative Bacteria lipid-extracted residue, hydrolize [1% Acetic acid, 30 min, 100 o. C], extract = Lipid A E. Coli Lipid A MS/MS 3 OH 14: 0, 14: 0 as negative ions Acid sensitive bond {to KDO] Lipid A 14 14 12 14
Gram-negative Bacteria lipid-extracted residue, hydrolize [1% Acetic acid, 30 min, 100 o. C], extract = Lipid A E. Coli Lipid A MS/MS 3 OH 14: 0, 14: 0 as negative ions Acid sensitive bond {to KDO] Lipid A 14 14 12 14
 Lipid A from E. coli Fatty acids liberated by acid hydrolysis followed by acid–catalyzed (trans) esterification 3 OH 14: 0 TMS GC/MS of Methyl esters 14: 0 3 OH 14: 0 phthalate siloxane
 Electrospray Mass Spectrum of Lipid A Standard from E. coli 14: 0 m/z 227 OH 14: 0 m/z 243 14: 0 and 3 0 H 14: 0 are clearly detectible as negative ions
 WQ 1 669 524 94 LIPID A: Pseudomonas 3 0 H 12: 0 & 3 0 H 10: 0 (water organism) Enteric & Pathogens 30 H 14: 0 (fecal potential pathogen) Toilet bowl biofilms: High flush vs Low flush rate Higher monoenoic, lower cyclopropane PLFA ~ Gram-negative more actively growing bacteria mol% ratios of 72 (30)*/19 (4) of 3 0 H 10 +12/ 3 OH 14: 0 LPS fatty acids Human feces 7 (0. 6)/19 (4) 3 0 H 10 +12/ 3 OH 14: 0 in human feces [*mean(SD)]. Pet safety if access to processed non-potable water.
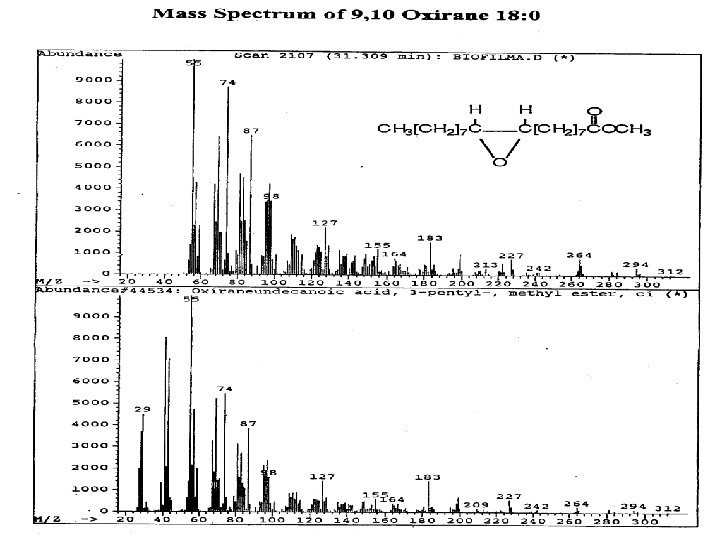
 fatty acids from") Toxicity Biomarkers Hypochlorite, peroxide exposure induces: 1. Formation of oxirane (epoxy) fatty acids from phospholipid ester-linked unsaturated fatty acids 2. Oxirane fatty acid formation correlates with inability to culture in rescue media. Viability? 3. Oxirane fatty acid formation correlates with cell lysis indicated by diglyceride formation and loss of phospholipids.
Toxicity Biomarkers Hypochlorite, peroxide exposure induces: 1. Formation of oxirane (epoxy) fatty acids from phospholipid ester-linked unsaturated fatty acids 2. Oxirane fatty acid formation correlates with inability to culture in rescue media. Viability? 3. Oxirane fatty acid formation correlates with cell lysis indicated by diglyceride formation and loss of phospholipids.
 Compounds not readily ionized, that contain a hydroxy group can be derivatized to their methylpyridyl ether Triclosan CH 2 Cl 2 TEA 2 -flour-1 -methylpyridinium -toluenesulfonate
 Q 1 scan 380. 3 218. 1 Product ion scan") Triclosan (Pyridinium derivative) Q 1 scan 380. 3 218. 1 Product ion scan
Triclosan (Pyridinium derivative) Q 1 scan 380. 3 218. 1 Product ion scan
 Q 1 scan 475. 4 100. 1 Product ion scan") Sildenafil (Viagra) Q 1 scan 475. 4 100. 1 Product ion scan
Sildenafil (Viagra) Q 1 scan 475. 4 100. 1 Product ion scan
 Quantitative Automated Analytical System") WQ 1 669 524 94 Goal: Provide a Rapid (minutes) Quantitative Automated Analytical System that can analyze coupons from water systems to: 1). ) Monitor for Chlorine-resistant pathogens [Legionella, Mycobacteria], Spores 2). Provide indicators for specific tests (Sterols for Cryptosporidium, LPS OH-FA for enteric bacteria 3). Monitor hydrophobic drugs & bioactive molecules Establish Monitored Reprocessed Waste Water as safer than the wild type
WQ 1 669 524 94 Goal: Provide a Rapid (minutes) Quantitative Automated Analytical System that can analyze coupons from water systems to: 1). ) Monitor for Chlorine-resistant pathogens [Legionella, Mycobacteria], Spores 2). Provide indicators for specific tests (Sterols for Cryptosporidium, LPS OH-FA for enteric bacteria 3). Monitor hydrophobic drugs & bioactive molecules Establish Monitored Reprocessed Waste Water as safer than the wild type
 Detection of 13 C grown bacteria The CH vs 13 C- Problem H = 1. 007825 12 -C = 12. 00000 13 -C = 13. 003345 So the differentiate CH from 13 -C must differentiate 13. 0034 from 13. 0078 requites High resolution Mass Spectrometry Solution: 13 C Label to saturation by growth with 13 C so avoid CH problem a). Recover polar lipids (Extraction & Concentration) unique biomarker b). HPLC/ESI/MS/MS ~ attomolar sensitivity c). Detect unique masses of PLFA for specific P-lipids
") Problem: detect 13 -C grown bacteria Solution: Use a polar lipid biomarker: a) Total lipids can be extracted & concentrated from large sample environmental samples. b) polar lipids can be purified c) specific intact polar lipid can be purified with HPLC d) polar lipids excellent for HPLC/eletrospray ionization [~ 100% vs < 1% for electron impact with GC/MS]
Problem: detect 13 -C grown bacteria Solution: Use a polar lipid biomarker: a) Total lipids can be extracted & concentrated from large sample environmental samples. b) polar lipids can be purified c) specific intact polar lipid can be purified with HPLC d) polar lipids excellent for HPLC/eletrospray ionization [~ 100% vs < 1% for electron impact with GC/MS]
 Detection of specific per 13 C-labeled bacteria added to soils Extract lipids, HPLC/ESI/MS/MS analysis of phospholipids detect specific PLFA as negative ions PLFA 12 C Per 13 C 16: 1 253 269 same as 12 C 17: 0 16: 0 255 271 Unusual 12 C 17: 0 (269) + 2 13 C cy 17: 0 267 284 12 C 18: 0 (283) + 13 C 18: 1 281 299 12 C 20: 6 , 12 C 19: 0 with 2 13 C 19: 1 295 314 12 C 21: 5 (315), 12 C 21: 6 (313) 13 C bacteria added No 13 C bacteria added
 1 Part 13 C DA 001 Spiked into 10 Parts of Soil Sample PE from soil with 13 C added
 Detection of Shrimp Gut Microbes 1. Recover DNA from Hind and Mid gut 2. Amplify with PCR using r. DNA eubacterial primers 3. Separate Amplicons with Denaturating Gel Gradient Electrophoresis (DGGE) 4. Isolate Bands, 5. Sequence and match with r. DNA database 6. Phylogenetic analysis
 Water 817 Standard Fore gut Water 831 Hind gut Major bands have been Recovered For sequencing & Phylogenetic analysis Figure 1. DGGE analysis bacterial community in water and shrimp gut samples. Amplified 16 S r. DNAs were separated on a gradient of 20% to 65% denaturant. Water changed composition between Aug 17 & 31 st, much > diversity than shrimp gut, Fore gut less diverse than Hind gut.
 = Foregut, Mycobacteria Propioni -bacterium Gram positive joining analysis of 16 S sequences from excised DGGE bands, relationships with reference organisms downloaded from RDP. (Vibrio) γ-proteobacterium Figure 2. Neighbor- Marine αproteobacteria δ-proteobacteria = Hindgut, = Water BCF group Green alga
, Fore Gut (F), Hind Gut (H) W F H") Microbial Community in Water (W), Fore Gut (F), Hind Gut (H) W F H W F H W F H
Microbial Community in Water (W), Fore Gut (F), Hind Gut (H) W F H W F H W F H
, Fore Gut (F), Hind Gut (H) Note Log scale") Microbial Viable Biomass: Water (W), Fore Gut (F), Hind Gut (H) Note Log scale W F H W F H W F H
Microbial Viable Biomass: Water (W), Fore Gut (F), Hind Gut (H) Note Log scale W F H W F H W F H
 Microbial Viable Biomass: Food, Flock, Water, Fore, Gut Hind Gut
 Shrimp In Mariculture Water & Gut Microbial Community Over one month of aquiculture: • Water microbial biomass increases somewhat • Algal and Microeukaryotes decrease • Desulfobacter increase Desulfovibrio slight decrease • Gram-negative bacteria increase then decrease • Water microbial composition relatively constant gets more anaerobic? SRB? Not important in Gut • Fore Gut & Hind gut same viable biomass • Gut Community very different from water • DGGE shows Fore and Hind Gut differences & much less diverse community • Gut 2 -order of magnitude > viable microbial biomass than water • Gut and Water different PLFA from Shrimp food
 Detection of specific per 13 C-labeled bacteria, Algae, etc. in Shrimp Feed per-13 -C labeled bacteria, Algae, microeukaryotes to shrimp: 1. Determine Triglyceride Fatty acids to Phospholipid fatty acids in muscle, hepatopancreas, gut etc. using HPLC/ES/MS/MS [Lithiated TG (positive ions) & PG with detection of negative ions)] 2. This gives evidence for both incorporation and nutritional status into the Shrimp 3. Can differentiate between bacteria PE, PG vs the eukaryotes with Ceramides and PC with HPLC/ES/MS/MS
 Problem: Rapid Non-invasive Detection of Infection or Metabolic stress for Emergency room Triage Human Breath sample GC/MS
 Problem: Detecting Indoor Air Biocontamination Collect particulates on a tape with vortex flow collector In lab process tape Lyse cells PCR DGGE or use hybridization chip for : Bacteria, Fungi and spores Immune potentiators ~ LPS, Fungal Antigens, dust mites, cat dander, cockroach frass Adult Asthmas
 Biomarkers for Confined Space Air Biocontaminant Monitoring: 1. Viable Biomass (all cells with an intact membrane) PLFA 2. Detect Recently Lysed (diglyceride fatty acids) 3. Community Composition 4. Nutritional/Physiological status (Infectivity & Toxin production) 5. Evidence for Toxicity (trans/cis PLFA) 6. Detect Specific Microbes Mycobacteria, Legionella, Francisella, some Aspergillis, complementary with gene probes and PCR 7. Detection of Allergens: pollens, danders, spores, arthropod frass 8. Detection of immune potentiators (bacterial endotoxin) 9. Detection of mycotoxins 10. Independent of “culturability” 11. Independent of sample source (tiles, covers, carpet, air filters) 12. + Proteins & Nucleic Acids ~ detect virus Microbial Insights, Inc. CEB