

c7a7d4a848c23ce1d4cdd1f44cad9668.ppt
- Количество слайдов: 50
 Lifecourse progression of AD or modeling of AD biomarker trajectories: history and pitfalls Clifford R Jack Jr MD Professor of Radiology The Alexander Family Professor of Alzheimer's Disease Research Mayo Clinic, Rochester, MN
 Acknowledgements n n n n Funded in part by Grant R 13 AG 030995 from the National Institute on Aging RO 1 AG 011378 RO 1 AG 041851 U 01 AG 06786 Alexander Family Professorship in Alzheimer's disease research GHR Foundation The views expressed in written conference materials or publications and by speakers and moderators do not necessarily reflect the official policies of the Department of Health and Human Services; nor does mention by trade names, commercial practices, or organizations imply endorsement by the U. S. Government.
 outline n AD biomarkers n Motivation for 2010 Lancet Neurology model n 2013 refinements of 2010 model n Evidence since publication of 2010 model n Non-AD pathology in elderly and SNAP n Summary
 AD Biomarkers are proxies for AD pathophysiology: 6 Major – “ 2” categories Measures of brain A deposition – amyloid plaques n n Amyloid PET CSF AB 42 – low Measures of Neruofibrillary tangles (tau) CSF tau (t-tau and p-tau) – high n Tau PET Measures of Neurodegeneration (progressive loss of neurons or processes with corresponding impairment in neuronal function) n FDG PET – AD signature hypo metabolism n Structural MRI - AD signature atrophy n
 MRI AD-signature FDG AD-signature Jack et al Nat Neurol Rev in press
 specificity for AD pathology: ranking n amyloid PET > CSF Ab 42, CSF p-tau > tau PET> CSF total tau > FDG and MRI n FDG and MRI sensitive markers of neurodegeneration, n correlate very well with cognition n but neurodegeneration not specific to AD n Atrophy and hypometabolism not specific to AD n
 Hippocampal Volume vs CA 1 neuron counts Bobinski, Neuroscience 95, 2000 Zarow, Ann Neurol, 2005
: 1186 -97 and Neuroimage") STAND algorithm for Individual Subject Diagnosis Vemuri, Neuroimage 2008; 39(3): 1186 -97 and Neuroimage 2008; 42(2): 559 -67
STAND algorithm for Individual Subject Diagnosis Vemuri, Neuroimage 2008; 39(3): 1186 -97 and Neuroimage 2008; 42(2): 559 -67
 Hippocampal W score by diagnosis in those with a single path Dx HS = hippocampal sclerosis; DLBD = diffuse Lewy body disease; FTD = frontotemporal degeneration; NFT = Neurofibrillary tangle-only dementia Jack Neurology 2002
 outline n AD biomarkers n Motivation for 2010 Lancet Neurology model Order of biomarker events n Shape of curves n n 2013 refinements of 2010 model n Evidence since publication of 2010 model n Non-AD pathology in elderly and SNAP n Summary
 Sporadic AD: Failure of Ab 42 clearance The Amyloid Hypothesis of Alzheimer’s Disease: Progress and Problems on the Road to Therapeutics Hardy and Selkoe, Science 2002 Dominate theory of AD pathogenesis since 1990 s
 Problems with amyloid cascade hypothesis: state of biomarker studies ~ 2008/2009 was confusing n Cross sectional dissociation – time and location direct relationship between neurodegenerative biomarker magnitude/topography and symptoms n indirect relationship between amyloid biomarkers and symptoms: 30% CN abnormal, topographic dissociation n n Longitudinal dissociation change in cognition closely coupled to rate of neurodegeneration n not to rate of amyloid deposition n
 AD vs. Cog Normal: Topography Jack et al, Brain 2008 5 4 3 2 1 0 p < 0. 005 (unc) MRI
 Paradox Atrophy, FDG hypo metabolism, CSF tau, symptoms group together in location and time, amyloid does not n Genetics all point to Ab as causative n early onset AD: Down syndrome and all known autosomaldominant mutations - increase production of Ab 42 or all Ab species n Late onset AD: APOE 4 facilitates Ab deposition n Protective genetics: APOE 2, Icelandic mutation n primary tauopathies lead to FTLD, CBD, PSP but never to pathological AD n
 “solution”: modified amyloid cascade n b-amyloid facilitates spread of tau, effect of bamyloid on cognition is indirect A T N C T N C sequence although topology of A and T N C differ n Time shifts or ordering - biomarkers become abnormal in an ordered but temporally overlapping manner n A is the upstream driver of
 amyloid precedes tauopathy/neurodegeneration, effect of amyloid on cognition is indirect Inglesson & Hyman, Neurology 2004 n Jack et al, Brain 2008 & 2009 n Mormino & Jagust, Brain 2009 n Perrin & Holztman, Nat Rev 2009 n
 Lancet Neurol 2010 Ab Amyloid = CSF Ab 42 or amyloid PET imaging; Tau Mediated Neuron Injury and Dysfunction = CSF tau or FDG PET; Brain Structure = structural MRI
 Sigmoid shape
 Rate of atrophy accelerates as approach dementia Chan and Fox, Lancet 2003
 Annual change in PIB SUVR and ventricular volume by clinical diagnosis Jack et al , Brain 2009
 Lancet Neurol 2010 Ab Amyloid = CSF Ab 42 or amyloid PET imaging; Tau Mediated Neuron Injury and Dysfunction = CSF tau or FDG PET; Brain Structure = structural MRI
 outline n AD biomarkers n Motivation for 2010 Lancet Neurology model n 2013 refinements of 2010 model n Evidence since publication of 2010 model n Non-AD pathology in elderly and SNAP n Summary
 Lancet Neurology, Feb, 2013
 C- = cognition in the presence of") Modulators of Biomarker Temporal Relationships (Fig 5) C- = cognition in the presence of co-morbid pathologies (e. g. , Lewy bodies or vascular disease) or risk amplification genes, C+ = cognition in subjects with enhanced cognitive reserve or protective genes, Co = cognition in subjects without co-morbidity or enhanced cognitive reserve. Jack et al Lancet Neurol 2010
Modulators of Biomarker Temporal Relationships (Fig 5) C- = cognition in the presence of co-morbid pathologies (e. g. , Lewy bodies or vascular disease) or risk amplification genes, C+ = cognition in subjects with enhanced cognitive reserve or protective genes, Co = cognition in subjects without co-morbidity or enhanced cognitive reserve. Jack et al Lancet Neurol 2010
 Aβ deposition at autopsy (discussed but not") medial temporal tauopathy often occurs without (“before”) Aβ deposition at autopsy (discussed but not incorporated into 2010 model) n Isolated medial temporal tauopathy - brain stem, entorhinal cortex, hippocampus, tauopathy is common in middle age and older subjects (as young as 6 yo) with no amyloid plaques - Braak 1997, 2011; Price and Morris, Annals Neurol 1999; Haroutunian, Arch Neurol 1999
medial temporal tauopathy often occurs without (“before”) Aβ deposition at autopsy (discussed but not incorporated into 2010 model) n Isolated medial temporal tauopathy - brain stem, entorhinal cortex, hippocampus, tauopathy is common in middle age and older subjects (as young as 6 yo) with no amyloid plaques - Braak 1997, 2011; Price and Morris, Annals Neurol 1999; Haroutunian, Arch Neurol 1999
 Lancet Neurology, Feb, 2013 Late onset AD - MTL tauopathy precedes b-amyloid
 outline n AD biomarkers n Motivation for 2010 Lancet Neurology model n 2013 refinements of 2010 model n Evidence since publication of 2010 model n Non-AD pathology in elderly and SNAP n Summary
 n Old") AD pathology in young vs old Young – pathologically pure (except LB) n Old – plaques and tangles superimposed changes of n n non AD pathologies n CVD n Non AD tauopathies – PART, grains, CTE, rarely PSP, CBD, and FTLD n LB n Hipp sclerosis n TDP 43 n aging
AD pathology in young vs old Young – pathologically pure (except LB) n Old – plaques and tangles superimposed changes of n n non AD pathologies n CVD n Non AD tauopathies – PART, grains, CTE, rarely PSP, CBD, and FTLD n LB n Hipp sclerosis n TDP 43 n aging
 DIAN, Bateman et al NEJM 2012 Cross sectional, years from parental age onset, difference between carriers and non-carriers
 Evidence for temporal ordering of AD biomarkers model DIAN, Benzinger et al PNAS, 2012 (Mutation carries, PIB n = 121; FDG n= 116; MRI n= 137) Subcortical MRI ROI analyses – hippocampus, amygdala, N accumbens all - 10 yrs in carriers
 Fleisher et al JAMA Neurol 2015
 Modeling studies in elderly n Support model Caroli, 2010 n Jack, 2011 n Buchave, 2012 n Villemagne, 2013 n Young, 2014 n Donohue, 2014 n n Do not support model n Jedynak, 2012
 Cerebrospinal Fluid Levels of beta. Amyloid 1 -42, but Not of Tau, Are Fully Changed Already 5 to 10 Years Before the Onset of Alzheimer Dementia Buchhave et al, Arch Gen Psych 2012
 Brain Beta Amyloid Load Approaches a Plateau Jack et al, Neurology 2013
 Brain Beta Amyloid Load Approaches a Plateau Jack et al, Neurology 2013 Relating the inverted U-shaped amyloid rates as a function of baseline SUVR to sigmoid shaped trajectory of amyloid accumulation with time – red = 195; blue = 158
 Sigmoid shape - amyloid Villemange 2013 - amyloid PET n Landau and Jagust 2015 - amyloid PET n Shaw 2015 - CSF n
 outline n AD biomarkers n Motivation for 2010 Lancet Neurology model n 2013 refinements of 2010 model n Evidence since publication of 2010 model n Non-AD pathology in elderly and SNAP n Summary
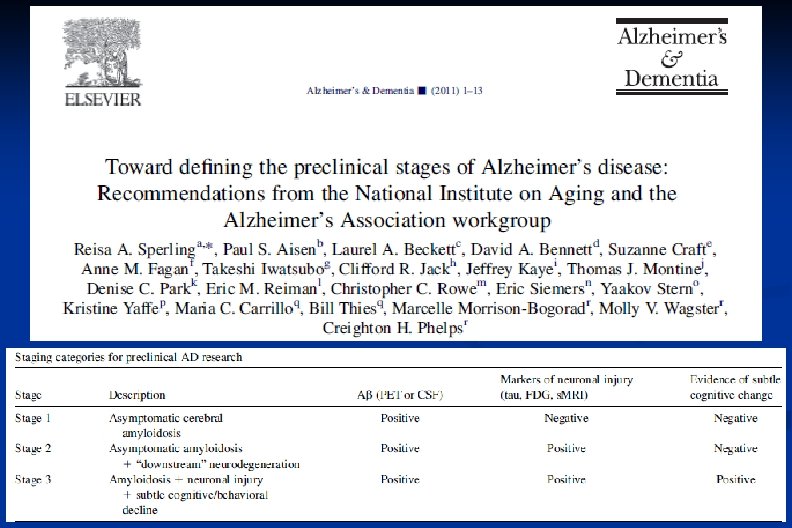
 NIA-AA Preclinical AD staging in relation to 2010 Lancet Neurol biomarker model Jack, Annals, 2012
 Objectives Annals Neurol 2012 Operationalize the NIA-AA criteria n How do cognitively normal subjects (n=450) in MCSA distribute in the NIA-AA scheme? n
 Distribution of 450 CN in MCSA by NIA-AA Preclinical Stage Annals, 2012 0 – 43%; 1 - 16%; 2 – 12%; 3 – 3%’; SNAP – 23%; Unclassif – 4%
 Characteristics of SNAP subjects in different study cohorts Cognitively normal subjects Source Population characteristics Biomarkers used for classification Mayo Clinic Study of Aging population based, cognitively normal Mayo Clinic Study of Aging Number (%) of SNAP/ number in cohort Age in SNAP group Number (%) of men in SNAP group Number (%) of Clinical outcome APOE 4 in SNAP group Follow up time across cohort reference Amyloid PET, FDG PET 103 (23%) / 450 or hipp volume 79 yrs (IQR 76, 84) 62 (60%) 12 (13%) Jack et al 2012 population based, cognitively normal Amyloid PET, FDG PET 69 (23%) / 296 or hipp volume 81 yrs (IQR 76, 84) 43 (62%) 8 (12%) 1. 3 yrs (range 1. 1 – 5. 1) Knopman et al 2012 Washington University community dwelling, cognitively normal CSF Ab 42 and tau (either 72 (23%) / 311 ptau or ttatu) 73. 6 yrs (SD 5. 8) 30 (40%) 22 (31%) 3. 9 yrs (range 1 – 15) Vos et al 2013 Washington University community dwelling, cognitively normal CSF Ab 42 and tau (either ptau or ttatu) 3. 70 yrs (SD 1. 46) Roe et al 2013 Berkeley Aging Cohort community dwelling, cognitively normal Amyloid PET, FDG PET, 19 (26%) / 72 hipp volume and MRI cortical ROI CN to MCI or dementia: st 0 – 5%, st 1 – 11%, st 2 – 21%, st 3 – 43%, SNAP – 10% CDR 0 to >=. 5 AD dementia: st 0 – 2%, st 1 – 11%, st 2 – 26%, st 3 – 56%, SNAP – 5% CDR 0 to >= 0. 5: survival HR A-N- ref A+N- 2. 58 A+N+ 8. 41 SNAP 1. 12 Wirth et al 2013 Harvard Aging Brain Study community dwelling, cognitively normal Amyloid PET, FDG PET 38 (23%) / 166 or hipp volume 79 yrs (IQR 75, 82) 248 (63%) 7 (19%) SNAP greater decline than stage 0, less decline than A+N+ 2. 09 yrs (IQR 1. 9 – 2. 3) Mormino et al 2014 ADNI clinical trial sites, cognitively normal CSF Ab 42, and either CSF 54 (23%) / 238 tau or hipp volume 6 yrs (IQR 3. 0 – 7. 0) Toledo et al 2014 Amsterdam Dementia Cohort memory clinic, subjective memory complaint CSF Ab 42 and tau CN to MCI or dementia: survival HR stage 0 ref st 1 – 2. 6, st 2 – 1. 8, st 3 – 11. 3, SNAP – 2. 4 CN to MCI or dementia: st 0 – 3%, st 1 – 18%, st 2 – 60%, SNAP – 10% 1. 8 yrs (SD 1. 3) Van Harten et al 2013 31 (23%) / 132
 Characteristics of SNAP subjects in different study cohorts Impaired subjects source Population characteristics Biomarkers used for classification Number (%) of SNAP/ number in cohort Age in SNAP group Number (%) of men in SNAP group Number (%) of APOE 4 in SNAP group Clinical outcome Follow up time across cohort reference 3 - site European consortium memory clinics, MCI CSF Ab 42, hipp volume, FDG PET 15 (20%) / 73 MCI to dementia: A-N- 5% A+N- 27% A+N+ 100% SNAP 47% Progressor MCI 23. 3 (276) mo. stable MCI 31. 8 (12 -84) mo Prestia et al 2013 Mayo Clinic Study of Aging Population based, MCI Amyloid PET, FDG PET 36 (29%) / 126 or hipp volume 82 yrs (IQR 78, 85) 28 (78%) 4 (11%) MCI to dementia: A-N- 8% A+N- 0 A+N+ 16% SNAP 21% 15 mo Petersen et al 2013 ADNI clinical trial sites, MCI Amyloid PET, FDG PET 10 (17%) / 58 or hipp volume 77 yrs (IQR 73, 83) 7 (70%) 4 (40%) MCI to dementia: A-N- 11% A+N- 0 A+N+ 42% SNAP 25% 12 mo Petersen et al 2013 clinical trial, 7 European sites memory clinics, MCI Amyloid PET, medial temporal atrophy 7 (35%) / 20 Duara et al 2013 ADNI clinical trial sites, AD dementia Amyloid PET, CSF Ab 42, FDG PET or hipp volume 6 (7%) / 92 Lowe et al 2013 ADNI plus 4 - site clinical trial sites and European consortium memory clinics, MCI CSF Ab 42, hipp volume, FDG PET 34(17%) / 201 70. 6 yrs (SD 9. 2) 23 (68%) 10 (31%) Percent progressors*: A-N- 11% A+N- 34% A+N+ 71% SNAP 56% 26. 4 months (SD 16. 8) Among SNAP Caroli et al 2015 ADNI plus multi- site memory clinics, MCI European consortium CSF Ab 42 and tau, medial temp atrophy, or FDG PET 220 (29%) / 776 69. 4 yrs (SD 8. 3) 116 (53%) 62 (32%) progression at last follow up: to AD dementia 21%, to non AD dementia 10% 2. 5 (SD 1. 3) yrs Vos et al 2015
 SNAP n n SNAP is a biomarker based construct denoting amyloid negative neurodegeneration positive individuals Common in cognitively normal elderly (roughly 23%) and in mild cognitive impairment (roughly 25%) APOE 4 is markedly underrepresented compared to amyloid positive individuals (A+N- and A+N+) individuals Suspected to be pathologically heterogeneous, composed of a variety of non-AD etiologies common in aging
 Non AD pathologies in elderly CVD n Non AD tauopathies – PART, grains, CTE, rarely PSP, CBD, and FTLD n LB n Hipp sclerosis n TDP 43 n “aging” n
 outline n AD biomarkers n Motivation for 2010 Lancet Neurology model n 2013 refinements of 2010 model n Evidence since publication of 2010 model n Non-AD pathology in elderly and SNAP n Summary
 Difficulties with empiric modeling of AD with biomarkers in elderly Can not measure full extent of disease (creates x axis and y axis problem) n Non-AD pathology (SNAP) n Proportional etiological substrates of neurodegeneration and cognitive impairment unknown n Mixed pathology n No specific biomarkers for important pathologies n Neurodegeneration and its biomarkers not specific for AD n n Account for aging effects on cognition/neurodegeneration
 Lancet Neurol 2010 Ab Amyloid = CSF Ab 42 or amyloid PET imaging; Tau Mediated Neuron Injury and Dysfunction = CSF tau or FDG PET; Brain Structure = structural MRI
 Mixed AD: proportional etiological substrates of neurodegeneration are unknown and vary from person to person Amyloid-first sequence Neurodegeneration-first sequence Jack and Holtzman, Neuron 2013