

43823d2470483c90f61a16eb5399807a.ppt
- Количество слайдов: 38
 Legislative & Regulatory Clean Air Activities in 2009 David C. Foerter Executive Director Institute of Clean Air Companies September 24, 2009 CEMTEK Users Group Meeting Santa Ana, CA
 Presentation Overview n n n Who is ICAC Major Regulatory Drivers for PM, Ozone, visibility, NOx, SO 2, GHG Additional rules – – n PM in SCAQMD Stationary Engines Cement Industrial boilers Wrap Up
 Who Is ICAC n The National Association for Air Pollution Control Manufacturers and Service Companies n Promote Better Understanding of Air Pollution Control Industry, Suppliers, Technologies, and Industry Capabilities – Federal, State and Local Regulatory Issues – Industry Trade Groups & Other Associations – Public-At-Large n Stationary Sources Primary Focus – Electric Power and Industrial Sectors
 Who Are Members n Represent More Than 100 Leading Companies in APC Industry – $100 million dollar-plus projects down to $1000 retrofits n Members Include: (Full and Associates) – Architectural & Engineering Firms – Original Equipment Manufacturers and Full System Suppliers – Emissions Measurement Vendors – Component Suppliers and AQ Control Consultants n Structural Steel n Catalyst n Reagents (Ammonia, Lime, Activated Carbon, etc. )
 ICAC Member Company Markets n Electric Power Sector § Chemical Process Industry n Pulp & Paper § Metals Processing n Petroleum Refinery § Asphalt Production n Plywood § Plastic Products n Bakeries § Surface Coating n Restaurants § Cement Manufacturing n Residential Wood Burning § Incineration
 Clean Air Regulations n n Federal Legislation – Clean Air Act 1970; 1977 and 1990 Amendments – New Source Performance Standards (SO 2, NOx, and PM), Acid Rain Program, New Source Review (NSR), NESHAPS, BART, NOx SIP Call, CAIR, CAMR – Set AQ Standards (PM, Pb, O 3, CO, NOx, SO 2) State Regulations & NAAQS Attainment Demonstrations – transport SIP call, 126 actions (O 3 -1&8 hr, CO, PM 2. 5 , MACT Programs)
 Clean Air Act Amendments 1977 – keeps on giving…. . n EPA Established New Source Review (NSR) – – – n New Plants and Major Additions to Existing Plants Command Control Programs Designed to Retire Old Units with New Cleaner Units EPA Rewrite (2003) of NSR Tied-Up in Courts ~ 66% of utility boilers are 20 -40 years old New Source Performance Standards (NSPS) – – – Reasonably Available Control Technologies (RACT) Best Achievable Control Technology (BACT) Lowest Achievable Emissions Rate (LAER)
 U. S. Legislative/Regulatory Drivers n U. S. EPA Regulations Being Implemented n U. S. EPA Rules Recently Remanded by Court – Clean Air Visibility Rule (CAVR) – SO 2 and NOx – Enforcement Cases/NSR – SO 2, NOx, PM) – Ozone and PM 2. 5 NAAQS – Clean Air Mercury Rule (CAMR)/Utility MACT; propose 2010 – Clean Air Interstate Rule (CAIR); propose 2010 n Anticipated Greenhouse Gas Requirements – U. S. EPA Climate Change Requirements/Regulation – 111 th Congress Climate Change Legislations n n Waxman-Markey Clean Air Planning Act
 Acid Rain Program n n All 50 States Affected Fossil-fuel fired power plants > 25 MW SO 2 Cap-n-Trade Program – Phase 1: 1995, 445 coalfired units – Phase 2: 2000, > 2000 coal-, oil-, gas-fired units, 10 million ton cap – Phase 3: 2008, 8. 95 million ton cap NOx Annual Emissions Rate Program – Averaging Plans – Alternative Emission Limits
 Clean Air Visibility Rule n n n Purpose of Rule – Guidelines for States to Help Meet Visibility Goals – Achieve Natural Background Visibility by 2064 Timing – June 2005 - Rule Finalized – December 2007 - State SIPs due – December 2013 – Compliance is 3 Years after EPA Approves State SIPs Sources Affected by Rule – 26 Different Source Categories – Built between 1962 - 1977 – Units > 250 MW at Plants with >750 MW Capacity – ~ 500 BART Eligible Units
 – 38 ton cap") Mercury Control Technology Drivers n Clean Air Mercury Rule (CAMR) – 38 ton cap in 2010 and 15 ton cap in 2018 – Regulate EGU Hg emissions (Sec. 111) n Hg Emissions Control Approach – Activated Carbon Injection Systems – Co-benefit Control from SO 2, NOx and PM Controls n Litigation – CAMR vacated Feb 8, 2009 n State Mercury Regulations – More than 20 states have proposed, finalized or implemented mercury limits or allocations more stringent than CAMR – State Model Rule ( NACAA) n Option I – Phase I 80% – Phase II 90 -95 % n Option II – Co-benefit (SO 2, NOx, PM and Hg) by 2012 n No trading – IL, MI, MN aggressive Hg Emission reduction targets.
Mercury Control Technology Drivers n Clean Air Mercury Rule (CAMR) – 38 ton cap in 2010 and 15 ton cap in 2018 – Regulate EGU Hg emissions (Sec. 111) n Hg Emissions Control Approach – Activated Carbon Injection Systems – Co-benefit Control from SO 2, NOx and PM Controls n Litigation – CAMR vacated Feb 8, 2009 n State Mercury Regulations – More than 20 states have proposed, finalized or implemented mercury limits or allocations more stringent than CAMR – State Model Rule ( NACAA) n Option I – Phase I 80% – Phase II 90 -95 % n Option II – Co-benefit (SO 2, NOx, PM and Hg) by 2012 n No trading – IL, MI, MN aggressive Hg Emission reduction targets.
 Mercury plus n n n February 8, 2008 - the D. C. Circuit vacated EPA's rule removing power plants from the Clean Air Act list of sources of hazardous air pollutants. At the same time, the Court vacated the Clean Air Mercury Rule. February 6, 2009 - DOJ, on behalf of EPA, asked the Supreme Court to dismiss EPA’s request that the Court review the D. C. Circuit Court’s vacatur of the Clean Air Mercury Rule (CAMR). EPA moving forward on a rule broader than coal-fired power plants and beyond mercury; “informed” by the courts. At least 25 states have mercury control regulations / legislation. United Nations addressing global fate of mercury. Mercury CEMS sales for power plants peaked in 2008; a few being supplied to steel mills and foundries.
 GHG Control Technology Drivers n n n U. S. EPA Advance Notice of Proposed Rulemaking for GHG Final (9/09) Mandatory Reporting of Greenhouse Gases Rule U. S. EPA Proposed Rule for Geological Sequestration of Carbon Dioxide Regional Greenhouse Gas Initiative Western Climate Initiative Waxman-Markey Legislation
 Final Mandatory Reporting of Greenhouse Gases Rule n n n n EPA Finalized on Sept. 22, 2009. Starts January 1, 2010; requires 10, 000 facilities to collect GHG data. Covers approx. 85% of GHG emissions. Includes facilities that emit 25, 000 metric tons or more of CO 2 equivalent per year. First annual reports for calendar year 2010, will be submitted to EPA in 2011. Defined GH gases CO 2, CH 4, N 2 O, HFC, PFC, SF 6 Applies upstream and downstream – Upstream: fossil fuel and chemical producers and importers – Downstream: direct GHG emitters- large industrial facilities
 SCAQMD PM Proposal 8/09 Proposed Performance and Maintenance Standards for PM Control Devices n Performance Rule 115 to reduce direct PM emissions from various source categories venting by establishing performance (PM and opacity) standards, use of certified filtration devices, monitoring equipment, mandatory operation and maintenance plans to maintain optimum efficiency. n PR 1155 applies to more than 1, 500 facilities with nearly 5, 000 currently active permits for PM control devices. The affected sources include: n aggregate and related operations, n cement and asphalt plants, n food products, n metallurgical, n pharmaceutical, n textile and wood products, n chemical product manufacturing.
 of permitted sources have baghouses and") SCAQMD PM Proposal. Controls n n Most (74%) of permitted sources have baghouses and vent bins; remaining (24 %) have cyclones, ESPs, and wet scrubbers. Baghouse performance standard outlet PM concentration limit and a performance standard for new hood and ventilation systems. – PM emissions at the outlet of any Tier 2 (>500 -7, 500 sq ft) or Tier 3 (>7, 500 sq ft) baghouse shall not exceed 0. 01 gr/dscf, immediately upon adoption of the rule. – Baghouse upgrade – Effective January 1, 2012, an existing manual shaker shall be upgraded or replaced to, at a minimum, an automated shaker unit. An operator shall not install a manual shaker baghouse after adoption of the rule. – If the PM emission limit (0. 01 gr/dscf) is exceeded, EPA’s verified filtration products or other technologies or methods approved by the Executive Officer shall be used, within three months, to meet the applicable requirements.
SCAQMD PM Proposal. Controls n n Most (74%) of permitted sources have baghouses and vent bins; remaining (24 %) have cyclones, ESPs, and wet scrubbers. Baghouse performance standard outlet PM concentration limit and a performance standard for new hood and ventilation systems. – PM emissions at the outlet of any Tier 2 (>500 -7, 500 sq ft) or Tier 3 (>7, 500 sq ft) baghouse shall not exceed 0. 01 gr/dscf, immediately upon adoption of the rule. – Baghouse upgrade – Effective January 1, 2012, an existing manual shaker shall be upgraded or replaced to, at a minimum, an automated shaker unit. An operator shall not install a manual shaker baghouse after adoption of the rule. – If the PM emission limit (0. 01 gr/dscf) is exceeded, EPA’s verified filtration products or other technologies or methods approved by the Executive Officer shall be used, within three months, to meet the applicable requirements.
 SCAQMD PM Proposal. Monitoring The monitoring requirements: n five-minute visible emissions observation once a week using EPA Method 22 and continuous baghouse performance monitoring using a bag leak detection system (BLDS) for Tier 3 units. n A continuous opacity monitoring system (COMS) installed at an existing Tier 3 baghouse will changed to a BLDS, no later than January 1, 2015 or after the end of the useful life of a COMS, whichever occurs sooner.
 Gas-fired engines") NESHAP for Existing Stationary Engines n n n Stationary engine population (2008) Gas-fired engines – 320, 000 Diesel engines – 1, 100, 000 Over 80% of stationary diesel engines are used in emergency power applications Non-Emergency Applications – Power generation – Oil and gas transmission (e. g. , pipeline compression and transport) – Agricultural (e. g. , irrigation pumps, electricity generation, etc. ) – Other –pumps, welders, etc.
NESHAP for Existing Stationary Engines n n n Stationary engine population (2008) Gas-fired engines – 320, 000 Diesel engines – 1, 100, 000 Over 80% of stationary diesel engines are used in emergency power applications Non-Emergency Applications – Power generation – Oil and gas transmission (e. g. , pipeline compression and transport) – Agricultural (e. g. , irrigation pumps, electricity generation, etc. ) – Other –pumps, welders, etc.
 NESHAP for Existing Stationary Engines Stationary engines are contributors of: – NOx, VOC, HAP, CO 2, PM 2. 5(including carbon black) – Diesel PM 2. 5 emissions from stationary engines are less than 10% of total diesel PM 2. 5 mobile inventory Exhaust after treatment controls for non-emergency engines – Diesel > 300 HP at major or area source – 2 -and 4 -stroke lean burn gas-fired n 250 -500 HP at major source n ≥ 250 HP at area source – 4 -stroke rich burn gas-fired – 50 -500 HP at major source – ≥ 50 HP at area source
 NESHAP for Existing Stationary Engines Limits are based on: – Oxidation catalyst for diesel and 2 -and 4 -stroke lean burn gas-fired n Up to 90% reduction for HAP, CO, and VOC; 2530% reduction for PM 2. 5 – Non-selective catalytic reduction for 4 -stroke rich burn gas-fired n Up to 90% reduction for HAP, CO and NOx – Although most emission reductions target nonemergency engines, limits are set for both emergency and non-emergency engines located at major sources (per Brick MACT court decision)
 Compliance Requirements n Performance testing – Initial test only for: n n non-emergency engines 100 -500 HP at major source area sources subject to numerical standards (versus management practices) – Initial test plus subsequent test every 3 years or 8, 760 hours for: n non-emergency engines >500 HP (major or area source) – No test requirements for emergency engines n n Monitoring requirements for large engines Ultra-low sulfur diesel fuel for non-emergency CI > 300 HP
 Portland Cement - NSPS n June ’ 08 proposed NSPS – reduce the PM emission limit for kilns from 0. 3 lb/ton of dry feed to 0. 086 lb/ton of clinker – set limit on NOX emissions from kilns of 1. 50 lb/ton of clinker. – set limit on SO 2 emissions from kilns of 1. 33 lb/ton of clinker, or demonstrate a reduction in SO 2 emissions from the kiln of at least 90 percent. – add new monitoring options of a bag leak detector or PM CEMS for kilns and clinker coolers to demonstrate compliance with the PM limits in lieu of the requirement for continuous opacity monitoring systems (COMS).
 Portland Cement -NESHAP n May ’ 09 proposed NESHAP/MACT for cement kilns/in-line raw mills; coolers and dryers – Proposed performance specifications for mercury CEMS, and updating recordkeeping and testing requirements. PS-12 A and PS 12 -B. – Mercury - emissions limit of 43 lb/million tons clinker for existing sources and 14 lb/MM tons clinker for new sources. 30 day rolling average. – THC - emissions limit of 7 parts per million by volume (ppmv) for existing sources and 6 ppmv for new sources (measured dry and corrected to 7 percent oxygen). 30 rolling day average. PS-8 A. – PM - an emissions limit of 0. 085 pounds per ton (lb/ton) clinker for existing sources and 0. 080 lb/tons clinker for new sources. PM CEMS/PS-11. Remove opacity requirements in lieu of PM measurement. – Hydrochloric Acid - emissions limit of 2 ppmv for existing sources and 0. 1 ppmv for new sources, required to use a CEMS/PS-15.
 Proposed Cement MACT Emission Limits Proposed Emissions Limita Range of Current Emissions Existing Source New Source 12 to 3, 300 lb/MM tons clinker 43 lb/MM tons clinker (30 day average) 14 lb/MM tons feed (30 day average) <1 to 173 ppmv 7 ppmv for all kilnsb (30 day average) 6 ppmv for all kilns (30 day average) PM (Surrogate for nonmercury metal HAP) 0. 005 to 0. 50 lb/ton clinker 0. 085 lb/ton clinker 0. 080 lb/ton clinker HCl <1 to 75 ppmv 2 ppmv 0. 1 ppmv Hg THC (Surrogate for Organic HAP) For Hg, THC, and PM these limits would apply to major and area sources. For HCl these limits only apply to major sources. a b We believe this value may be biased low due to lack of data.
 Industrial Boilers Renewed focus on new and existing boilers will generate demand for controls and CEMS n Over 250 new boilers out through 2012; with steady growth of CEMS. n Over 500 existing boilers to be retrofit with CEMS 2010 -2012. n
") Industrial Boiler MACT Requirements n EPA Promulgated Industrial Boiler Maximum Achievable Control Technology (MACT) Rule in 2004. – The rule intended to control emissions of hazardous air pollutants (HAPs) from industrial, commercial, and institutional boilers and process heaters. – EPA anticipated ~58, 000 existing sources to be affected. (42, 000 boilers and 15, 000 process heaters) n Three Main Subcategories – – – Solid fuel sources Liquid fuel sources Gaseous fuel sources
Industrial Boiler MACT Requirements n EPA Promulgated Industrial Boiler Maximum Achievable Control Technology (MACT) Rule in 2004. – The rule intended to control emissions of hazardous air pollutants (HAPs) from industrial, commercial, and institutional boilers and process heaters. – EPA anticipated ~58, 000 existing sources to be affected. (42, 000 boilers and 15, 000 process heaters) n Three Main Subcategories – – – Solid fuel sources Liquid fuel sources Gaseous fuel sources
 Industrial Boiler MACT Additional Requirements – Alternative compliance options – Emissions averaging for all large-solid fuel fired boilers located at one site. – Health based emissions limits – Three ways to verify compliance alternative eligibility
 Existing Boiler Emission Standards
 PM or TSM HCL") New Boiler Emission Standards Subcategor y Emission Standards (lb/MM Btu) PM or TSM HCL Mercury CO New Solid fuel units 0. 025. 0003 . 02 3. 0 (20 ppm lb/TBtu ) 400 ppm @7% O 2 New liquid fuel units . 03 . 0005 400 ppm @ 3 %O 2
New Boiler Emission Standards Subcategor y Emission Standards (lb/MM Btu) PM or TSM HCL Mercury CO New Solid fuel units 0. 025. 0003 . 02 3. 0 (20 ppm lb/TBtu ) 400 ppm @7% O 2 New liquid fuel units . 03 . 0005 400 ppm @ 3 %O 2
 Compliance Options Conduct stack emission tests n Conduct fuel analysis n Emissions Averaging (large solid fuel units only) n Health based compliance alternative for HCl and TSM. n
 Compliance Monitoring
 • • Continuous compliance based on monitoring and maintaining operating") Compliance Monitoring (cont. ) • • Continuous compliance based on monitoring and maintaining operating limits Monitoring • Opacity (COMS)- dry control systems • Fuel (monthly records) • Scrubber parameters • CO (new units only) • CEMS for large units >100 million Btu hr • Annual CO test for other new units • Exempt data from < 50 % load and based upon a 30 day average.
Compliance Monitoring (cont. ) • • Continuous compliance based on monitoring and maintaining operating limits Monitoring • Opacity (COMS)- dry control systems • Fuel (monthly records) • Scrubber parameters • CO (new units only) • CEMS for large units >100 million Btu hr • Annual CO test for other new units • Exempt data from < 50 % load and based upon a 30 day average.
 Petitions for Reconsideration – EPA Received three petitions for reconsideration n Request clarification that rule allows for testing at the common stack rather than each stack n Lack of standards for all HAPs emitted on all subcategories n Health based compliance alternatives – State stakeholders questioned EPA’s emission data for affected sources used to set MACT floor n National Association for Clean Air Agencies (NACAA) issued permit guidance document n EPA issued a new Information Collection Request (ICR) – 350 sources expected to report emissions data by Sept 2009. – Court ordered EPA to re-propose rule by July 2009 and issue final rule by July 2010.
 Compliance Testing n Performance Test Requirements – Common EPA test method for PM, TSM, HCl, mercury and CO limits n EPA Method 1, 2, 3, 4 and 19 – For PM EPA Methods 5 or 17 – For TSM EPA Methods 29 – For HCl EPA Methods 26 or 26 A – For Mercury Methods 29 or 101 A n ASTM D 6422 -00 or PTC 19, Part 10 – For CO EPA Methods 10, 10 A or 10 B n ASTM D 6422 -00 (natural gas only)
 Proposed Rules n n n Methods to Measure Filterable and Condensable PM Emissions (methods 201 & 202 mods. ) Standards of Performance for New Sources: Test Method 2 H – volumetric stack flow for Title IV/SIP sources Refineries – proposed June ’ 08 NSPS – PM, NOx, SO 2, CO THC
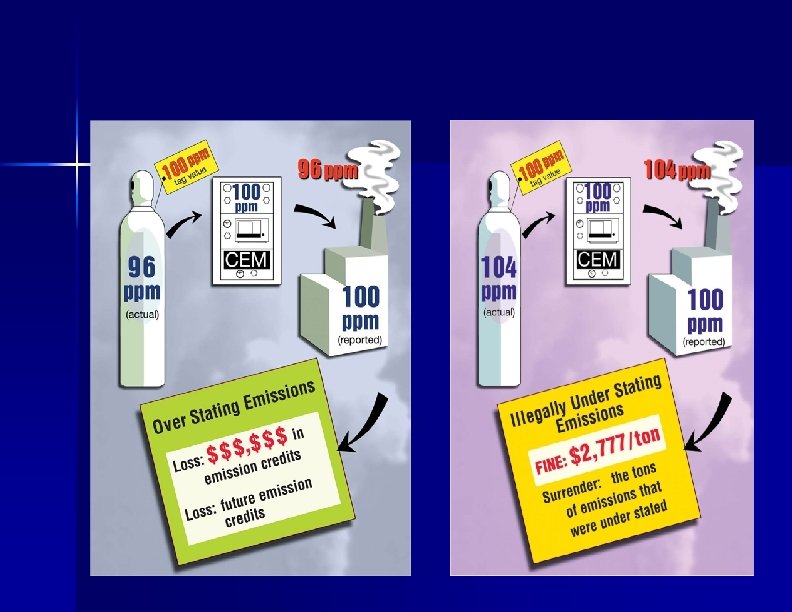
 Why Accurate Measurements n n n CEMS require daily calibration Without regular calibration the monitors may be reporting incorrectly which could be costly! Verify accurate readings due to drift for CEMS and other gas analyzers.
 457 -0911 Institute of") Thank You David C. Foerter, Executive Director dfoerter@icac. com (202) 457 -0911 Institute of Clean Air Companies 1730 M Street, NW, Suite 206 Washington, DC 20036 www. icac. com
Thank You David C. Foerter, Executive Director dfoerter@icac. com (202) 457 -0911 Institute of Clean Air Companies 1730 M Street, NW, Suite 206 Washington, DC 20036 www. icac. com