
Lecture 2 National Accounts Measuring Output and


lecture_2._national_accounts.ppt
- Размер: 5 Mегабайта
- Количество слайдов: 63
Описание презентации Lecture 2 National Accounts Measuring Output and по слайдам
Lecture 2 National Accounts Measuring Output and Income • Gross Domestic Product • Approaches for Calculating GDP • Other Variables of National Accounts • Nominal and Real GDP • Price Indexes • GDP Gaps
Major Variables of National Accounts The main indicators of aggregate output and aggregate income in the economy can be found in the National Income and Product Accounts (NIPA) System , proposed in the late 1920 s by the group of U. S. economists from NBER, headed by the future Nobel prize winner Simon Kuznets. The major measures of aggregate output are: • Gross Domestic Product • Gross National Product • Net Domestic Product • Net National Product The major measures of aggregate income are: • National Income • Personal Income • Disposable Personal Income
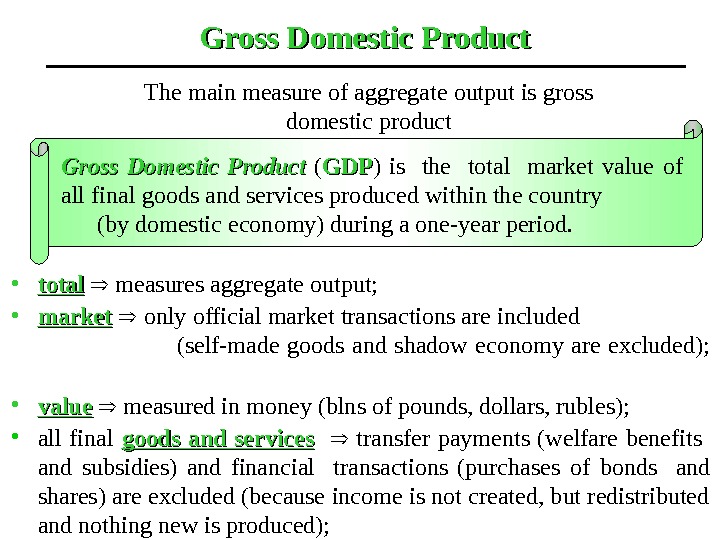
• total measures aggregate output; • market only official market transactions are included (self-made goods and shadow economy are excluded); • value measured in money (blns of pounds, dollars, rubles); • all final goods and services transfer payments (welfare benefits and subsidies) and financial transactions (purchases of bonds and shares) are excluded (because income is not created, but redistributed and nothing new is produced); Gross Domestic Product ( GDPGDP ) is the total market value of all final goods and services produced within the country (by domestic economy) during a one-year period. Gross Domestic Product The main measure of aggregate output is gross domestic product
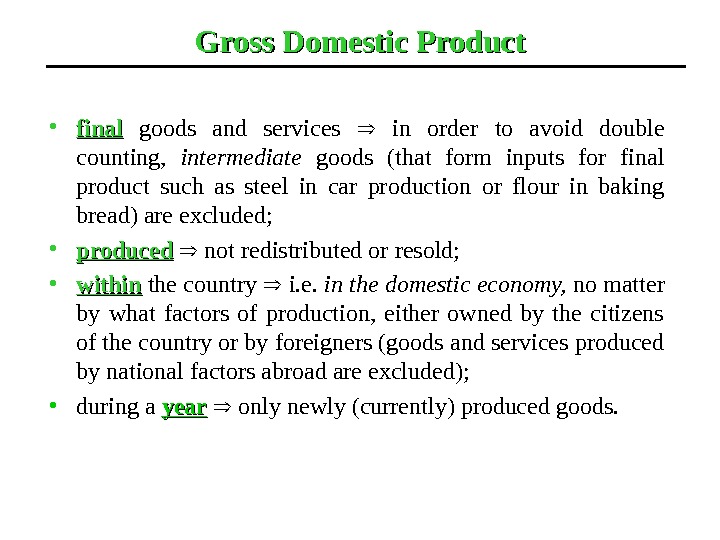
Gross Domestic Product • final goods and services in order to avoid double counting, intermediate goods (that form inputs for final product such as steel in car production or flour in baking bread) are excluded; • produced not redistributed or resold; • within the country i. e. in the domestic economy, no matter by what factors of production, either owned by the citizens of the country or by foreigners (goods and services produced by national factors abroad are excluded); • during a year only newly (currently) produced goods.
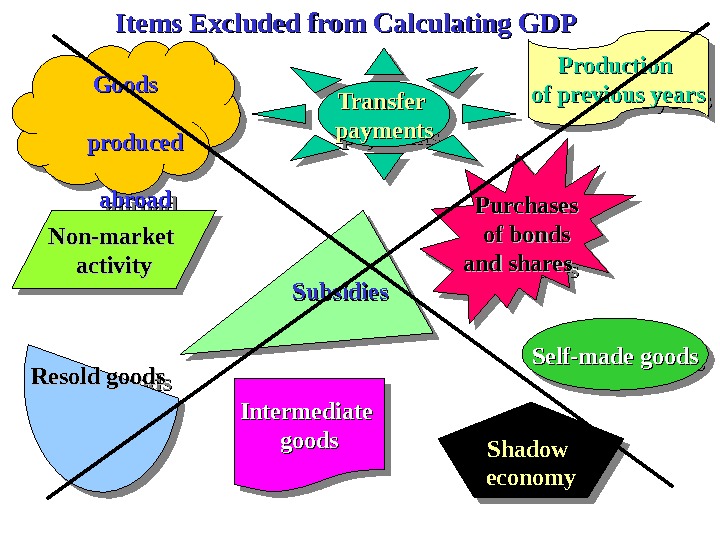
Self-made production Shadow economyeconomy. Resold goods Goods produced abroadabroad Subsidies Purchases of bonds and sharesand shares Production of previous yearsof previous years Transfer payments Non-market activity Intermediate goods Self-made goods. Items Excluded from Calculating GDP
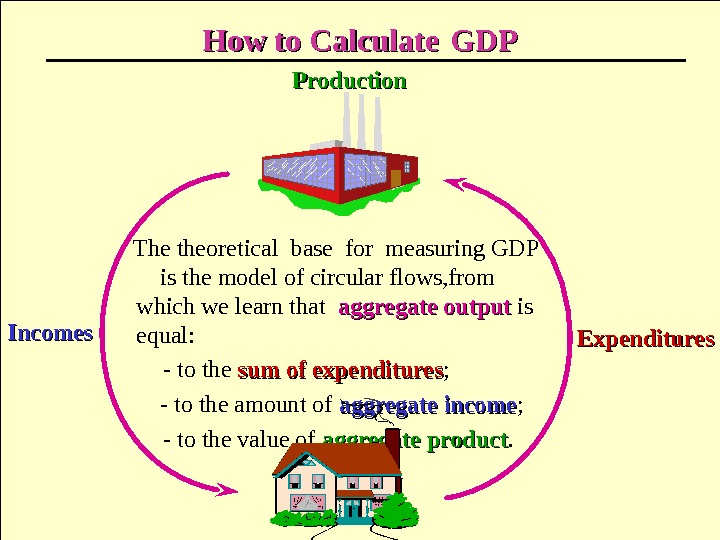
How to Calculate GDPGDP The theoretical base for measuring GDP is the model of circular flows, from which we learn that aggregate output is equal: — to the sum of expenditures ; — to the amount of aggregate income ; — to the value of aggregate product. Incomes Expenditures. Production
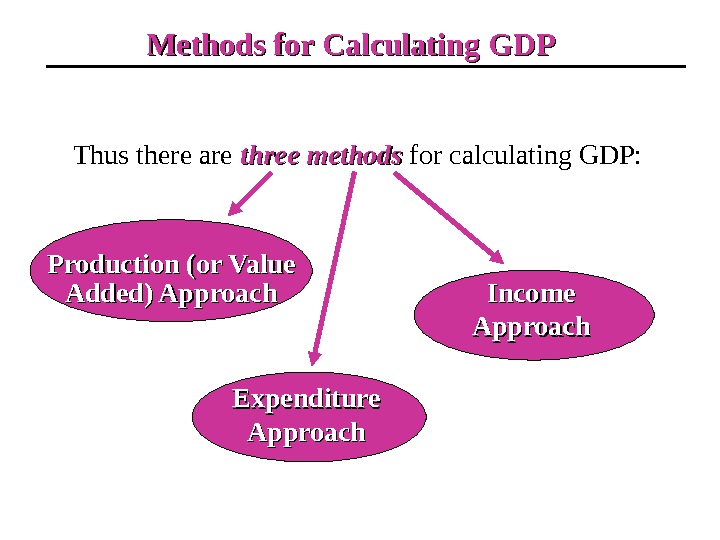
Methods for Calculating GDP Thus there are three methods for calculating GDP: Production (or Value Added) Approach Expenditure Approach Income Approach
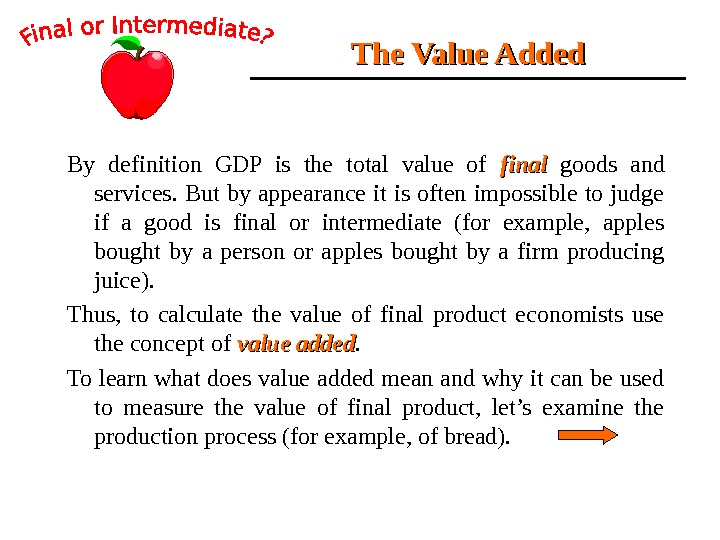
The Value Added By definition GDP is the total value of final goods and services. But by appearance it is often impossible to judge if a good is final or intermediate (for example, apples bought by a person or apples bought by a firm producing juice). Thus, to calculate the value of final product economists use the concept of value added. To learn what does value added mean and why it can be used to measure the value of final product, let’s examine the production process (for example, of bread).
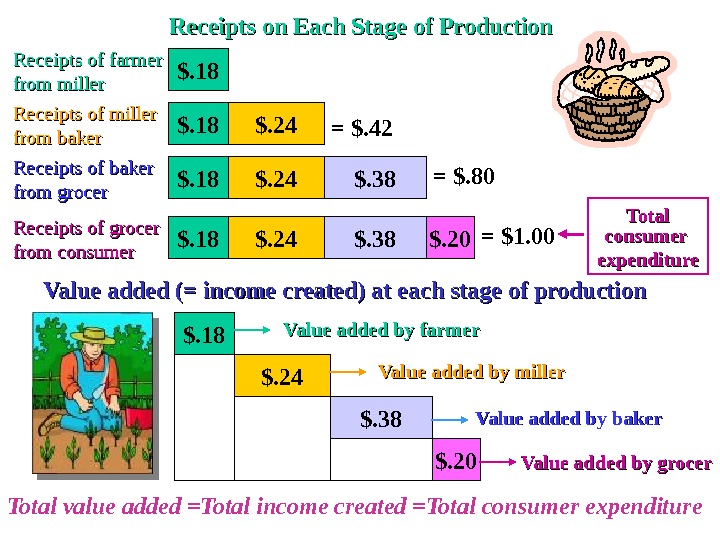
Receipts of farmer from miller Receipts of miller from baker Receipts of grocer from consumer Receipts of baker from grocer Value added by grocer. Value added by baker Value added by miller. Value added by farmer $. 18 $. 24 $. 38 $. 20$. 18 $. 24 $. 38$. 24$. 18 $. 20$. 24$. 18 $. 38 Receipts on Each Stage of Production Value added (= income created) at each stage of production Total consumer expenditure = $1. 00= $. 42 = $. 80 Total value added =Total income created =Total consumer expenditure
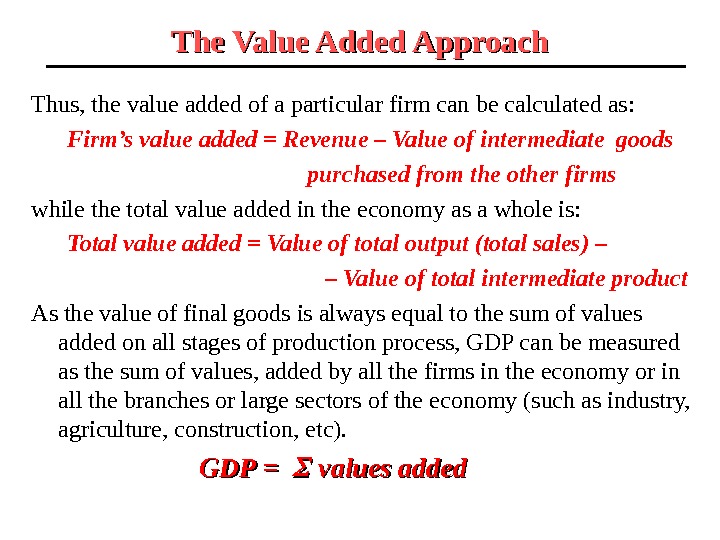
The Value Added Approach Thus, the value added of a particular firm can be calculated as: Firm’s value added = Revenue – Value of intermediate goods purchased from the other firms while the total value added in the economy as a whole is: Total value added = Value of total output (total sales) – – Value of total intermediate product As the value of final goods is always equal to the sum of values added on all stages of production process, GDP can be measured as the sum of values, added by all the firms in the economy or in all the branches or large sectors of the economy (such as industry, agriculture, construction, etc). GDP = values added
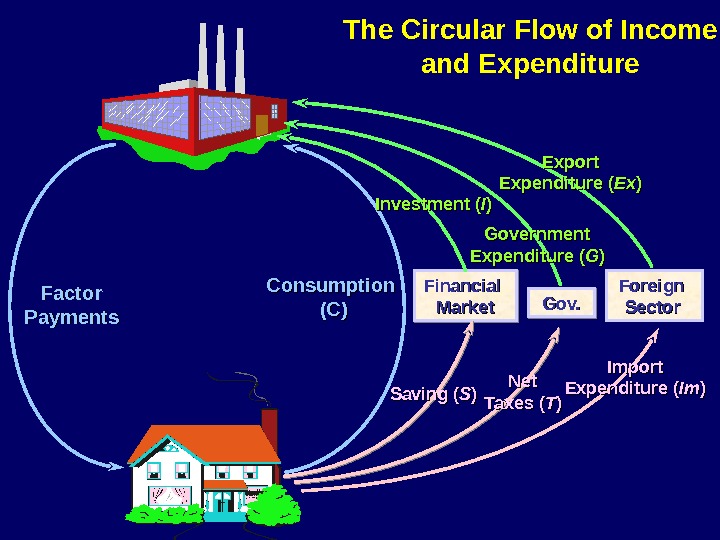
Financial Market Foreign Sector Import Expenditure ( Im. Im ))The Circular Flow of Income and Expenditure Factor Payments Export Expenditure ( Ex. Ex )) Saving ( SS )) Gov. Net Taxes ( TT ))Investment ( II )) Government Expenditure ( GG )) Consumption (C)(C)
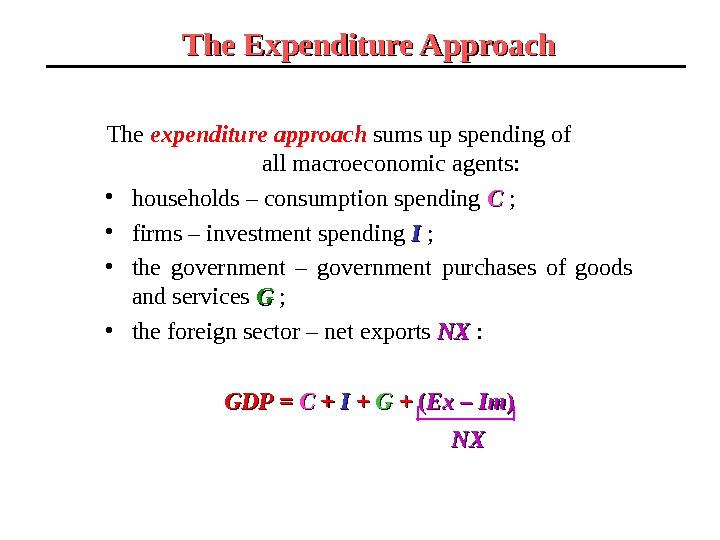
The expenditure approach sums up spending of all macroeconomic agents: • households – consumption spending CC ; • firms – investment spending II ; • the government – government purchases of goods and services GG ; • the foreign sector – net exports NXNX : GDPGDP = = CC + + II + + GG + + (( Ex – Im )) NXNXThe Expenditure Approach
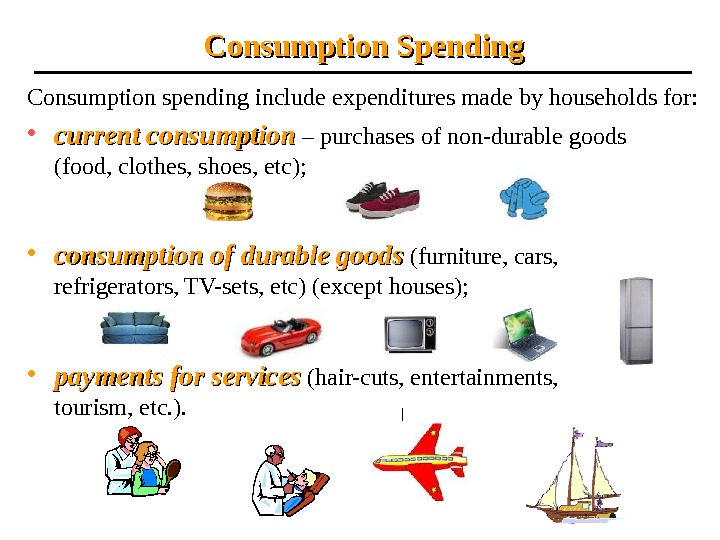
Consumption spending include expenditures made by households for: • current consumption – purchases of non-durable goods (food, clothes, shoes, etc); • consumption of durable goods (furniture, cars, refrigerators, TV-sets, etc) (except houses); • payments for services (hair-cuts, entertainments, tourism, etc. ). Consumption Spending
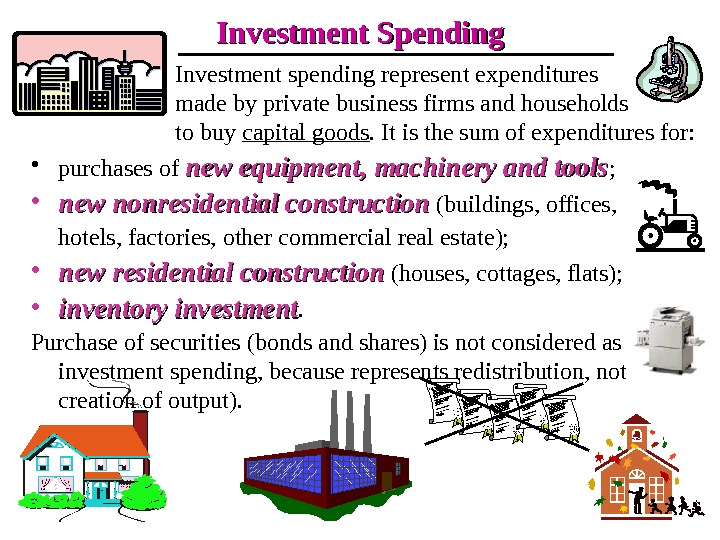
Investment Spending Investment spending represent expenditures made by private business firms and households to buy capital goods. It is the sum of expenditures for: • purchases of new equipment, machinery and tools ; • newnew nonresidential construction (buildings, offices, hotels, factories, other commercial real estate); • newnew residential construction (houses, cottages, flats); • inventory investment. Purchase of securities (bonds and shares) is not considered as investment spending, because represents redistribution, not creation of output).
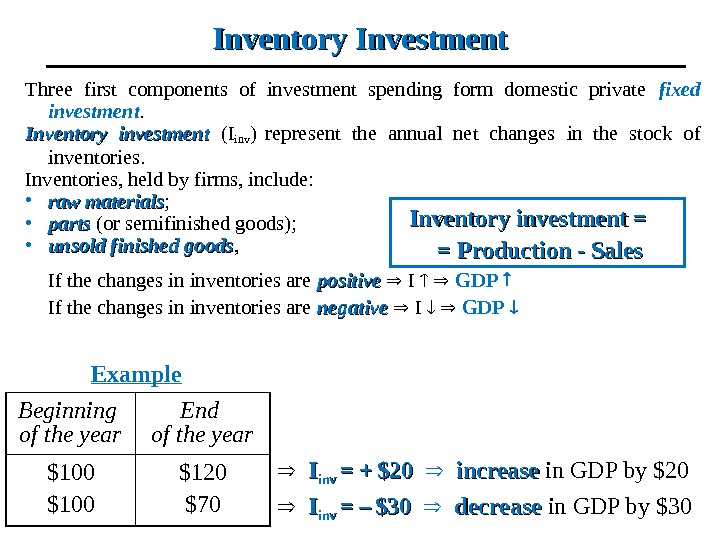
Inventory Investment Three first components of investment spending form domestic private fixed investment. Inventory investment (I inv ) represent the annual net changes in the stock of inventories. Inventories, held by firms, include: • raw materials ; • parts (or semifinished goods); • unsold finished goods , If the changes in inventories are positive I GDP If the changes in inventories are negative I GDP Example Beginning of the year End of the year $100 $120 $70 II inv = += + $20$20 increase in GDP by $20 II inv = = –– $30$30 decrease in GDP by $30 Inventory investment = = Production — Sales
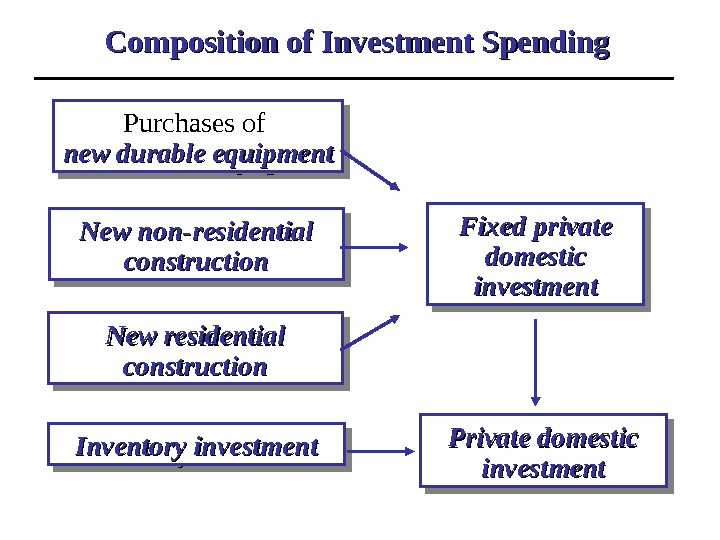
Composition of Investment Spending Purchases of newnew durable equipmentdurable equipment New non-residential construction New residential construction Fixed private domestic investment Private domestic investmentinvestment. Inventory investment
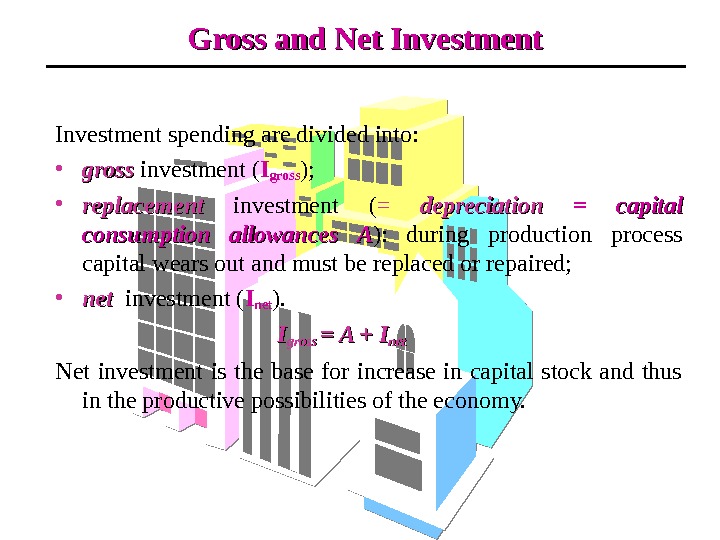
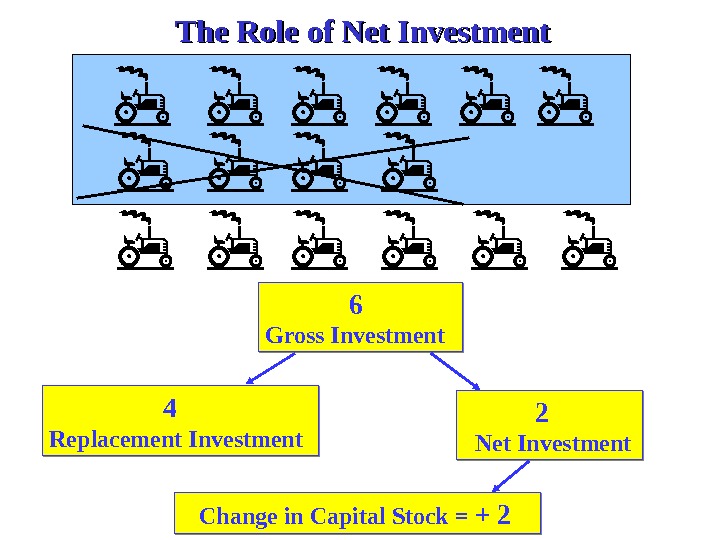
Investment spending are divided into: • gross investment ( Igross ); • replacement investment ( = depreciation = capital consumption allowances AA ): during production process capital wears out and must be replaced or repaired; • netnet investment ( I net ). II gross = A + Inetnet Net investment is the base for increase in capital stock and thus in the productive possibilities of the economy. Gross and Net Investment
6 Gross Investment 4 Replacement Investment 2 Net Investment Change in Capital Stock = + 2 The Role of Net Investment
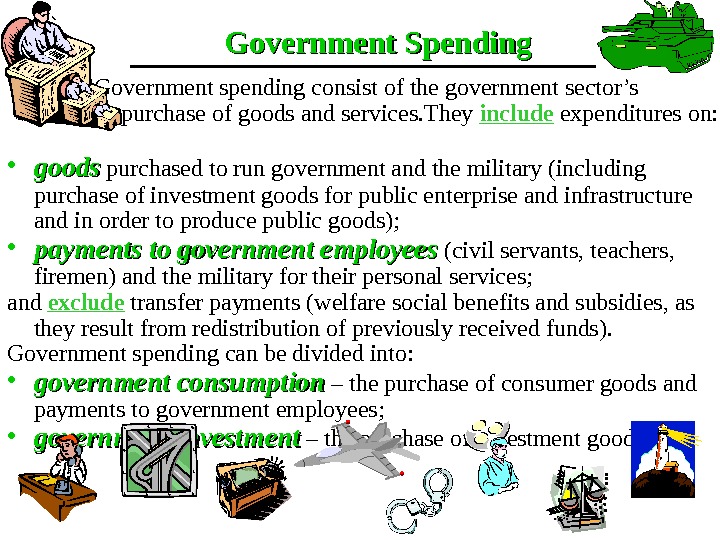
Government spending consist of the government sector’s purchase of goods and services. They include expenditures on: • goods purchased to run government and the military (including purchase of investment goods for public enterprise and infrastructure and in order to produce public goods); • payments to government employees (civil servants, teachers, firemen) and the military for their personal services; and exclude transfer payments (welfare social benefits and subsidies, as they result from redistribution of previously received funds). Government spending can be divided into: • government consumption – the purchase of consumer goods and payments to government employees; • government investment – the purchase of investment goods. Government Spending
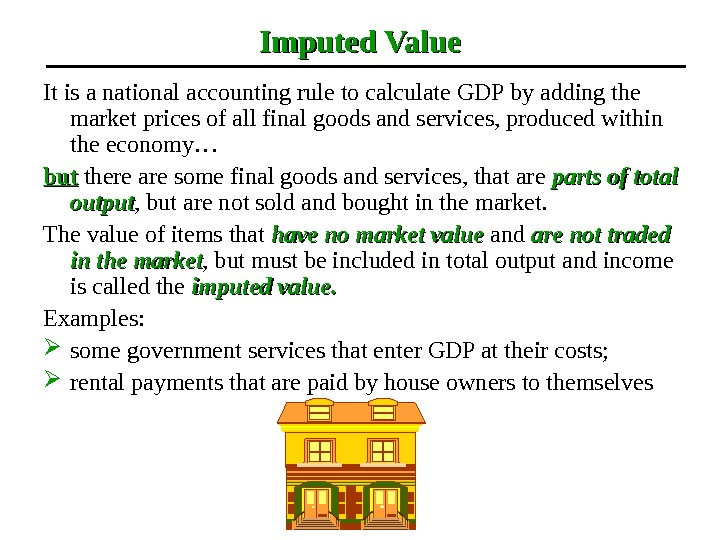
Imputed Value It is a national accounting rule to calculate GDP by adding the market prices of all final goods and services, produced within the economy… butbut there are some final goods and services, that are parts of total output , but are not sold and bought in the market. The value of items that have no market value and are not traded in the market , but must be included in total output and income is called the imputed value. Examples: some government services that enter GDP at their costs; rental payments that are paid by house owners to themselves
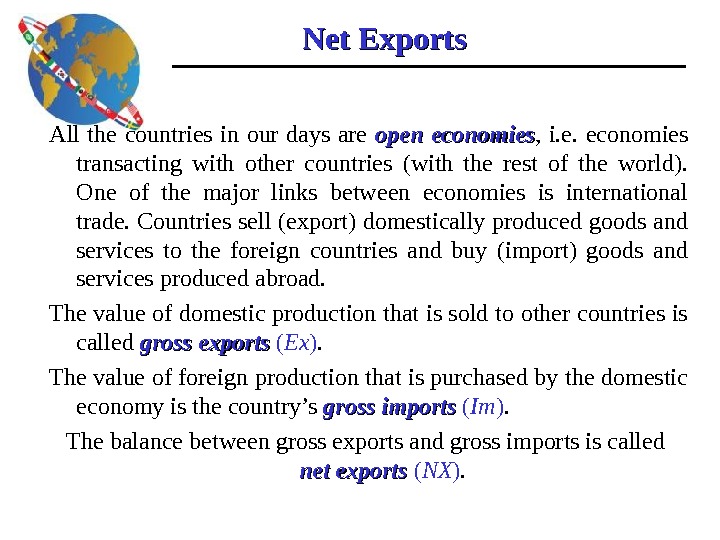
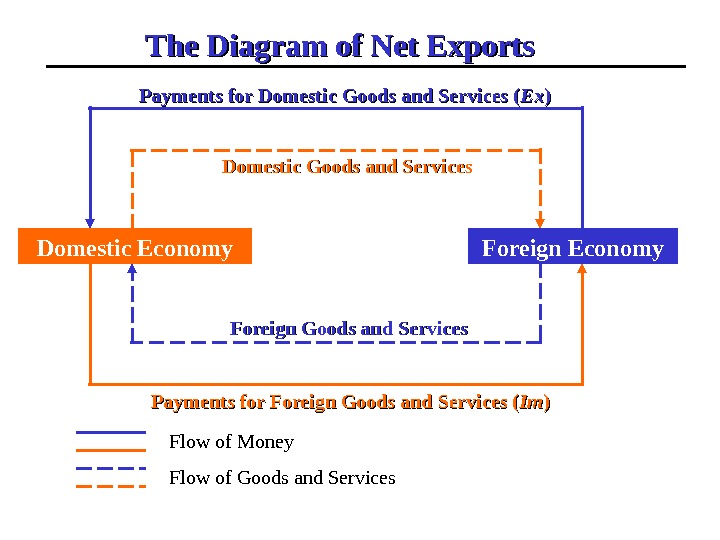
Net Exports All the countries in our days are open economies , i. e. economies transacting with other countries (with the rest of the world). One of the major links between economies is international trade. Countries sell (export) domestically produced goods and services to the foreign countries and buy (import) goods and services produced abroad. The value of domestic production that is sold to other countries is called gross exports ( Ex ). The value of foreign production that is purchased by the domestic economy is the country’s gross imports ( Im ). The balance between gross exports and gross imports is called net exports ( NX ).
Domestic Economy Foreign Economy. The Diagram of Net Exports Domestic Goods and Services Foreign Goods and Services Payments for Domestic Goods and Services ( Ex. Ex )) Payments for Foreign Goods and Services ( Im. Im )) Flow of Money Flow of Goods and Services
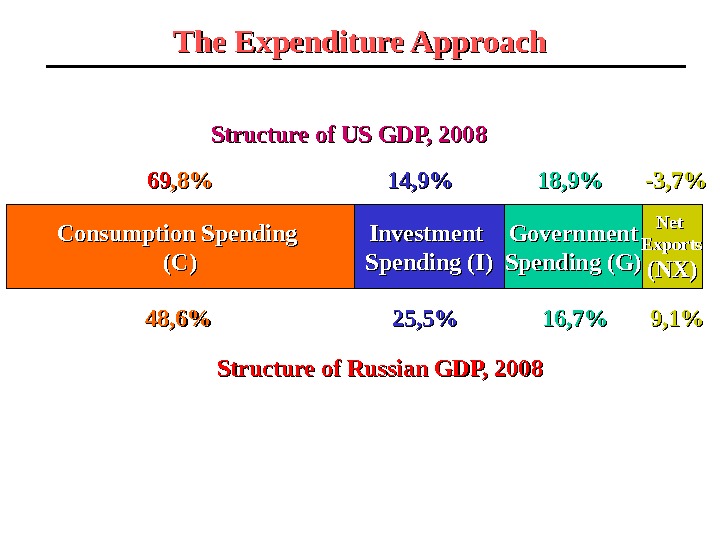
The Expenditure Approach Consumption Spending (C)(C) Investment Spending (I) Government Spending (G) Net Exports (NX)Structure of US GDP, 200 88 6969 , , 88 %% 11 44 , , 99 %% 11 88 , , 99 %% — 33 , , 77 %% Structure of Russian GDP, 200 88 44 88 , , 66 %% 22 55 , , 55 %% 11 66 , , 77 %% 99 , , 11 %%
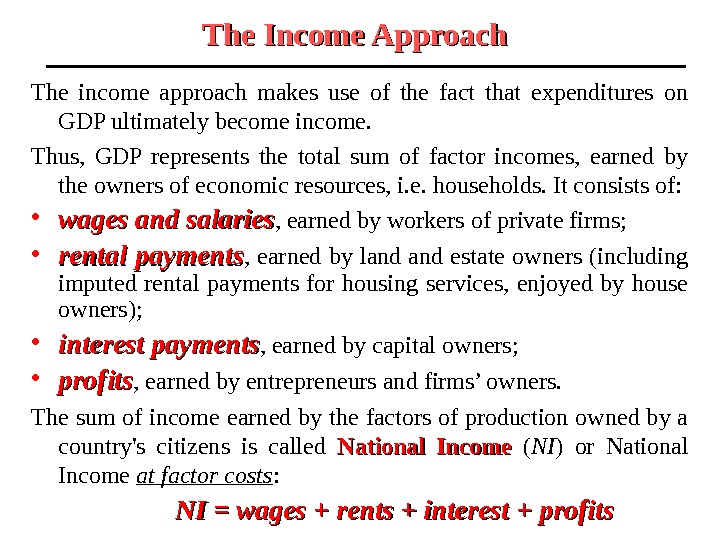
The Income Approach The income approach makes use of the fact that expenditures on GDP ultimately become income. Thus, GDP represents the total sum of factor incomes, earned by the owners of economic resources, i. e. households. It consists of: • wages and salaries , earned by workers of private firms; • rental payments , earned by land estate owners (including imputed rental payments for housing services, enjoyed by house owners); • interest payments , earned by capital owners; • profits , earned by entrepreneurs and firms’ owners. The sum of income earned by the factors of production owned by a country’s citizens is called National Income ( NI ) or National Income at factor costs : NI = wages + rents + interest + profits
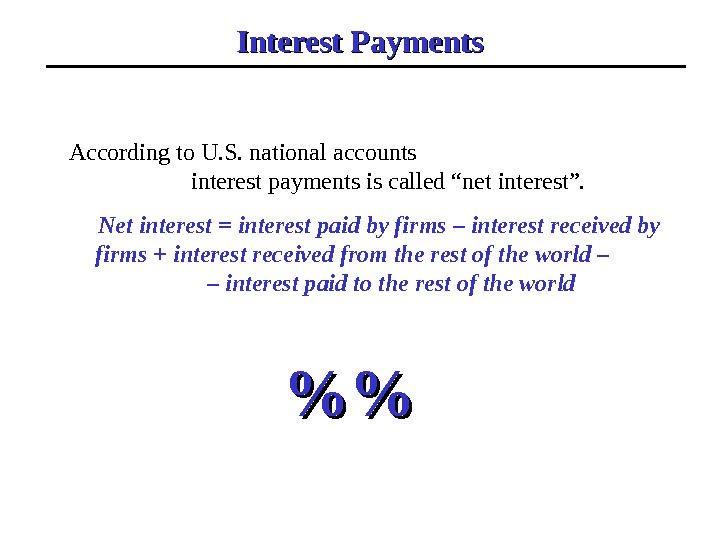
Interest Payments According to U. S. national accounts interest payments is called “net interest”. Net interest = interest paid by firms – interest received by firms + interest received from the rest of the world – – interest paid to the rest of the world %%%%
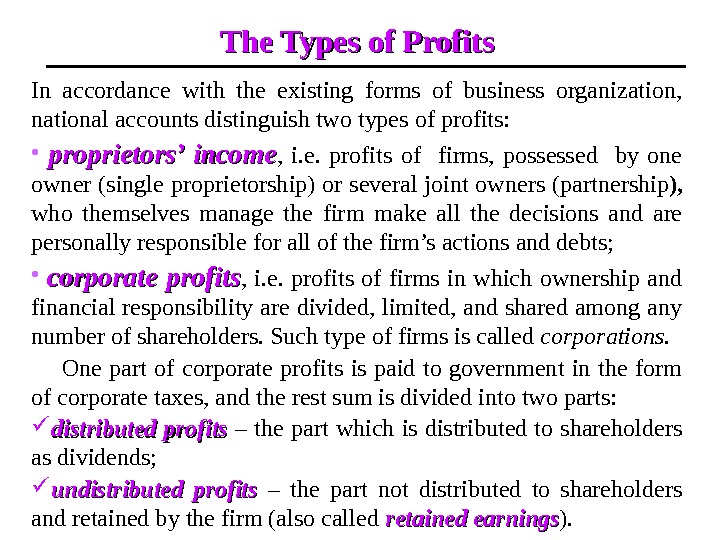
The Types of Profits In accordance with the existing forms of business organization, national accounts distinguish two types of profits: • proprietors’ income , i. e. profits of firms, possessed by one owner (single proprietorship ) or several joint owners ( partnership ), who themselves manage the firm make all the decisions and are personally responsible for all of the firm’s actions and debts; • corporate profits , i. e. profits of firms in which ownership and financial responsibility are divided, limited, and shared among any number of shareholders. Such type of firms is called corporations. One part of corporate profits is paid to government in the form of corporate taxes, and the rest sum is divided into two parts: distributed profits – the part which is distributed to shareholders as dividends; undistributed profits – the part not distributed to shareholders and retained by the firm (also called retained earnings ).
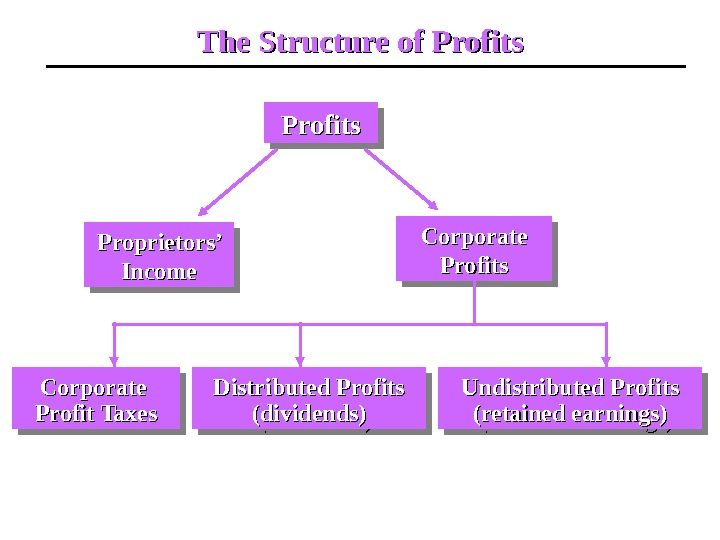
The Structure of Profits Proprietors’ Income Corporate Profits Undistributed Profits (retained earnings)Undistributed Profits (retained earnings)Distributed Profits (dividends)(dividends)Corporate Profit Taxes
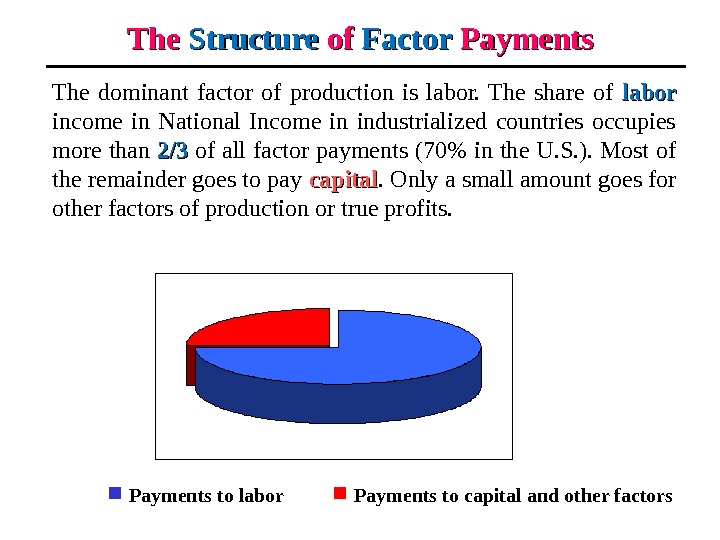
The Structure of of Factor Payments The dominant factor of production is labor. The share of labor income in National Income in industrialized countries occupies more than 2/32/3 of all factor payments (70% in the U. S. ). Most of the remainder goes to pay capital. Only a small amount goes for other factors of production or true profits. Payments to labor Payments to capital and other factors
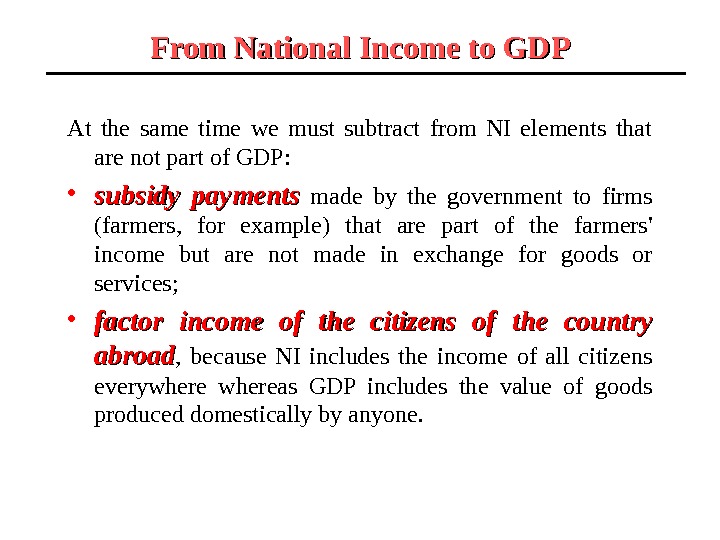
From National Income to GDP National Income must be modified slightly to arrive at GDP. We must add components that are necessary for calculating aggregate output, but not included in National Income as they do not become income for suppliers of productive resources: • depreciation , because these expenses capture the value of output needed to replace or repair worn out buildings and machinery; • indirect taxes (sales taxes, value-added taxes, customs duties, license fees, and so on), because they are part of the expenditure on goods and services and are included in prices; • factor income of foreigners received for the use of their economic resources in the country, whose GDP is calculated.
From National Income to GDP At the same time we must subtract from NI elements that are not part of GDP: • subsidy payments made by the government to firms (farmers, for example) that are part of the farmers’ income but are not made in exchange for goods or services; • factor income of the citizens of the country abroad , because NI includes the income of all citizens everywhereas GDP includes the value of goods produced domestically by anyone.
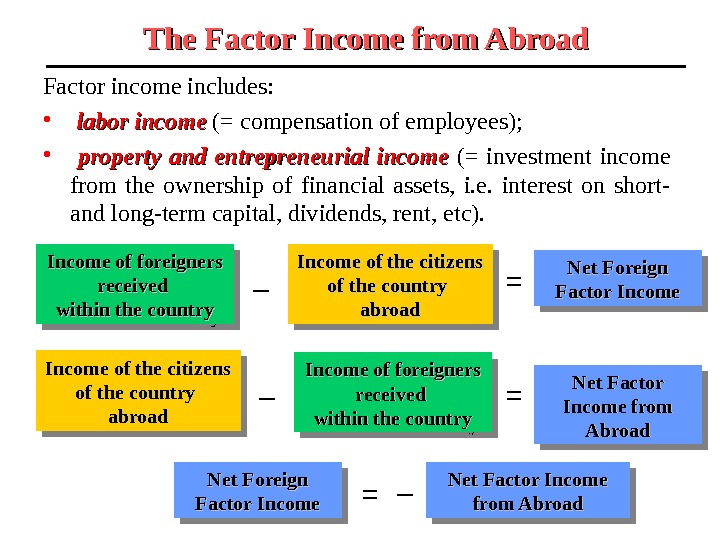
The Factor Income from Abroad Income of foreigners received within the country Income of the citizens of the country abroad Net Foreign Factor Income Net Factor Income from Abroad Net Foreign Factor Income Net Factor Income from Abroad = – Income of foreigners received within the countrywithin the country. Income of the citizens of the country abroad – = = – Factor income includes: • labor income (= compensation of employees); • property and entrepreneurial income (= investment income from the ownership of financial assets, i. e. interest on short- and long-term capital, dividends, rent, etc).
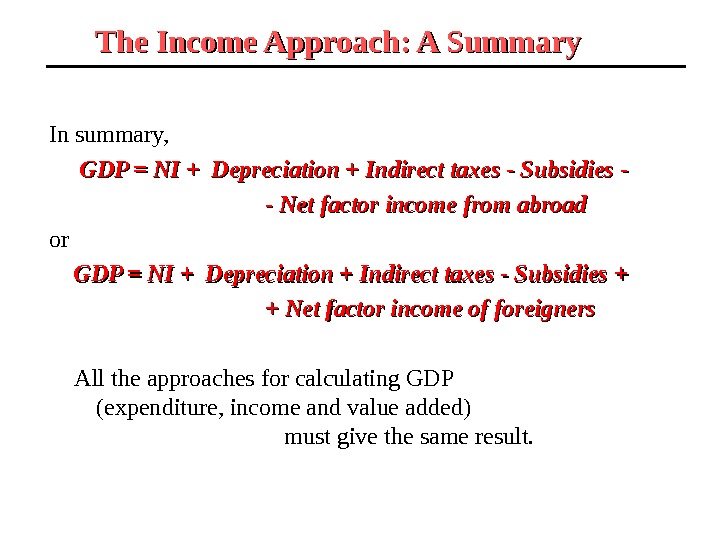
The Income Approach: A Summary In summary, GDP = NI + Depreciation + Indirect taxes — Subsidies — — Net factor income from abroad or GDP = NI + Depreciation + Indirect taxes — Subsidies ++ + Net factor income of foreigners All the approaches for calculating GDP (expenditure, income and value added) must give the same result.
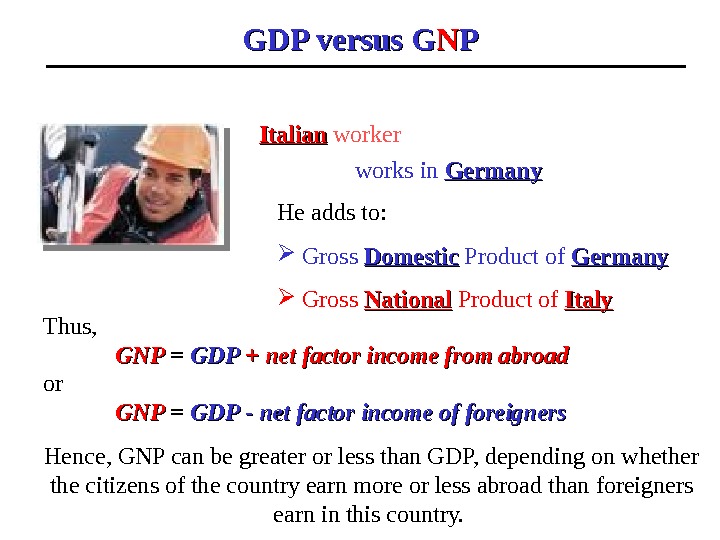
Gross National Product ( GNPGNP ) is the total market value of all final goods and services produced within a year by factors of production owned by the citizens of that country. It doesn’t matter where the output is actually produced: in the domestic economy or abroad.
GDP versus G NN PP He adds to: Gross Domestic Product of Germany Gross National Product of Italyworks in Germany. Italian worker Thus, GNPGNP = GDPGDP ++ nn et factor income from abroad or GNPGNP = GDPGDP — net factor income of foreigners Hence, GNP can be greater or less than GDP, depending on whether the citizens of the country earn more or less abroad than foreigners earn in this country.
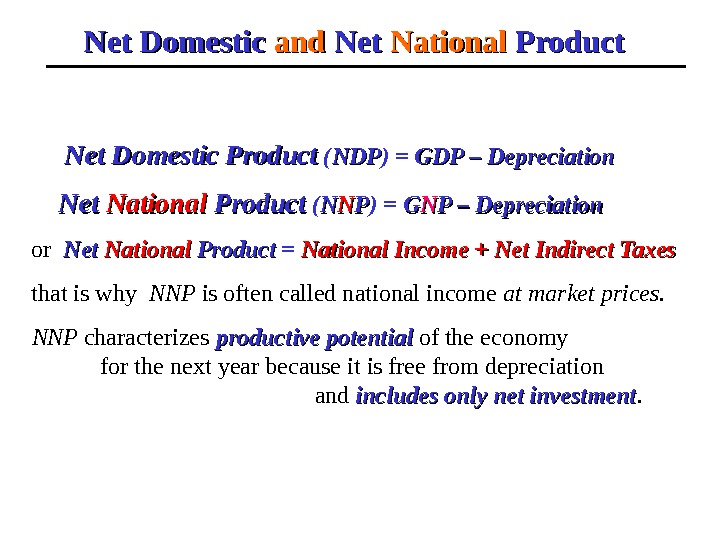
Net Domestic and Net National Product Net Domestic Product ( NDPNDP ) = GDP – Depreciation Net National Product ( NN NN PP ) = GG NN P – Depreciation or Net National Product = National Income + Net Indirect Taxes that is why NNP is often called national income at market prices. NNP characterizes productive potential of the economy for the next year because it is free from depreciation and includes only net investment.
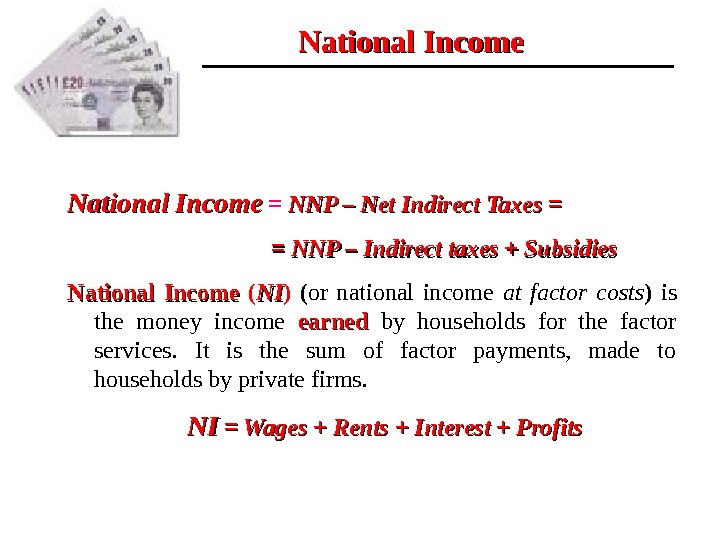
National Income = NNP – Net Indirect Taxes = = = = NNP –– Indirect taxes + Subsidies National Income ( NINI ) ( or national income at factor costs ) is the money income earned by households for the factor services. It is the sum of factor payments, made to households by private firms. NINI = Wages + Rents + Interest + Profits
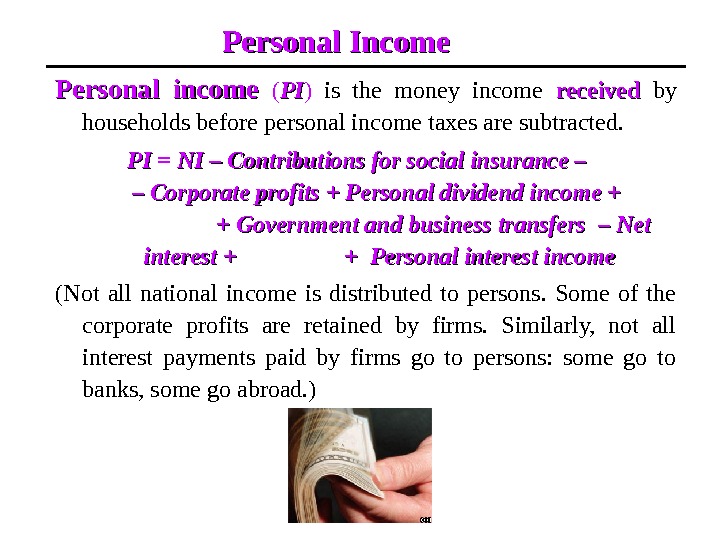
Personal Income Personal income ( PIPI ) is the money income received by households before personal income taxes are subtracted. PI PI = NI – Contributions for social insurance – – Corporate profits + Personal dividend income + + Government and business transfers – Net interest + + Personal interest income (Not all national income is distributed to persons. Some of the corporate profits are retained by firms. Similarly, not all interest payments paid by firms go to persons: some go to banks, some go abroad. )
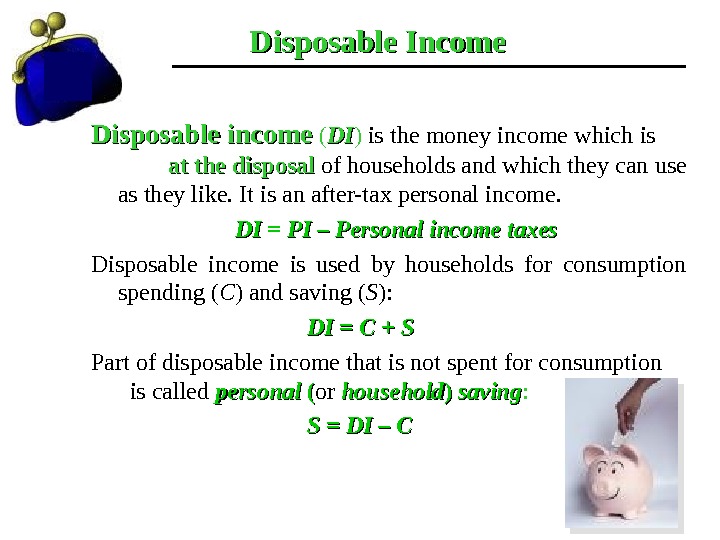
Disposable Income Disposable income ( DIDI ) is the money income which is at the disposal of households and which they can use as they like. It is an after-tax personal income. DI DI = PI – Personal income taxes Disposable income is used by households for consumption spending ( C ) and saving ( S ): DI = C + S Part of disposable income that is not spent for consumption is called personal (( or household )) saving : S = DI –
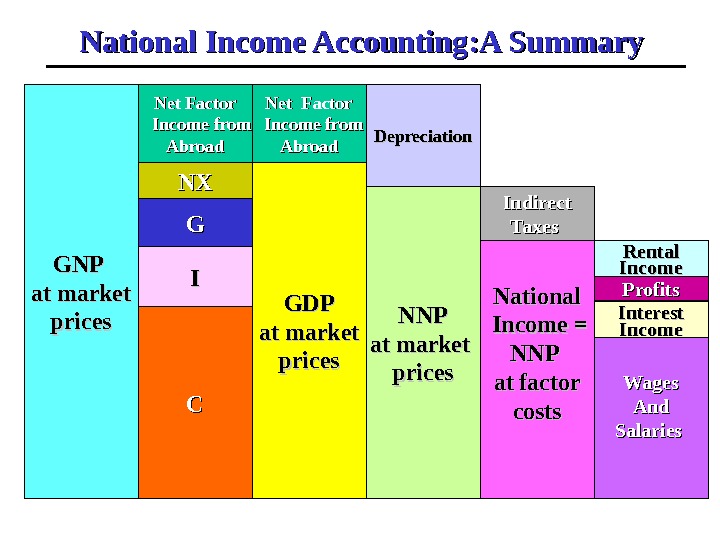
National Income Accounting: A Summary GNP at market prices CC GDPGDP at market prices NNPNNP at market prices. Net Factor Income from Abroad National Income = NNP at factor costs Wages And Salaries IIGGNXNX Net Factor Income from Abroad Depreciation Indirect Taxes Interest Income Profits Rental Income
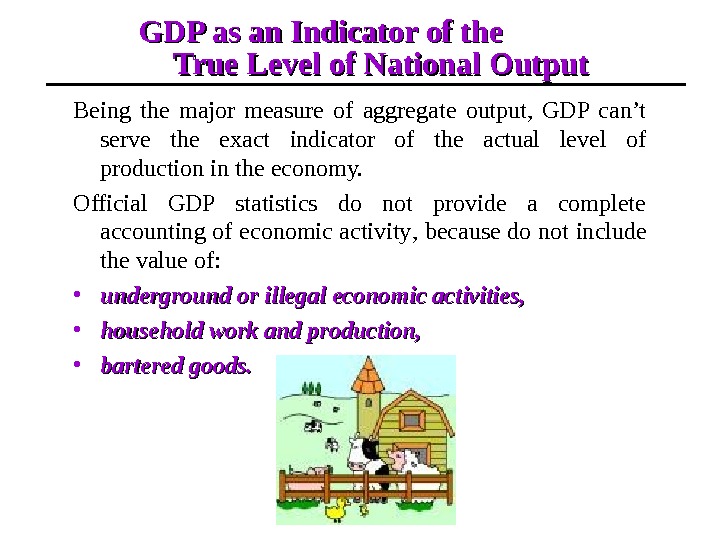
GDP as an Indicator of the True Level of National Output Being the major measure of aggregate output, GDP can’t serve the exact indicator of the actual level of production in the economy. Official GDP statistics do not provide a complete accounting of economic activity , because do not include the value of: • underground or illegal economic activities, • household work and production, • bartered goods.
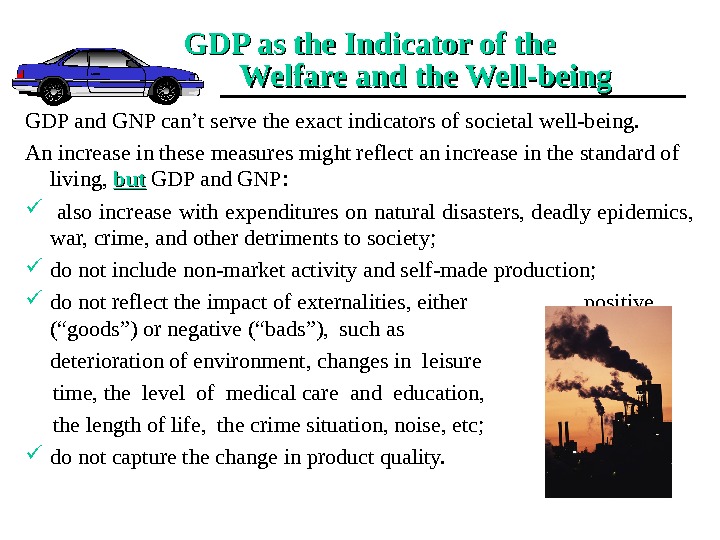
GDP as the Indicator of the Welfare and the Well-being GDP and GNP can’t serve the exact indicators of societal well-being. An increase in these measures might reflect an increase in the standard of living, butbut GDP and GNP: also increase with expenditures on natural disasters, deadly epidemics, war, crime, and other detriments to society; do not include non-market activity and self-made production; do not reflect the impact of externalities, either positive (“goods”) or negative (“bads”), such as deterioration of environment, changes in leisure time, the level of medical care and education, the length of life, the crime situation, noise, etc; do not capture the change in product quality.
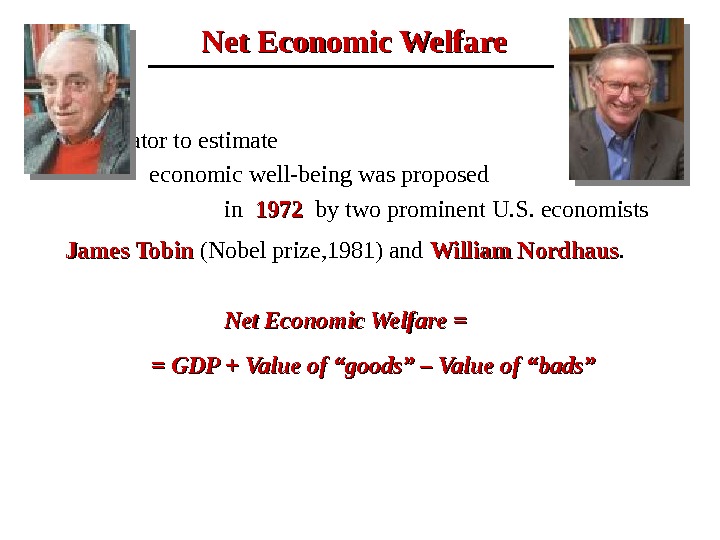
Net Economic Welfare This indicator to estimate economic well-being was proposed in 1972 by two prominent U. S. economists James Tobin (Nobel prize, 1981) and William Nordhaus. Net Economic Welfare = = GDP + Value of “goods” – Value of “bads”
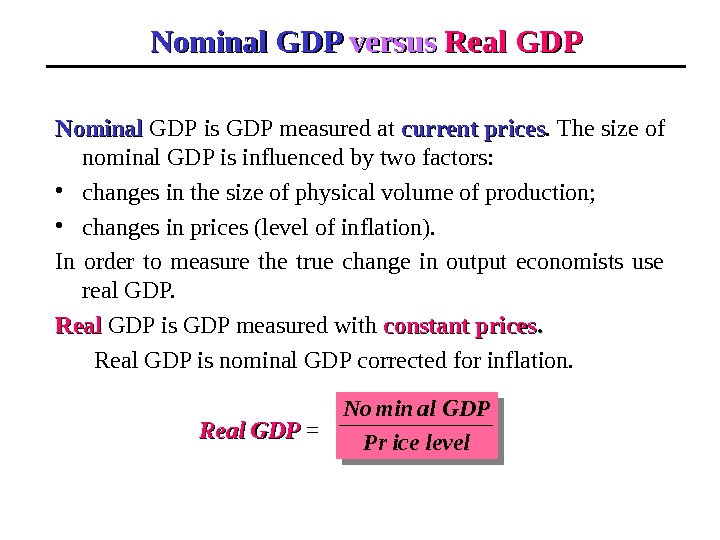
Nominal GDP versus Real GDP Nominal GDP is GDP measured at current prices. The size of nominal GDP is influenced by two factors: • changes in the size of physical volume of production; • changes in prices (level of inflation). In order to measure the true change in output economists use real GDP. Real GDP is GDP measured with constant prices. . Real GDP is nominal GDP corrected for inflation. Real GDP = levelice. Pr GDPalmin. No
Example Imagine, that the economy producers only bananas. Quantity (in tons) QQ Price (in dollars) PP Nominal GDP (in current prices) Real GDP (in prices of 200 88 )) Year 200200 88 100100 150150 150 × 100= 15000 Year 200200 99 8080 200200 200 × 80 = 16000 150 × 80 = 12000 In 200 9 the real GDP decreased while the nominal GDP increased due to the increase in prices.
If economy produces a great number of goods ( n goods, for example), then the value of Nominal GDP versus Real GDP Nominal GDP = current year prices × current year quantities t in i t i. QP 1 the value of Real GDP = base year prices × current year quantities = t i n i i. QP 1 0 where and are the prices for good i correspondingly in the current ( t ) year and in the base ( 0 ) year; and are the quantities of good i produced correspondingly in the current ( t ) year and in the base ( 0 ) year. 0 i. P t i. P 0 i. Q t i. Q
Price Indexes The measures of general price level are: • Consumer Price Index – CPI; • Producer Price Index – PPI; • GDP Deflator. Price indices are used to measure inflation and adjust nominal values for inflation to find real values
The Consumer Price Index • is based on the prices of items in a fixed representative «market basket» of hundreds of final goods and services used by typical urban consumers in a base year ; • is the government’s gauge of inflation in the US; • is considered to be the best measure of the cost of living ; • is used, for example, to adjust tax brackets and social security payments and wages for inflation (i. e. indexation); • is calculated as Laspeyres index , i. e. fixed basket (base year) quantities index: CPICPI = 100 1 0 n i ii n i i t i QP QP 100 quantitiesyear. Basepricesyear. Base quantitiesyear. Basepricesyear. Current
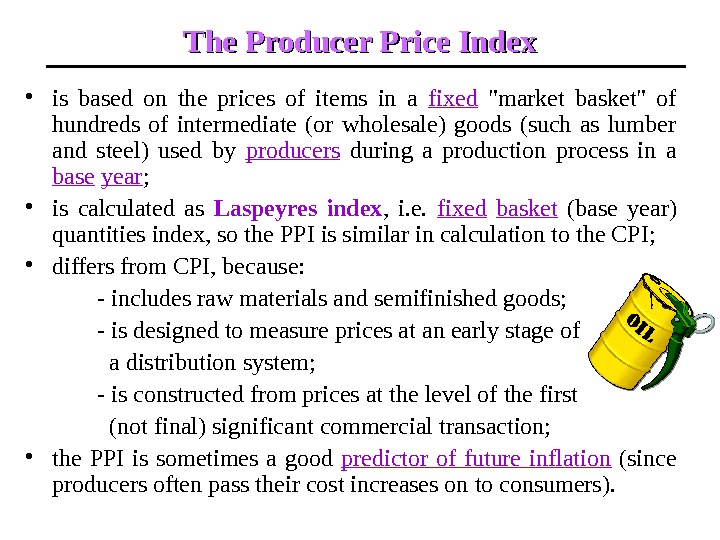
The Producer Price Index • is based on the prices of items in a fixed «market basket» of hundreds of intermediate (or wholesale) goods (such as lumber and steel) used by producers during a production process in a base year ; • is calculated as Laspeyres index , i. e. fixed basket (base year) quantities index, so the PPI is similar in calculation to the CPI; • differs from CPI, because: — includes raw materials and semifinished goods; — is designed to measure prices at an early stage of a distribution system; — is constructed from prices at the level of the first (not final) significant commercial transaction; • the PPI is sometimes a good predictor of future inflation (since producers often pass their cost increases on to consumers).
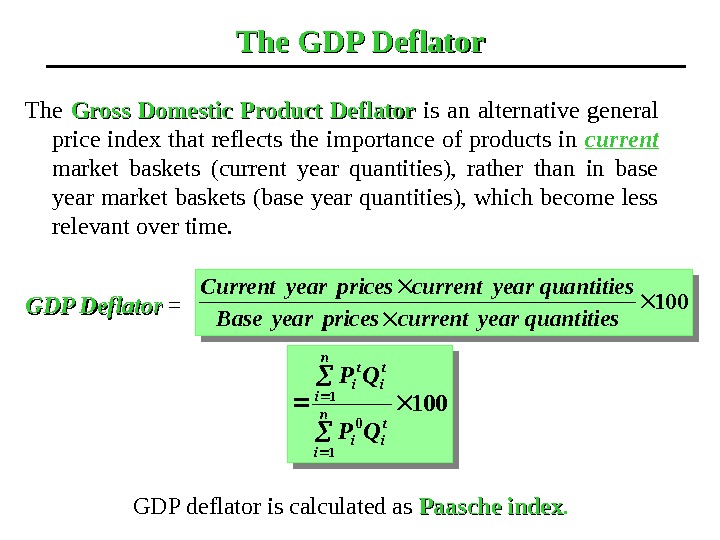
The GDP Deflator The Gross Domestic Product Deflator is an alternative general price index that reflects the importance of products in current market baskets (current year quantities), rather than in base year market baskets (base year quantities), which become less relevant over time. GDP Deflator = 100 quantitiesyearcurrentpricesyear. Base quantitiesyearcurrentpricesyear. Current 100 1 01 n i t iin i t it i QP QP GDP deflator is calculated as Paasche index.
In order to convert any year’s nominal GDP (or any other nominal figure) into real GDP (or any other corresponding real figure), one must use the formula Real GDP = yearsamethefor)deflator. GDPor(CPI GDPalmin. No. From Nominal GDP to Real GDP
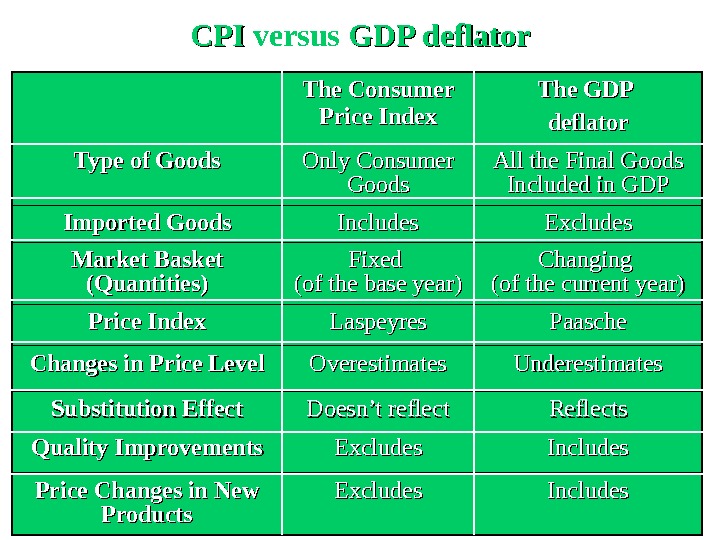
CPICPI versus GDP deflator The Consumer Price Index The GDP deflator Type of Goods Only Consumer Goods All the Final Goods Included in GDP Imported Goods Includes Excludes Market Basket (Quantities) Fixed (of the base year) Changing (of the current year) Price Index Laspeyres Paasche Changes in Price Level Overestimates Underestimates Substitution Effect Doesn’t reflect Reflects Quality Improvements Excludes Includes Price Changes in New Products Excludes Includes
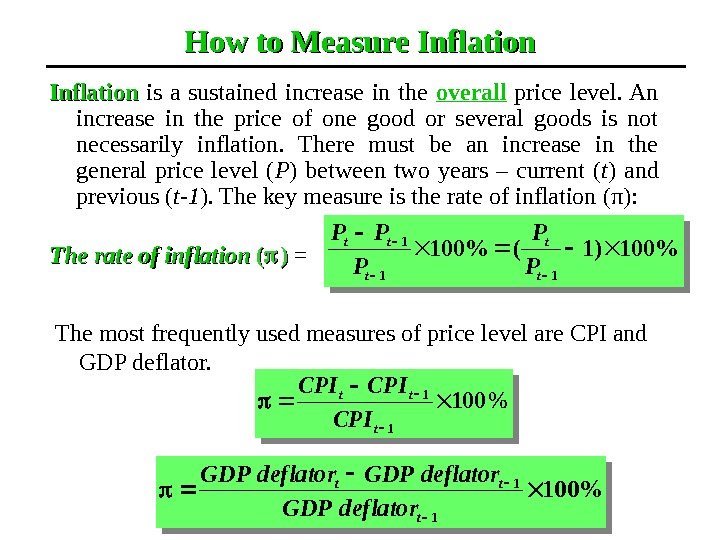
How to Measure Inflation is a sustained increase in the overall price level. An increase in the price of one good or several goods is not necessarily inflation. There must be an increase in the general price level ( P ) between two years – current ( t ) and previous ( t-1 ). The key measure is the rate of inflation (π): The rate of inflation (( )) = %100 1 1 t tt CPI CPICPI %100 1 1 t tt deflator. GDPdeflator. GDPThe most frequently used measures of price level are CPI and GDP deflator. %100)1(%100 11 1 t t t tt P P P PP
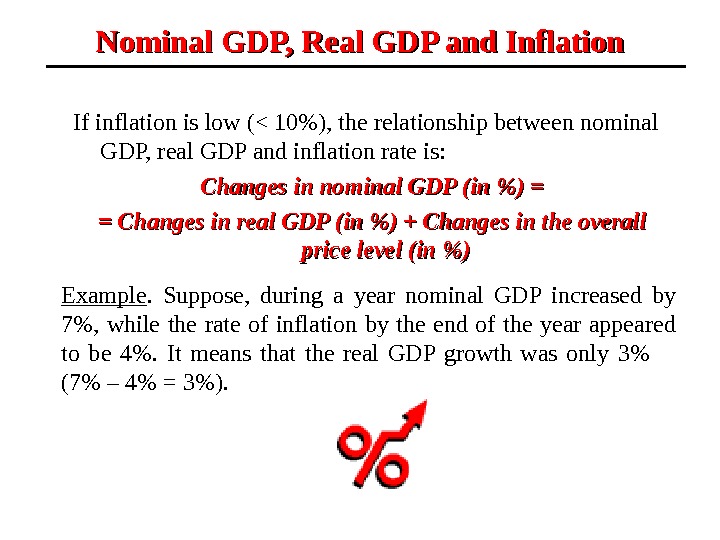
If inflation is low (< 10%), the relationship between nominal GDP, real GDP and inflation rate is: Changes in nominal GDP (in %) = = Changes in real GDP (in %) + Changes in the overall price level (in %)Nominal GDP, Real GDP and Inflation Example. Suppose, during a year nominal GDP increased by 7%, while the rate of inflation by the end of the year appeared to be 4%. It means that the real GDP growth was only 3% (7% – 4% = 3%).
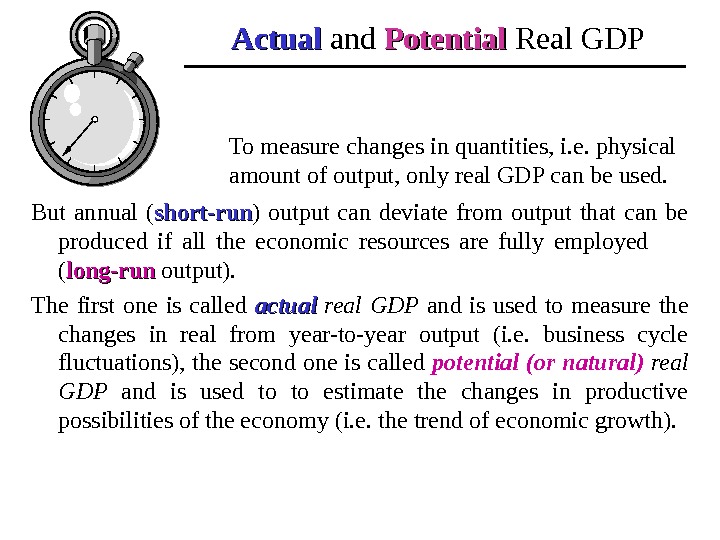
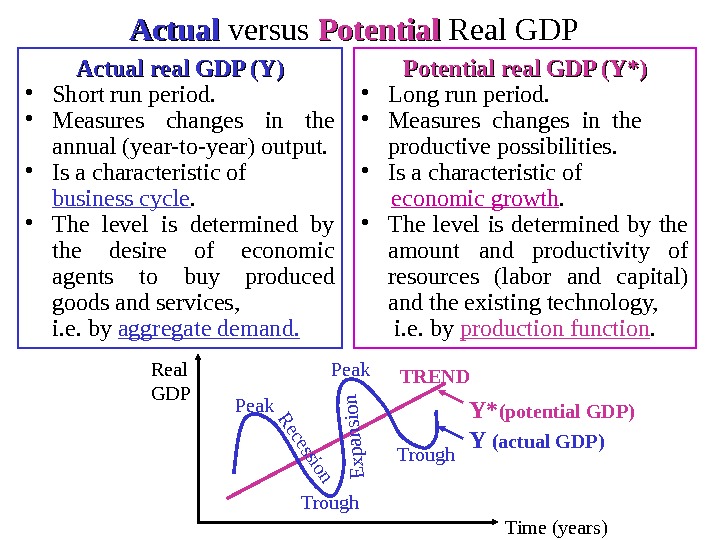
Actual and Potential Real GDP But annual ( short-run ) output can deviate from output that can be produced if all the economic resources are fully employed ( long-run output). The first one is called actual real GDP and is used to measure the changes in real from year-to-year output (i. e. business cycle fluctuations), the second one is called potential (or natural) real GDP and is used to to estimate the changes in productive possibilities of the economy (i. e. the trend of economic growth). To measure changes in quantities, i. e. physical amount of output, only real GDP can be used.
Actual versus Potential Real GDP Actual real GDP (Y) • Short run period. • Measures changes in the annual (year-to-year) output. • Is a characteristic of business cycle. • The level is determined by the desire of economic agents to buy produced goods and services, i. e. by aggregate demand. Potential real GDP (Y*) • Long run period. • Measures changes in the productive possibilities. • Is a characteristic of economic growth. • The level is determined by the amount and productivity of resources (labor and capital) and the existing technology, i. e. by production function. Real GDP TREND Y (actual GDP)Y* (potential GDP)Peak Trough. R ecession. E xp ansion Time (years)
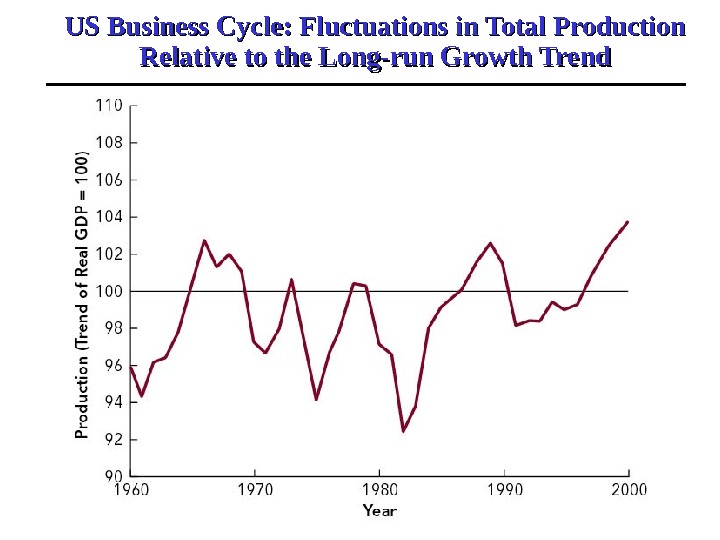
US Business Cycle: Fluctuations in Total Production Relative to the Long-run Growth Trend
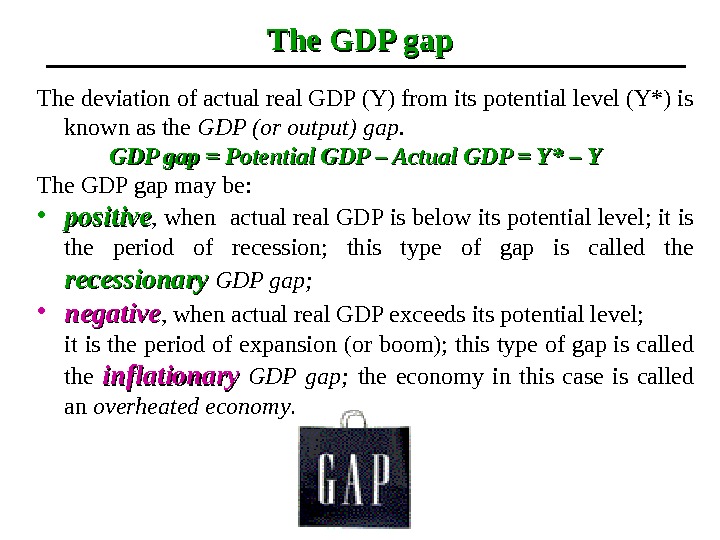
The GDP gap The deviation of actual real GDP (Y) from its potential level (Y*) is known as the GDP (or output) gap. GDP gap = Potential GDP – Actual GDP = Y* – Y The GDP gap may be: • positive , when actual real GDP is below its potential level; it is the period of recession; this type of gap is called the recessionary GDP gap; • negative , when actual real GDP exceeds its potential level; it is the period of expansion (or boom); this type of gap is called the inflationary GDP gap; the economy in this case is called an overheated economy.
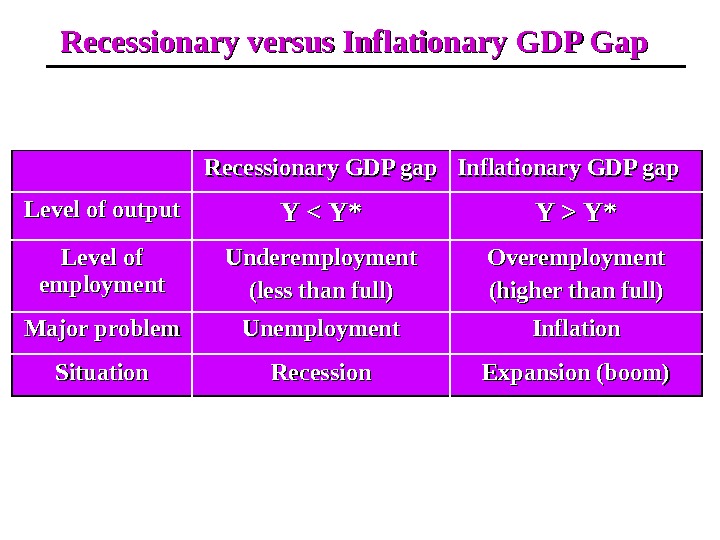
Recessionary versus Inflationary GDP Gap Recessionary GDP gap Inflationary GDP gap Level of output Y Y* Level of employment Underemployment (less than full) Overemployment (higher than full) Major problem Unemployment Inflation Situation Recession Expansion (boom)
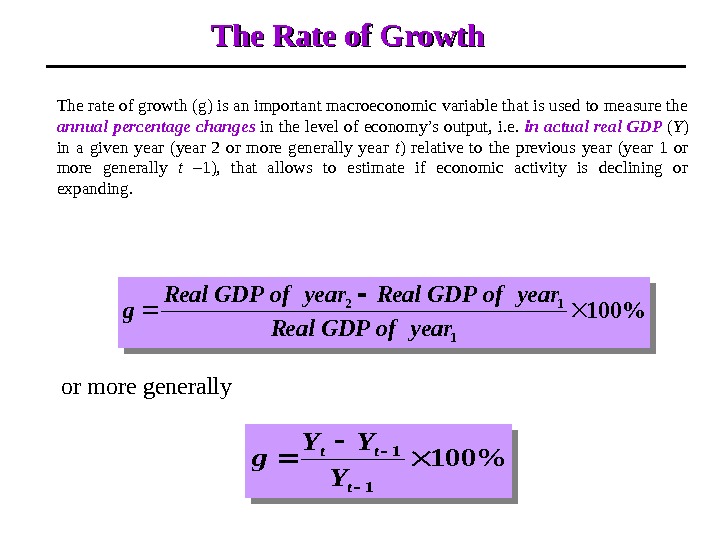
The Rate of Growth The rate of growth (g) is an important macroeconomic variable that is used to measure the annual percentage changes in the level of economy’s output, i. e. in actual real GDP ( Y ) in a given year (year 2 or more generally year t ) relative to the previous year (year 1 or more generally t – 1), that allows to estimate if economic activity is declining or expanding. %100 1 12 yearof. GDPeal. Ryearof. GDPeal. R g %100 1 1 t tt Y YY g or more generally
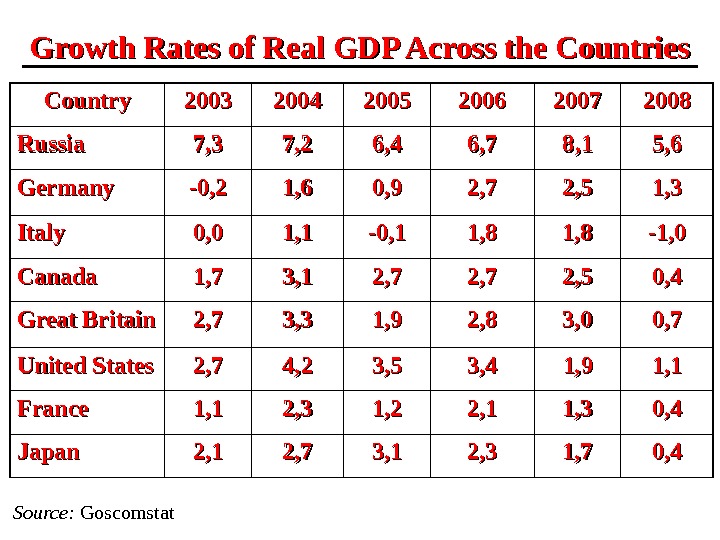
Growth Rates of Real GDP Across the Countries Source : Goscomstat. Country 2003 2004 2005 2006 2007 2008 Russia 7, 3 7, 2 6, 4 6, 7 88 , , 11 55 , 6, 6 Germany -0, 2 1, 6 0, 9 2, 7 2, 5 1, 3 Italy 0, 0 1, 1 -0, 1 1, 81, 8 -1, 0 Canada 1, 7 3, 1 2, 72, 7 2, 5 0, 4 Great Britain 2, 7 3, 3 1, 9 2, 8 3, 0 0, 7 United States 2, 7 4, 2 3, 5 3, 4 1, 9 1, 1 France 1, 1 2, 3 1, 2 2, 1 1, 3 0, 4 Japan 2, 1 2, 7 3, 1 2, 3 1, 7 0,
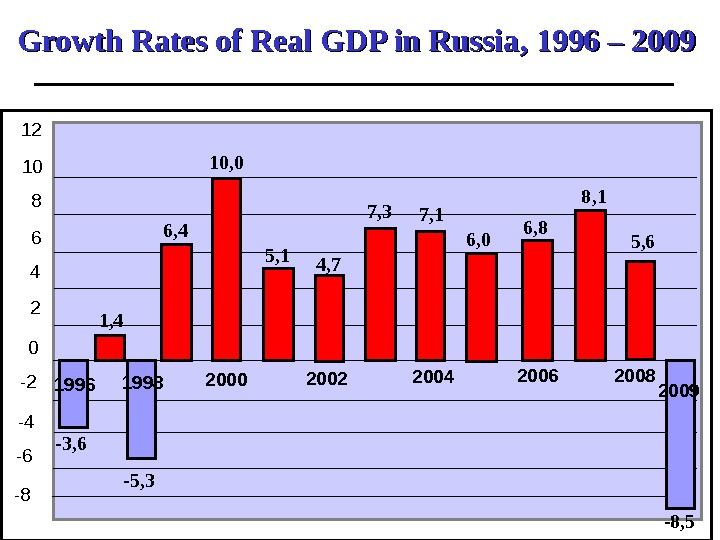
Growth Rates of Real GDP in Russia , 1996 – 200 99 -8 -6 -4 -2 0 24 681012 -3, 6 -5, 3 2000 2002 20041, 4 4, 7 7, 3 7, 1 5, 110, 0 6, 4 6, 0 2006 6, 8 20088 , 1 1998 5, 6 1996 2009 — 8 ,
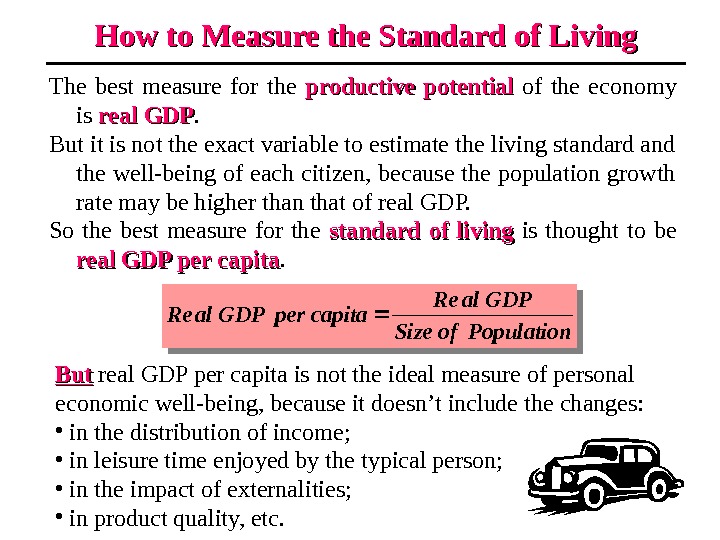
How to Measure the Standard of Living The best measure for the productive potential of the economy is real GDP. But it is not the exact variable to estimate the living standard and the well-being of each citizen, because the population growth rate may be higher than that of real GDP. So the best measure for the standard of living is thought to be real GDP per capita. Populationof. Size GDPal. Re capitaper. GDPal. Re But real GDP per capita is not the ideal measure of personal economic well-being, because it doesn’t include the changes: • in the distribution of income; • in leisure time enjoyed by the typical person; • in the impact of externalities; • in product quality, etc.
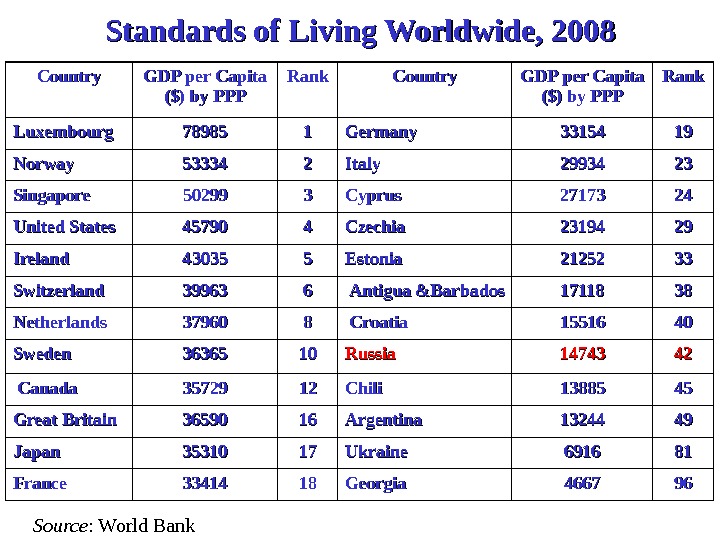
Standards of Living Worldwide, 200 88 Country GDP per Capita ($) by PPP($) by PPP Rank Luxembourg 78985 11 Germany 3333 154154 1919 Norway 53334 22 Italy 29934 22 33 Singapore 55 0299 33 Cyprus 27173 2424 United States 44 5790 44 Czechia 23194 2929 Ireland 44 3035 55 Estonia 21252 3333 Switzerland 39963 66 Antigua &Barbados 17118 3838 Netherlands 37960 88 Croatia 11 5516 4040 Sweden 36365 1010 Russia 1414 743743 44 22 Canada 35729 11 22 Chili 11 3885 4545 Great Britain 36590 1616 Argentina 13244 4949 Japan 35310 1717 Ukraine 66 916916 88 11 France 33414 11 88 Georgia 4667 9696 Source : World Bank