ed4b0526a61565c1f337c1ce98c32d71.ppt
- Количество слайдов: 39


Lebanon and Laclede County Retail Sales Analysis http: //www. cpac. missouri. edu/lebanon/ Anna Kovalyova Program Coordinator Lucy Zakharova Research Assistant University of Missouri, Columbia

Importance of Retail Sales Analysis Shift from dependence on property to sales taxes In an evolving world, counties are under pressure to satisfy demand for public goods and services Increasing sales tax avoidance in the form of catalog and internet sales contributed to decline of the total taxable retail sales in Laclede County

Retail Sales Merchandise sold for cash or credit at retail and wholesale by establishments primarily engaged in retail trade Amounts received from customers for layaway purchases Receipts from rental or leasing of vehicles, equipment, instruments, tools, etc. Receipts for delivery, installation, maintenance, repair, alteration, storage, and other services The total value of service contracts Gasoline, liquor, tobacco, and other excise taxes which are paid by the manufacturer or wholesaler and passed on to the retailer

Trade Area Analysis Trade Area Capture Purpose: To estimate the number of customers drawn to a particular community or county to purchase a product or service at any given time

Trade Area Capture Calculation

What Does Trade Area Analysis Tell Us? Trade Area Capture If Trade Area Capture is Larger than Population: The community is attracting consumers from outside its boundaries, or Local residents are spending more for the selected commercial item than the state average If Trade are Capture is Less than Population: The community is not capturing the commercial purchases of its own residents, or Local Residents are spending relatively less for the commercial item than the state average

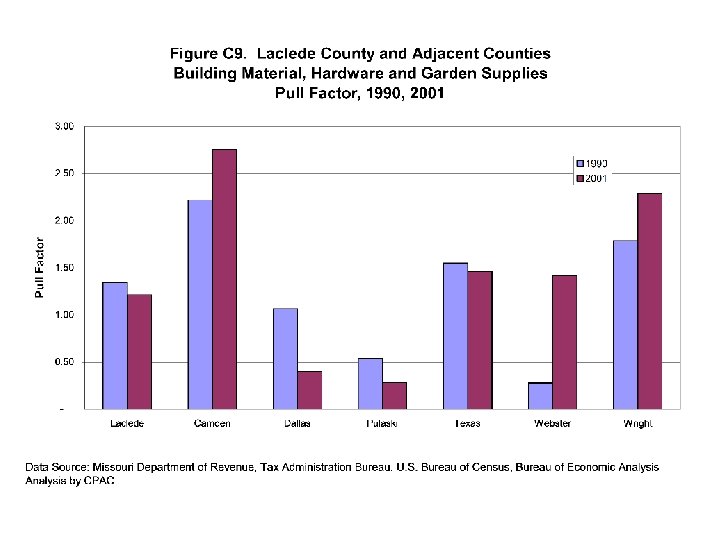
Trade Area Analysis Pull Factor Purpose: To estimate the portion of customers a community draws from outside its borders Calculation: Pull Factor = Trade Area Capture estimate County population

What Does Trade Area Analysis Tell Us? Pull Factor If Pull Factor is Greater than 1. 0: The community is attracting consumers from outside its boundaries, or Local residents are spending more for the selected commercial item than the state average If Pull Factor is Less than 1. 0: of The community is not capturing the commercial purchases its own residents, or Local Residents are spending relatively less for the commercial item than the state average

Potential Sales Purpose: To estimate possible retail sales that could be achieved if each retail subsector captured 100 percent of the local market Calculation: Potential Sales = Actual Retail Sales of merchandise j in county l Pull Factor for this type of merchandise in county l

Potential Sales If Potential Sales fall behind the actual sales: There is a surplus in this subsector and the subsector is considered an exporter. If Potential Sales exceed the actual sales: There is a leakage in this subsector and the subsector is considered an importer. In this case, the subsector is losing money because people are going outside of the locality to purchase some of the goods and services provided by the subsector.

Example For Laclede County The data are from 1990 with fiscal data adjusted for inflation (2001 dollars). This example is for the Total Retail Sales and Food category. Data for Laclede County Population Per Capita Income Total Retail Sales Food Stores’ Sales 27, 228 $17, 167 $236, 549, 645 $40, 453, 349 Data for Missouri Population Per Capita Income Total Retail Sales Food Stores' Sales State Per Capita Food Sales State Per Capita Total Sales 5, 128, 880 $24, 042 $54, 293, 947, 976 $7, 875, 626, 391 $1, 536 $10, 586
 calculation: County TAC = for Total")
Example For Laclede County Trade Area Capture (TAC) calculation: County TAC = for Total Retail Sales TAC = 31, 295 (persons) TAC for Food Subsector = 36, 884 (persons)
 calculation County PF for Total Retail Sales")
Example For Laclede County Pull Factor (PF) calculation County PF for Total Retail Sales = 1. 15 PF for Food Subsector = 1. 36
 calculation: County PS for Total Retail Sales")
Example For Laclede County Potential Sales (PS) calculation: County PS for Total Retail Sales = $205, 695, 343. 48 (actual $236, 549, 645) PS for Food Subsector = $29, 745, 109. 55 (actual $40, 453, 349)

Economic Impact of Retail Trade In 2000, about 3, 700 people were employed in retail businesses in Laclede County. The combined retail categories make up about 19 percent of the total county employment. Income from the retail categories totaled more than $66. 2 million, excluding proprietor's income, which is 10 percent of the wage, salary and other labor earnings of Laclede County residents.

Table 1. Source: Minnesota IMPLAN Group U. S. Bureau of the Census, Bureau of Economic Analysis, REIS; MO Works! http: //mo. works. state. mo. us; and U. S. Department of Labor, Bureau of Labor Statistics, http: //stats. bls. gov/data/home. htm Analysis by CPAC

Table 2. Source: Minnesota IMPLAN Group U. S. Bureau of the Census, Bureau of Economic Analysis, REIS; U. S. Department of Labor, Bureau of Labor Statistics, http: //stats. bls. gov/data/home. htm Analysis by CPAC

Shift-Share Analysis Aggregate State Effect: the expected growth of a retail sector i in a county j given the overall average state retail sales growth. Category/Sector Effect: county's growth due to the differences in the business structure of a county and that of a state. Competitive Effect: differences between the rates of growth for a county and those for a state in individual retail sectors.
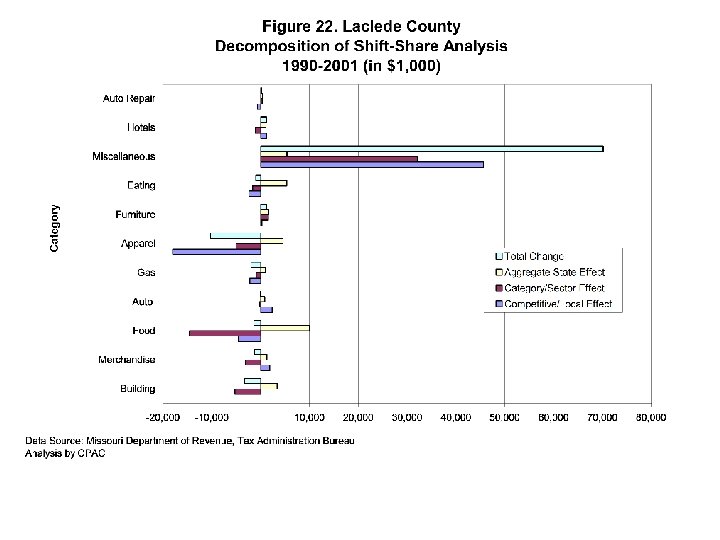

Table 3 Data Source: Missouri Department of Revenue, Tax Administration Bureau Analysis by CPAC
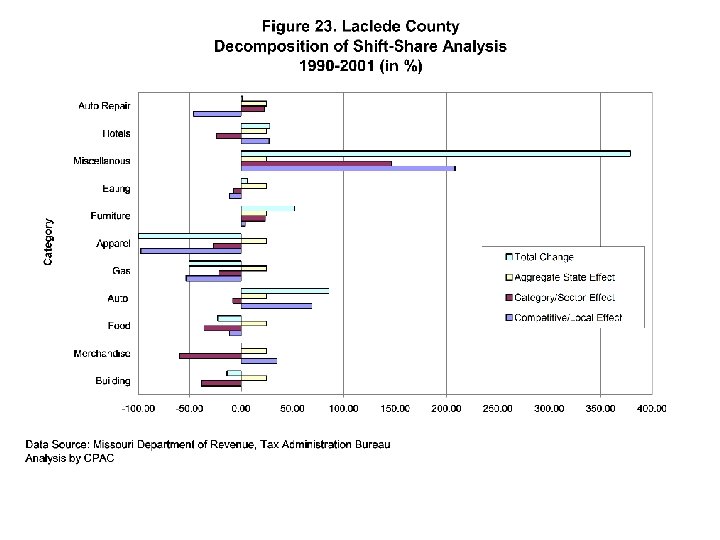

Table 4 Data Source: Missouri Department of Revenue, Tax Administration Bureau Analysis by CPAC

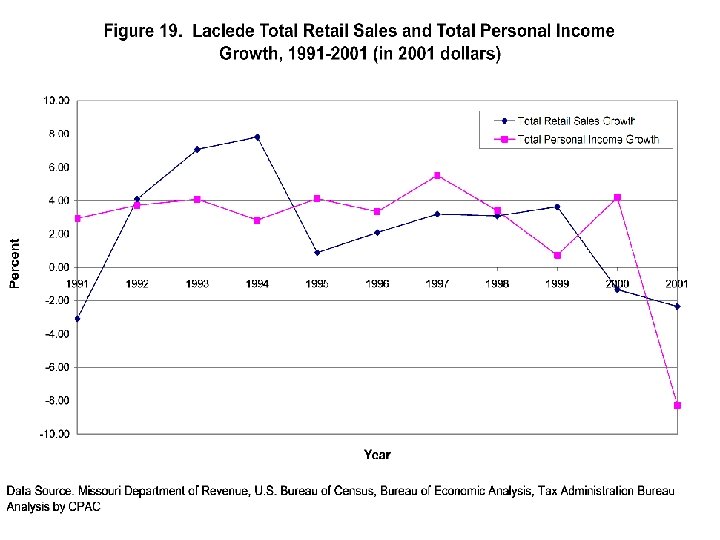
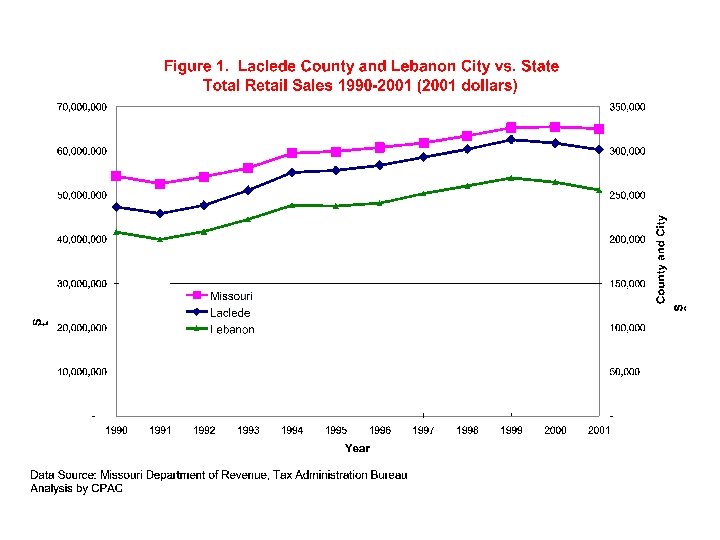
Key Findings After adjusting for inflation, Laclede County’s retail sales increased from $237 million in 1990 to $302 million in 2001 -- a growth of 27. 48 percent. This is compared to a growth of 19. 83 percent in retail sales for the state over the same time period. County retail sales have declined in real terms between 1999 and 2001 -- from $313 million to $302 million (2001 dollars). The number of retail firms in Laclede County increased from 800 in 1990 to 900 in 2000.

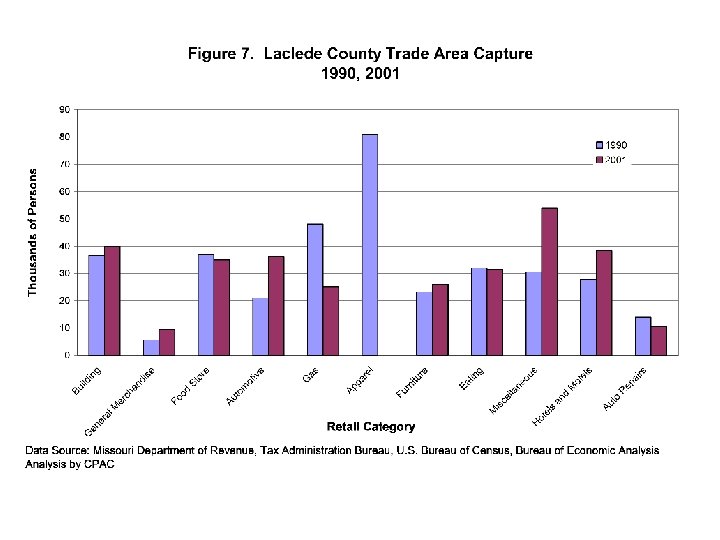
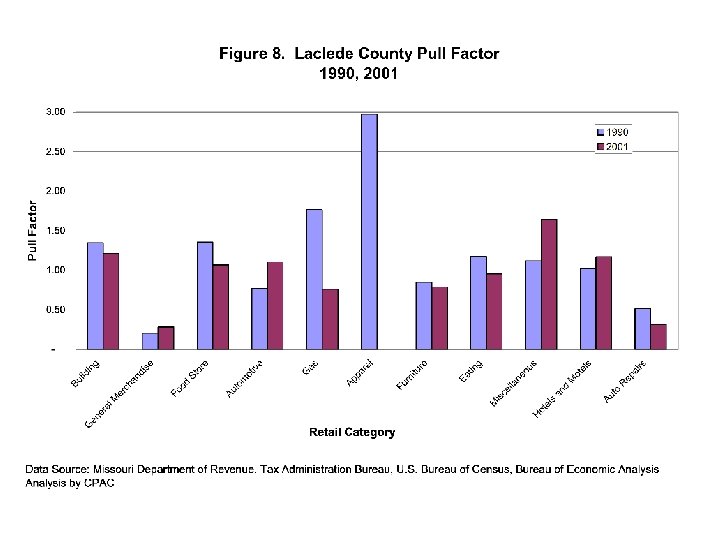
Key Findings Laclede County’s pull factor decreased from 1. 15 in 1990 to 1. 09 in 2001. The county is drawing customers from outside its borders or its residents are spending more on retail sales than the state average Miscellaneous Retail appears to be the fastest growing category with respect to maintaining or capturing customers within its trade area. Several retail categories show promise for expansion in Laclede County. These include Miscellaneous Retail, Hotels and Motels, and Automotive.

Key Findings In 2000, over 3, 700 people were employed in retail businesses in Laclede County – 19 percent of total county employment. Payroll from the retail sectors totaled more than $66, 232, 000 -- 10 percent of the wage, salary and other labor earnings of Laclede County residents.

Data Sources Retail Sales: Missouri Department of Revenue, Tax Administration Bureau, Gross Taxable Sales Data, 1990 -2001 Population: Population Estimates Program, U. S. Bureau of Census, Population Division, Release Date: April 2002 Income: Bureau of Economic Analysis, Regional Economic Information System; U. S. Bureau of Census, IMPLAN Employment by workplace: U. S. Bureau of Census; Bureau of Economic Analysis, Regional Economic Information System
ed4b0526a61565c1f337c1ce98c32d71.ppt