

71eafe7f70de178ac52a963b8bd24fd0.ppt
- Количество слайдов: 14
 LEAST DEVELOPED COUNTRIES, LANDLOCKED DEVELOPING COUNTRIES AND SMALL STATES IN THE GLOBAL ECONOMIC SYSTEM T. N. Srinivasan Samuel C. Park Jr. Professor of Economics Yale University, New Haven, CT USA Prepared for the Conference on Global Partnership for Development organised by CUTS and FICCI in association with the Department of Commerce, Government of India, the Commonwealth Secretariat and the India Office of the World Bank New Delhi, India -- August 12 -13, 2008
 1. 2. 3. 4. 5. 6. Introduction Trade, Growth and Poverty Reduction Salient Characteristics of Least Developed Countries Cooperation Between the Developed and Developing Countries Doha Round of Multilateral Trade Negotiations Making Global Partnership for Development More Effective: Some Recommendations
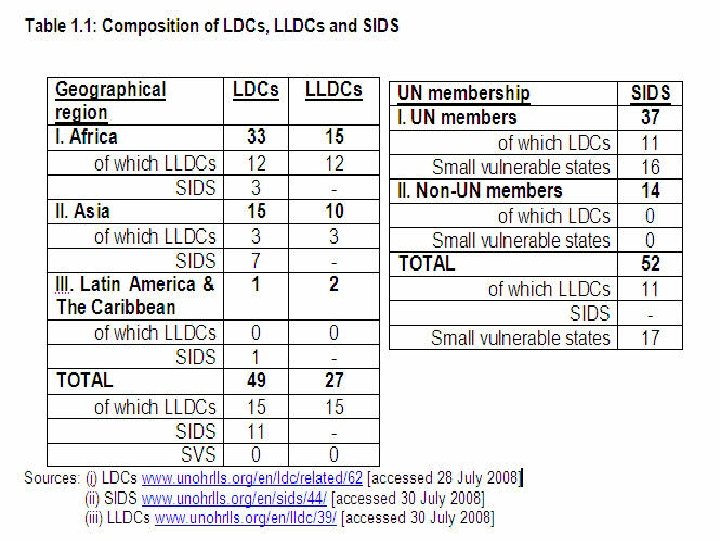
 1. INTRODUCTION • • Wide recognition of the Development Challenge in Least. Developed Countries (LDCs), Small Island States (SIDs), and Small Vulnerable States (SVS) Establishment of the UNORHLLS by the UN General Assembly in 2001 Enormous diversity among countries in each group (Tables 1. 1– 1. 5) International Meetings and Declarations Recognition of the needs of LDCs and Small Economies in the Doha Declaration Consensus on the broad objective of assisting them in achieving greater and more effective participation in the global economic system, particularly of trade in goods, services, finance and technology Consensus on the goal does not necessarily imply either a consensus on the constraints on reaching the goal or on the means for easing the constraints
 2. TRADE, GROWTH AND POVERTY REDUCTION • • • Increasing integration of developing countries in the global economic system through the process of globalization Waves of globalization Direct and Indirect Effects of Globalization on poverty reduction Linkages in economic theory: • Globalization and Growth • Growth and Poverty • Growth and Inequality • Other Links – Factor markets, prices, insurance • Domestic and foreign distortions Globalization and Poverty Reduction – Empirical Evidence Cross-countries studies • Country case studies • Institutions • • Globalization for the poor
 3. SALIENT CHARACTERISTICS OF LEAST-DEVELOPED COUNTRIES Criteria for grouping • Implications of the criteria • Theory of comparative advantage and small and vulnerable states •
 4. COOPERATION BETWEEN DEVELOPED AND DEVELOPING COUNTRIES TO STRENGTHEN THE LINKS BETWEEN TRADE, GROWTH AND POVERTY REDUCTION • • • Temporal and spatial heterogeneity of the links and their strength Growing doubts on the benefits of globalization in developed countries Historical ambivalence of developing countries towards trade openness and multilateral trade agreements Developing countries in the WTO Accelerating and sustaining growth in LDCs and small economies The voice of LDCs in international organizations and negotiations
 5. PROGRAMMES OF ACTION FOR THE LDCs Integrated framework • Programmes of Action of UNCTAD • Aid-for-Trade •
 6. DOHA ROUND A Development Round? • Collapse of the informal meeting of the WTO Ministerial, July 28, 2008 • Is there a way forward? •
 7. MAKING GLOBAL PARTNERSHIP FOR DEVELOPMENT MORE EFFECTIVE: SOME RECOMMENDATIONS • • • Is there, and can there possibly be, a global partnership for development? A realistic approach focused on specific issues and a coalition of interested parties on the issues Reforms: • A smaller World Bank catering only to needs of developing countries not having access to world capital flows • An IMF with a focus only on global financial systems stability and coordinating macroeconomic policies • Reform of the governance of both the Bank and the Fund • Reform of the WTO: • Capacity Building • Dispute Settlement • Role-Making • Keeping non-trade-related issues out • Resisting Preferential Trade Agreement • Fairness of the Global Trading System
 GNI Per Capita (2006) PPP") Table 1. 2: Least-Developed Countries Population (2006, in millions) GNI Per Capita (2006) PPP GNI per capita (2006) Growth GDP per capita (2005 -06) Trade: Merchandise (2006, as % of GDP) Trade: Services (2006, as % of GDP) FDI: Net Inflow (2006, as % of GDP) FDI: Net Outflow (2006, as % of GDP) Min Max Min Max Country Kirbati Bangladesh Burundi Equatorial Guinea Liberia Equatorial Guinea Maldives Central African Republic Lesotho Bangladesh Gambia Liberia Equatorial Guinea-Bissau Angola Value 0. 1 156 100 8, 510 260 16, 620 -7. 8 21. 5 24. 1 144. 5 5. 9 36. 4 -13 19. 3 -2. 8 0. 4
Table 1. 2: Least-Developed Countries Population (2006, in millions) GNI Per Capita (2006) PPP GNI per capita (2006) Growth GDP per capita (2005 -06) Trade: Merchandise (2006, as % of GDP) Trade: Services (2006, as % of GDP) FDI: Net Inflow (2006, as % of GDP) FDI: Net Outflow (2006, as % of GDP) Min Max Min Max Country Kirbati Bangladesh Burundi Equatorial Guinea Liberia Equatorial Guinea Maldives Central African Republic Lesotho Bangladesh Gambia Liberia Equatorial Guinea-Bissau Angola Value 0. 1 156 100 8, 510 260 16, 620 -7. 8 21. 5 24. 1 144. 5 5. 9 36. 4 -13 19. 3 -2. 8 0. 4
 GNI Per Capita (2006)") Table 1. 3: Small Vulnerable Economies Population (2006, in millions) GNI Per Capita (2006) PPP GNI per capita (2006) Growth GDP per capita (2005 -06) Trade: Merchandise (2006, as % of GDP) Trade: Services (2006, as % of GDP) FDI: Net Inflow (2006, as % of GDP) FDI: Net Outflow (2006, as % of GDP) Min Max Min Max Country St. Kitts & Nevis Guatemala Solomon Islands Trinidad & Tobago Papua New Guinea Trinidad & Tobago Grenada Trinidad & Tobago Guatemala Guyana Guatemala Mauritius Papua New Guinea St. Kitts & Nevis Trinidad & Tobago Jamaica Value 0. 048 13 690 12, 500 1, 630 16, 800 -0. 8 11. 6 50. 8 166 8. 7 47. 2 0. 6 42. 3 -2. 3 0. 9
Table 1. 3: Small Vulnerable Economies Population (2006, in millions) GNI Per Capita (2006) PPP GNI per capita (2006) Growth GDP per capita (2005 -06) Trade: Merchandise (2006, as % of GDP) Trade: Services (2006, as % of GDP) FDI: Net Inflow (2006, as % of GDP) FDI: Net Outflow (2006, as % of GDP) Min Max Min Max Country St. Kitts & Nevis Guatemala Solomon Islands Trinidad & Tobago Papua New Guinea Trinidad & Tobago Grenada Trinidad & Tobago Guatemala Guyana Guatemala Mauritius Papua New Guinea St. Kitts & Nevis Trinidad & Tobago Jamaica Value 0. 048 13 690 12, 500 1, 630 16, 800 -0. 8 11. 6 50. 8 166 8. 7 47. 2 0. 6 42. 3 -2. 3 0. 9
 GNI Per Capita (2006) PPP") 1. 4: Landlocked Developing Countries Population (2006, in millions) GNI Per Capita (2006) PPP GNI per capita (2006) Growth GDP per capita (2005 -06) Trade: Merchandise (2006, as % of GDP) Trade: Services (2006, as % of GDP) FDI: Net Inflow (2006, as % of GDP) FDI: Net Outflow (2006, as % of GDP) Min Max Min Max Country Montenegro Ethiopia Burundi Botswana Zimbabwe Azerbaijian Central African Republic Swaziland Zambia Mongolia Azerbaijian Serbia Rwanda Azerbaijian Value 0. 601 77 100 5, 570 11, 730 -6 33 24. 1 160. 9 8. 3 32. 2 -2. 9 16 -0. 6 3. 6
1. 4: Landlocked Developing Countries Population (2006, in millions) GNI Per Capita (2006) PPP GNI per capita (2006) Growth GDP per capita (2005 -06) Trade: Merchandise (2006, as % of GDP) Trade: Services (2006, as % of GDP) FDI: Net Inflow (2006, as % of GDP) FDI: Net Outflow (2006, as % of GDP) Min Max Min Max Country Montenegro Ethiopia Burundi Botswana Zimbabwe Azerbaijian Central African Republic Swaziland Zambia Mongolia Azerbaijian Serbia Rwanda Azerbaijian Value 0. 601 77 100 5, 570 11, 730 -6 33 24. 1 160. 9 8. 3 32. 2 -2. 9 16 -0. 6 3. 6
 Min Country Palau") Table 1. 5: Small Island Developing States Population (2006, in millions) Min Country Palau Max Cuba 11 GNI Per Capita (2006) Min Guinea-Bissau 190 Max Singapore 28, 730 PPP GNI per capita (2006) Min Guinea-Bissau 460 Max Singapore 43, 300 Growth GDP per capita (2005 -06) Min Max Timor-Leste Maldives Haiti Singapore -6. 7 21. 5 44. 5 386. 2 Min Trinidad & Tobago Singapore Tonga St. Kitts & Nevis Guinea-Bissau Singapore 9. 5 Trade: Merchandise (2006, as % of GDP) Trade: Services (2006, as % of GDP) FDI: Net Inflow (2006, as % of GDP) FDI: Net Outflow (2006, as % of GDP) Max Min Max Value 0. 02 91. 6 -0. 91 42. 3 -2. 8 6. 5 Back
Table 1. 5: Small Island Developing States Population (2006, in millions) Min Country Palau Max Cuba 11 GNI Per Capita (2006) Min Guinea-Bissau 190 Max Singapore 28, 730 PPP GNI per capita (2006) Min Guinea-Bissau 460 Max Singapore 43, 300 Growth GDP per capita (2005 -06) Min Max Timor-Leste Maldives Haiti Singapore -6. 7 21. 5 44. 5 386. 2 Min Trinidad & Tobago Singapore Tonga St. Kitts & Nevis Guinea-Bissau Singapore 9. 5 Trade: Merchandise (2006, as % of GDP) Trade: Services (2006, as % of GDP) FDI: Net Inflow (2006, as % of GDP) FDI: Net Outflow (2006, as % of GDP) Max Min Max Value 0. 02 91. 6 -0. 91 42. 3 -2. 8 6. 5 Back