88a4498868947d343b7b001ad83801ab.ppt
- Количество слайдов: 58


Lead Poisoning in Children What’s new about an old problem? Kanta Bhambhani, MD Division of Pediatric Hematology/Oncology Director, Lead Clinic Carman and Ann Adams Department of Pediatrics Children’s Hospital of Michigan, Wayne State University School of Medicine, Detroit, MI April, 2016
 in children in")
Lead Poisoning in Children § Reduction of blood lead levels (BLLs) in children in the USA over past 4 decades- a great public health success § Groups of children at higher risk for lead exposure § Pediatricians and health care personnel need tools to identify such high-risk children -provide primary prevention and lead testing -respond appropriately to lead testing results
 of children aged 1 -5 years--National Health and Nutrition Examination")
Blood Lead Levels (BLLs) of children aged 1 -5 years--National Health and Nutrition Examination Survey (NHANES), USA. Population-based survey to assess health and nutritional status of adults and children and determine prevalence of major diseases and risk factors for diseases Year % with BLL > 10 µg/d. L Geometric mean BLL ( µg/d. L) 1976 -1980 88. 2 15. 0 1991 -1994 4. 4 2. 7 1999 -2002 1. 6 1. 9 Year 2007 -2008, 2009 -2010 % with BLL > 5 µg/d. L (97. 5 th percentile) 2. 5 1. 3
: 513 -516, 2005 § Mean blood lead level")
NHANES III Update-Phase 3 MMWR 54(20): 513 -516, 2005 § Mean blood lead level for Americans aged 1 -74 yr. continued to decline 12. 8 g/d. L in 1976 -1980 to 2. 9 g/d. L in 1988 -1991 to 2. 3 g/d. L in 1991 -1994 to 1. 6 g/d. L in 1999 -2002 § For children aged 1 -5, lead poisoning rates declined similarly About 1. 6 % of children (310, 000) had blood lead levels > CDC threshold of 10 g/d. L (CDC threshold now revised to 5 µg/d. L with an estimated 535, 000 or 2. 6% children above this level) Down from 4. 4% (900, 000) in 1991 -1994

Trend of Blood Lead Level in Children Ages 1 -5 yr. , 1976 -2002

Epidemiology of Lead Poisoning § NHANES III data has identified characteristics of groups at increased risk of EBL levels Preschool age Lower socioeconomic status Urban residence African-American race § Other groups recently identified Recent immigrants International adoptees Children with Autism or with pervasive developmental disorders

NHANES III Update-Phase 3 Key Findings § Overall, 2. 6% of children (approx. 535, 000) aged 1 -5 yr. are considered lead-poisoned § Rates are highest for non-Hispanic black children aged 1 -5 (3. 1%) § For children aged 1 -5, African-American race/ethnicity, low income, and living in pre 1946 housing were associated with elevated BLLs

NHANES Update-Phase 3 Race § Lead poisoning rates are higher among African. American (8. 7%) than Mexican-American (5. 6%) children and non -Hispanic white children(2. 3%) § Above indicates differences in risk for exposure still persist.
; 513")
Prevalence of lead poisoning by race/ethnicity Survey Period *95% confidence interval MMWR 54(20); 513 -516, 2005
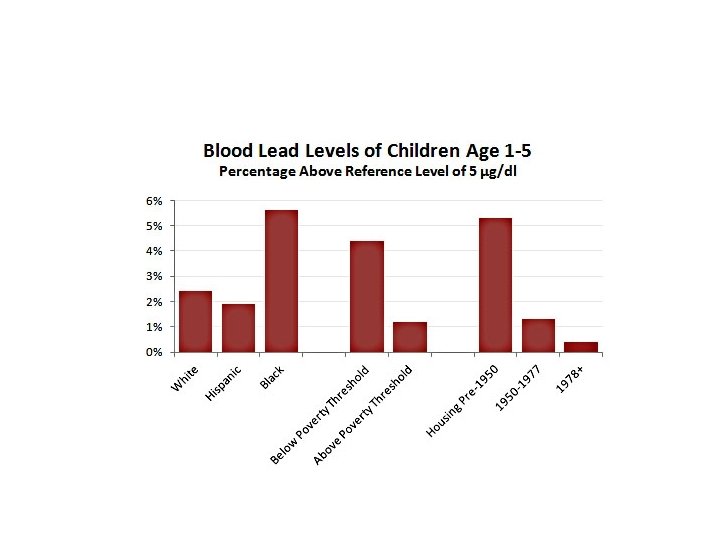

Sources of Lead Poisoning in Children § Leaded Paint in Old Housing Federal regulations limited use of lead in household paint to <0. 06% by weight- promulgated late 1970 s Pigment industry began decreasing lead in paint in 1950 s Prior to the 1950 s, lead comprised up to 50% of the wt of paint -a 1 g paint chip (size of a fingernail ) could contain 500 mg of lead ( For comparison, an average child can spontaneously excrete only up to 100 g per day )

Sources of Lead Poisoning in Children § Lead in Household Paint that is peeling and flaking, thus becoming accessible for ingestion, poses an active risk for children ( especially preschool children who traditionally have increased hand-mouth activity ) Leaded paint on an intact surface is a potential risk for the future Leaded paint may be in the Primary residence A baby-sitter’s residence Day-care center § Lead dust from deteriorating paint § Renovations causing lead-laden dust

Household Lead Paint –at risk child!

Other Significant Sources of Lead Exposure u. Adults exposed to lead at work might bring home leaded dust on their clothes u. Lead in pigments used by artists, potters, and glaziers (released from crockery, decanters into food) u. Soil and surface contamination that occurred during decades of leaded gasoline usage continues to contribute to background exposure u. Lead in home-folk remedies (azarcon, greta, pay-looah, ayurvedic medicine) u. Lead in food additives (lozeena) , ethnic spices u. Lead in ethnic cosmetics (kohl, surma, sindoor) u. More recently, lead in imported toys, candy from Mexico

Water as a Source of Lead Poisoning § Most municipal water supplies are relatively lead -free § Lead may be leached out as water flows through lead pipes or lead-soldered pipes, especially if acidic § Highest concentrations of lead in tap water are found in water standing in pipes overnight § Hot water has higher conc. of leached lead § Allowing water to flow for a few seconds to a minute lowers the lead conc. to acceptable levels ( <15 ppb or 15 ng of lead per g of water ) § Hot water should not be used for cooking or drinking purposes or for preparation of formula § First draw not to be used for preparation of formula

Water as a Source of Lead Poisoning § A growing source of childhood lead exposure because of aging infrastructure § Evident from ‘Flint Drinking Water Crisis’ § Incidence of elevated BLL increased from 2. 4% to 4. 9% in children younger than 5 years residing in Flint after water source change in April 2014 § Disadvantaged neighborhoods having the greatest elevated BLLs Hanna-Attisha, La. Chance, Sadler, Schnepp: AJPH 2015

Hazard of Lead in Infant Formula Lead in drinking water- hazardous practices in preparing formula § Use of water first-drawn in the morning “First-draw” water has the highest lead conc. § Excessive boiling of water § Inadvertent use of lead-based kettles for boiling Shannon, Graef. Pediatrics 1992

Lead Absorption and Distribution § Lead crosses the placenta freely- accumulation in the fetus results in a potentially toxic burden in infants of mothers with elevated BLLs § Postnatal, lead is absorbed primarily through the respiratory and gastrointestinal tracts § The relative absorption varies considerably and is affected by § age • nutritional status • particle size • route of exposure • chemical composition

Metabolism /Distribution of Lead Inorganic lead not metabolized but directly absorbed, distributed, and excreted. g Absorption affected by: Age: Adults absorb 5 -10% of dietary lead Young children absorb 40 -50% and retain 20 -25% g Spontaneous excretion <50 µg/24 hr: may increase in acute poisoning g Absorption increased in diets High in fat Low in Ca, Mg, Fe, Zn, Cu (minerals) g Distribution in two major compartments Bone: Half life of 20 years Soft tissues: Half life 20 -30 days g Toxicity related to concentration in small, mobile soft tissue pool

Distribution of Lead § Accumulates in two compartments § Labile that readily exchanges lead with blood § Inert pool § Mobilized during periods of stress e. g. pregnancy, lactation, fractures, chronic disease, anesthesia § Represents an endogenous source of lead- can maintain ↑ BLL long after exogenous source of lead removed. § Lead toxicity may occur without a major acute exposure - lead accumulates over a lifetime and released slowly

“Acceptable” Blood Lead Level § No “normal” lead level § Lead not a normal element in body - serves no physiologic function § “ Acceptable” substituted for normal- reflects assimilation from food, water, and air § “Acceptable” level in children by CDC criteria - 0 to 4 µg/dl; level periodically lowered as studies show adverse effects at previously acceptable levels § Effects on enzymatic processes and cognition in young children at 10 -15 µg/dl has been amply demonstrated § More recently biologic effects noted at levels as low as 5 µg/d. L § Correct value for blood lead level should be 0

Pathophysiology of lead poisoning n Lead irreversibly binds to sulfhydryl groups of proteins, impairing function of enzymes in various pathways Paglia, Renner, Bhambhani: Clin Biochem 1999

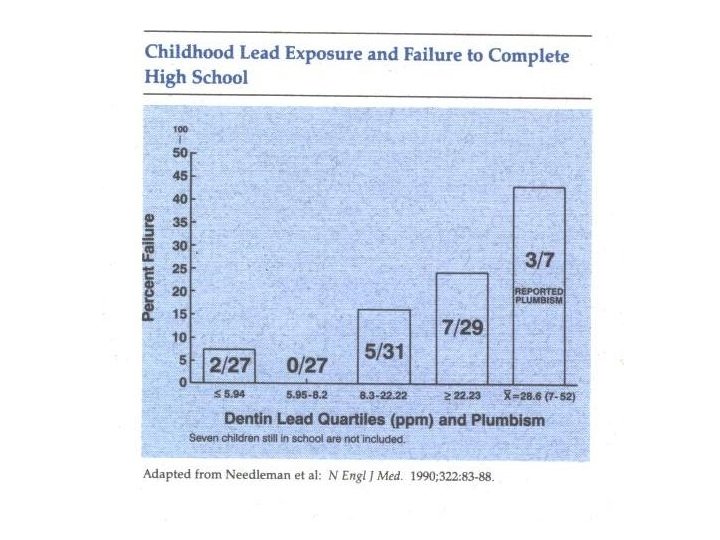
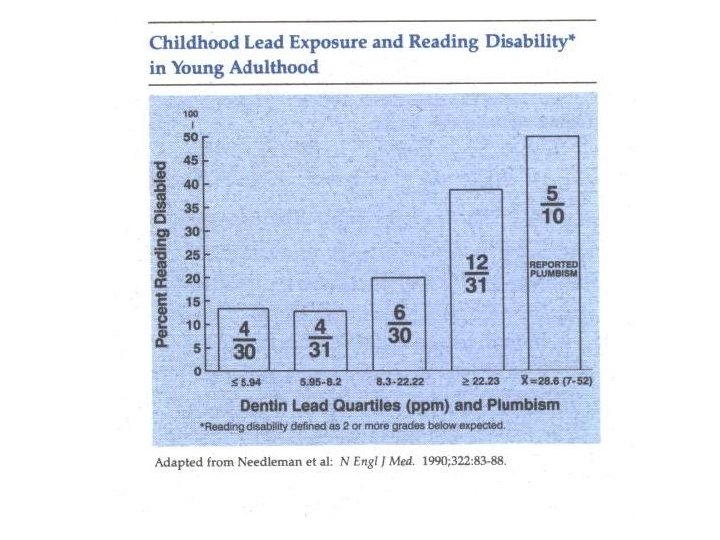
Neurobehavioral Effects of Lead Noted at levels as low as 10 – 15 µg/d. L Correlated with dentine lead > 20 ppm • Impairment of academic success –a 7 -fold increase in failure to graduate from high school • Lower class standing • Greater absenteeism • Impairment of reading skills ( reading disabled ) • Deficits in vocabulary – Fine motor skills – Reaction time – Hand-eye coordination Adverse effects reported at levels <10 g/d. L

Pathophysiology of Cognitive Impairment n In normal children, the brain synaptic density and complexity are markedly increased during the first two years of life enzymes that mediate this process (including protein kinase C and calmodulin) are inhibited at very low concentrations of lead because of the replacement of calcium by lead in these enzymatic reactions n Lead also impairs neural cell adhesion molecules and decreases neurotransmitter synthesis § result is reduced synaptogenesis and imprecise synaptic pruning § Lead uncouples mitochondrial oxidative phosphorylation in the CNS
 showed effects")
Developmental Neurotoxicity of Lead g Port Pirie Cohort Study (1988 & 1992) showed effects of EBL on IQ with an average loss of 2 to 3 points for BLLs averaging 20 µg/d. L, compared with BLLs averaging 10 µg/d. L g Increasing evidence-adverse effects occur at BLLs <10 µg/d. L, little known about distribution of and risk factors associated with levels <10 µg/d. L g Using research instruments that provide valid, reliable measures of attention, and behavior- investigators have identified associations between lead exposure and weaknesses in attention/vigilance ( Bellinger; 1994) aggression (Sciarillo; 1992) somatic complaints antisocial or delinquent behavior (Needleman; 1996) g Neurocognitive deficits are irreversible

Range of Toxic Effects of Lead § § § § Decreased stature Decreased hearing acuity Inability to maintain steady posture Impairment of biosynthesis of active vit D metabolite, 1, 25 - (OH)2 vit D Low total and ionized calcium levels Inhibition of T cell (immune) function Reduced gestational age and birth weight related to elevated maternal and cord BLL Reduced reproductive potential

Diagnosis of Clinical Lead Poisoning § Most patients are asymptomatic § Symptoms are subtle and non-specific § Physical examination generally not abnormal unless patient has acute encephalopathy or neurologic deterioration § Lead poisoning or plumbism should be considered in the differential diagnosis of § Iron deficiency anemia § Seizures § Mental retardation § Severe behavioral disorders/ADD/ADHD § Colicky abdominal pain § Cerebral and abdominal crises of sickle cell

Diagnosis of lead Poisoning n Usually diagnosed based on screening rather than clinical manifestations § fewer than 5% of those diagnosed with lead poisoning are based on clinical presentation n The BLL is a “snapshot” in time, as lead does not remain in blood for long periods of time relative to its turnover in bone § low BLLs do not exclude the possibility of substantial bone lead stores § high BLLs do not necessarily signify a large body burden

Lead Poisoning and Iron Deficiency § Lead absorption is increased in the presence of iron deficiency § Increased lead retention in the presence of iron deficiency § Neurocognitive effects similar in iron deficiency and lead poisoning- effects are not just additive but magnified

Recommended Schedule for Obtaining a Confirmatory Venous Sample Blood µg/dl Time to confirmation testing ≥ Reference Value-9 10 -44 45 -59 60 -69 ≥ 70 1 -3 months 1 week – 1 month * 48 hours 24 hours Urgently as emergency test * The higher the BLL on the screening test, the more urgent the need for confirmatory testing. (Adapted from: Screening Young Children for Lead Poisoning: Guidance for State and Local Public Health Officials. Atlanta: CDC; 1997. )

Schedule for Follow-Up Blood Lead Testing Venous Blood Lead Level Early follow-up testing (2 -4 tests after identification) µg/d. L Later follow-up testing after blood lead level > Reference value -9 3 months 6 -9 months 10 -19 1 -3 months 3 -6 months 10 -24 1 -3 months 25 -44 2 weeks-1 month > 45 As soon as possible
 § 5 -9 (< 10)")
Blood Lead Level Interpretation (Based on confirmatory venous BLL) § 5 -9 (< 10) g/d. L § 10 -14 µg/d. L § Provide lead education and developmental/behavioral surveillance. § Reassess or retest in 1 yr. , sooner if child < 2 yr. , was tested at the onset of warm weather, is at high risk for lead exposure, or exposure sources have changed § Provide lead education and developmental/behavioral surveillance. § Provide f/u testing in 1 mo. , and then every 3 -4 mo.
 § 15 -19 g/d. L § Provide lead")
Blood Lead Level Interpretation (contd. ) § 15 -19 g/d. L § Provide lead education and developmental/behavioral surveillance. § Provide f/u testing in 1 mo. , then every 3 -4 mo § Refer to social services § Initiate professional environmental evaluation/cleanup § Follow guidelines for 20 -44 µg/d. L if BLL remains > 20 µg/d. L (on 2 samples at least 3 mo. apart)
 § 20 -44 g/d. L § Provide lead")
Blood Lead Level Interpretation (contd. ) § 20 -44 g/d. L § Provide lead education and developmental/behavioral surveillance. § Refer to clinical center specializing in lead poisoning § Provide case management § Provide both clinical and environmental management § Ensure lead hazard control
 § 45 -69 g/d. L § Provide lead")
Blood Lead Level Interpretation (contd. ) § 45 -69 g/d. L § Provide lead education § Refer to clinical center specializing in lead poisoning § Provide coordination of care § Provide diagnostic testing within 24 -48 hr. § Perform clinical evaluation and management within 48 hr. § Provide appropriate chelation therapy § Perform aggressive environmental intervention § Provide f/u testing at least once/month (in accordance with chelation therapy) and regular developmental/behavioral surveillance
 § > 70 g/d. L § This is")
Blood Lead Level Interpretation (contd. ) § > 70 g/d. L § This is a medical emergency § Perform diagnostic testing immediately (samples processed emergently) § Hospitalize immediately and begin chelation therapy § Begin other activities as above

Treatment of Lead Poisoning § I. Source Identification and Eradication A. Notify department of health for home inspection (Public health efforts to prevent lead exposure through the removal of environmental lead hazards continue to be the most effective measure) B. If household leaded paint is the source , deleading should be done by certified contractors so that lead dust is not disseminated throughout the house during repairs. Children and pregnant women should be out of the home during the deleading process C. Recommend wet-dusting and -mopping with phosphate - containing detergent until definitive repairs are made and, also, on a continuing basis

Changes in BL and FEP levels in an infant hospitalized with undue lead absorption subsequent to remaining in a home during burning, scraping, and sanding of lead-based paint. Infant underwent chelation therapy that reduced BL from 65 to 22 µg/d. L. The subsequent rise in BL from 22 to 47 µg/d. L indicated incomplete abatement of lead hazards. The family then moved to modern “lead-free” public housing, where BL and FEP decreased after several weeks. Adapted from Chisolm JJ Jr, Barltrop D: Recognition and management of children with increased lead absorption Arch Dis Childh. 1979; 54: 249 -262.

Treatment of Lead Poisoning § II. Nutrition A. Check for adequate iron and calcium (at least 1 g daily) intake B. Iron supplementation, if iron deficiency present, even without anemia ( MCV and RDW may be the indication ) C. Supplementation of other trace metals such as copper, zinc in the form of Multivitamin preps with minerals D. Reduced fat intake – delayed gastric emptying time with fatty meals (not low-fat diet but no fried foods) E. Fruits & vegetables – phytates and cellulose bind with lead and interfere in absorption

Treatment of Lead Poisoning n III. Chelation Therapy § Most clinicians will agree with chelation at > 45 µg/dl; most ineffective method of removing lead- only 2% of total body lead removed § Patients should be evaluated for chelation on the basis of – clinical presentation – BLL and other laboratory measurements – age – presence of iron deficiency – lead body burden

Treatment of Lead Poisoning n Follow-up should be individualized and the child followed until 6 yr of age or longer, if necessary n Serial measurements of BLL and EP for evaluation and monitoring n Neurodevelopmental lags may not be evident immediately! § Delays may become apparent as the child faces the challenge of new academic activities
 n Goals currently remain unchanged:")
1997 CDC Screening Recommendations Endorsed by the AAP (2008) n Goals currently remain unchanged: To ensure that children at risk are tested Universal screening still the policy for communities with inadequate data on the prevalence of elevated BLLs, in communities with >27% of housing built before 1950, and all children enrolled in Medicaid Targeted screening recommended where <12% of children have BLLs >10 μg/d. L or, where < 27% of housing built before 1950 n Above based on analyses suggesting benefits of universal screening outweigh costs when prevalence of elevated BLLs in range of 11% to 14% or higher

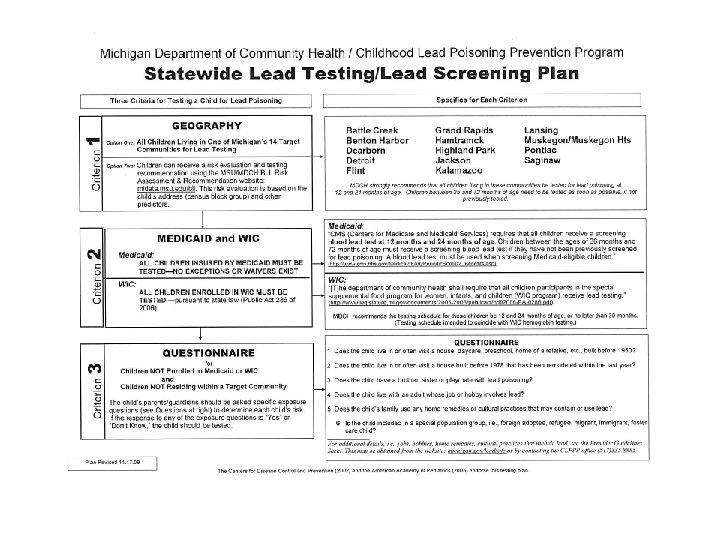
Screening/Testing for Lead Poisoning in Michigan § All children in the Medicaid program are required by Medical Services Administration to be tested at 12 and 24 mos. of age; between 36 and 72 mos. if not tested previously (no exceptions or waivers) § All children within designated “high-risk” ZIP code areas as in the ages above § Parents/Guardians of children < age 6 (not in previous 2 categories) should be asked questions concerning the child’s potential sources of exposure § Health care providers have always the option of testing if child determined to be at risk or if the parent/guardian requests testing

Testing/Screening for Lead Poisoning § NO requirement that the initial blood test be a venous specimen. A capillary specimen is acceptable § If the capillary result is below the CDC “level of concern” (5 µg/d. L or less), no other action is necessary until the next recommended testing time. § If elevated (> 5 µg/d. L) then confirmatory venous sample should be obtained. This need not be done in the provider’s office.

Barriers to Universal Screening § Some children at risk for lead exposure because of poverty, residence in deteriorating housing do not receive routine well-child care and thus not screened for lead § Many providers and parents do not believe that lead exposure is a problem in their community

Costs - Benefits of Reducing Lead Exposure n Costs of medical care- a 1 μg/d. L decrease in mean BLL in the population may produce $3. 5 billion savings in health care costs/yr n Costs of compensatory education (requiring assistance from a reading teacher, school psychologist, or other specialist) for an average of 3 yrs= an estimated cost of $3320 per child with BLL over 25 μg/d. L in 1989 dollars n Lost wages - small decrements in IQ may cause decreased earning potential; estimations of $1 billion saved/yr by lowering of BLL by 1 μg/d. L n Correctional costs - $60, 000 -80, 000 per individual/yr - total estimates not available

CDC Guidelines for Identification and Management of Lead Exposure in Pregnancy and Lactating Women § Only about I% of US women have BLL of 5 µg/d. L or greater § Maternal BLLs in pregnancy follow a U-shaped curve with levels lowest at 12 -20 weeks’ gestation § Maternal BLLs may increase just prior to delivery and while lactating § BLL testing required for women identified with risk for exposure § Occupational, pica, recent immigrants, lead-based hobby

Recommendations for Pediatricians § Provide anticipatory guidance to parents of all infants and toddlers re: prevention of lead poisoning-parents should be made aware of normal mouthing behavior and ascertain whether their homes, work, or hobbies present a lead hazard to the child. Lead contaminated dust at risk for child § Inquire about lead hazards in housing and child care setting. Home inspection can be requested if suspicion of lead hazards. Expert training needed for safe repair of lead hazards- families should be discouraged from undertaking repairs on their own. Children should be kept away from remediation activities, and home inspected before child returns.
 § Know state Medicaid regulations and measure BLL IN")
Recommendations for Pediatricians (contd. ) § Know state Medicaid regulations and measure BLL IN Medicaid-eligible children. § Find out if there is relevant guidance from city or state health department about testing children not eligible for Medicaid. If none, consider testing all children or use questionnaire for targeted testing § Be aware of any special risk groups prevalent locally, such as immigrants, foreign-born adoptees, refugees, or children whose parents work in lead-related industries, or those who live in, visit, or work on old houses § Encourage application for HUD or other monies available for remediation in areas of old housing and lead hazards www. michigan. gov/leadsafe

Role of the Health Care Provider § Cannot wait to see the potential cognitive and behavioral consequences § Early literacy programs including enrollment in Early On and Head Start § School Health Services § Nutrition Programs § Early Interventions such as Resource Room Help and Tutoring
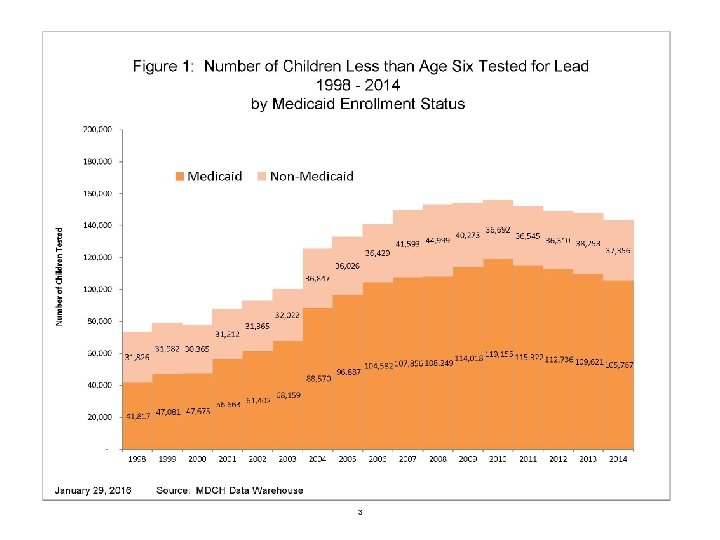

MDHHS Data Highlights • 143, 123 children less than age 6 were tested for lead in 2014 in Michigan, of which 105, 767 (73. 8%) were insured by Medicaid. • Of the 87, 917 children age one and two who were tested, 63, 127 (71. 8%) were insured by Medicaid. Note: Medicaid requires that enrolled children be tested at one and two years of age. • Wayne County (excluding Detroit) and the City of Detroit had the largest numbers of tested children: 18, 348 (22. 4%) and 22, 842 (38. 2%) respectively of tested children in Michigan.
 • 5, 053 (3. 5%) and 3, 141 (3. 6%)")
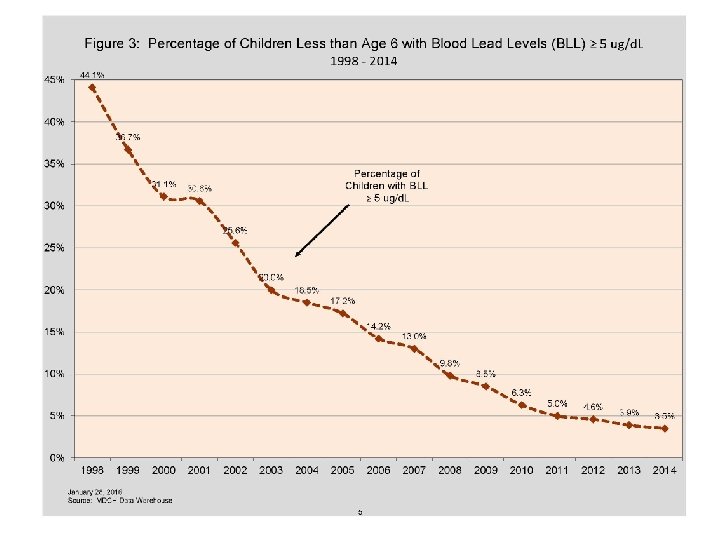
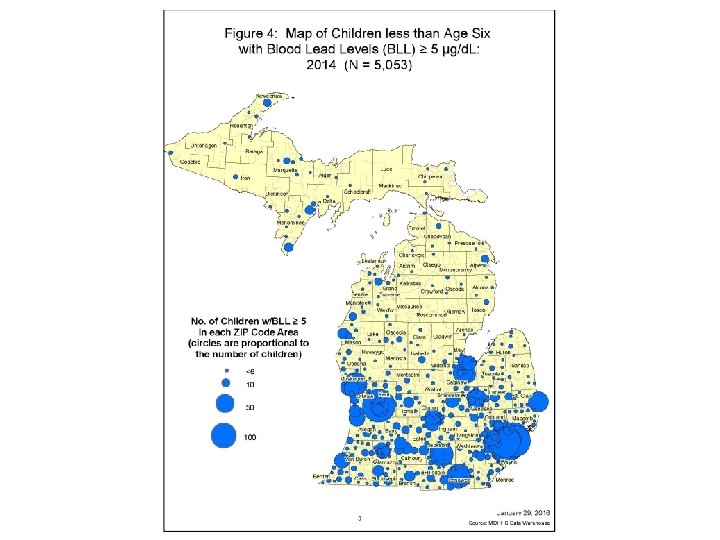
MDHHS Data Highlights (Contd) • 5, 053 (3. 5%) and 3, 141 (3. 6%) of tested children less than age 6 and age one and two respectively had BLL =>5 μg/d. L in 2014. • The percent of children with BLL =>5 μg/d. L declined significantly from 1998, from 44. 1% of tested children under age 6 had a blood lead level =>5 μg/d. L to 3. 5% in 2014. • The percent of children with elevated BLLs varied from county to county with a range of 10. 2% (Lenawee) down to less than 1% (multiple counties).
88a4498868947d343b7b001ad83801ab.ppt