1e40ecd8b2cff844476f8735cec44fed.ppt
- Количество слайдов: 25
Latency as a Performability Metric: Experimental Results Pete Broadwell pbwell@cs. berkeley. edu
Outline 1. Motivation and background • • Performability overview Project summary 2. Test setup • • PRESS web server Mendosus fault injection system 3. Experimental results & analysis • • How to represent latency Questions for future research
Performability overview • Goal of ROC project: develop metrics to evaluate new recovery techniques • Performability – class of metrics to describe how a system performs in the presence of faults – First used in fault-tolerant computing field 1 – Now being applied to online services 1 J. F. Meyer, Performability Evaluation: Where It Is and What Lies Ahead, 1994
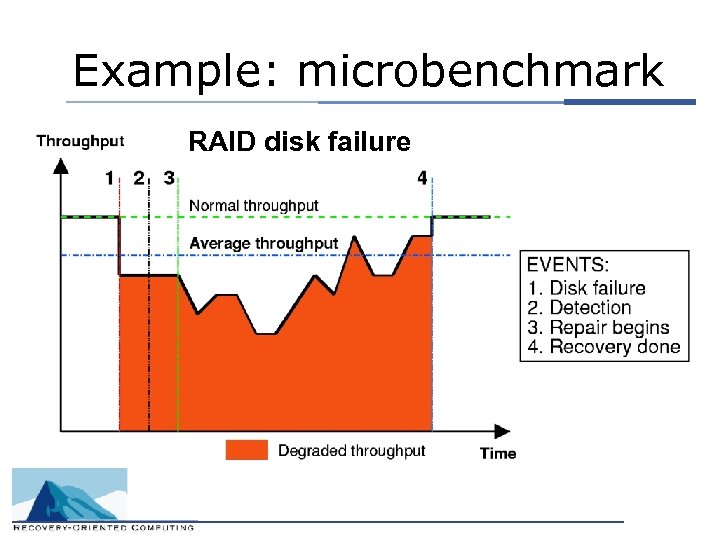
Example: microbenchmark RAID disk failure
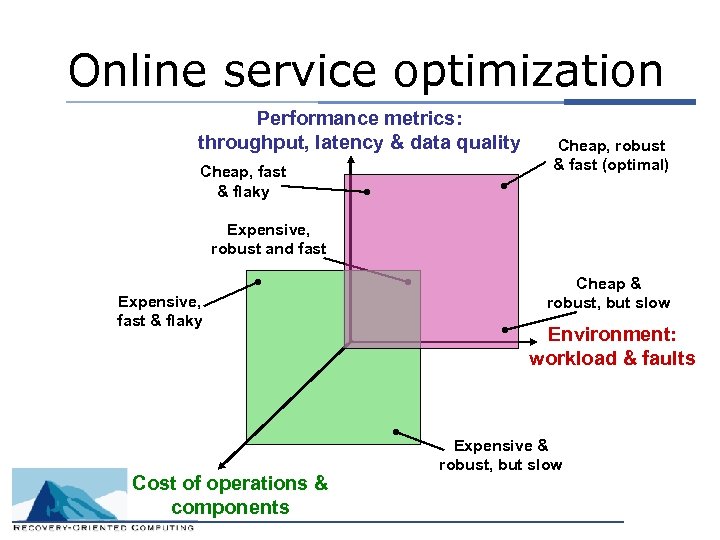
Project motivation • • Rutgers study: performability analysis of a web server, using throughput Other studies (esp. from HP Labs Storage group) also use response time as a metric Assertion: latency and data quality are better than throughput for describing user experience How best to represent latency in performability reports?
Project overview • Goals: 1. Replicate PRESS/Mendosus study with response time measurements 2. Discuss how to incorporate latency into performability statistics • Contributions: 1. Provide a latency-based analysis of a web server’s performability (currently rare) 2. Further the development of more comprehensive dependability benchmarks
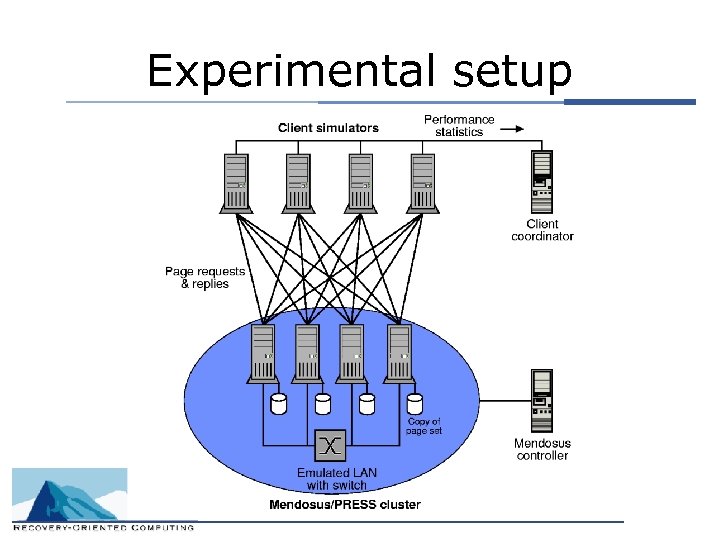
Experiment components • The Mendosus fault injection system – From Rutgers (Rich Martin) – Goal: low-overhead emulation of a cluster of workstations, injection of likely faults • The PRESS web server – Cluster-based, uses cooperative caching. Designed by Carreira et al. (Rutgers) – Perf-PRESS: basic version – HA-PRESS: incorporates hearbeats, master node for automated cluster management • Client simulators – Submit set # of requests/sec, based on real traces
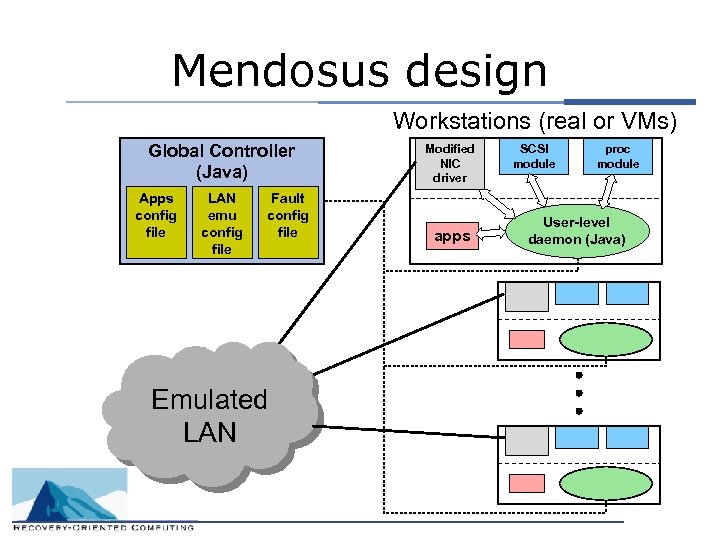
Mendosus design Workstations (real or VMs) Global Controller (Java) Apps config file LAN emu config file Fault config file Emulated LAN Modified NIC driver apps SCSI module proc module User-level daemon (Java)
Experimental setup
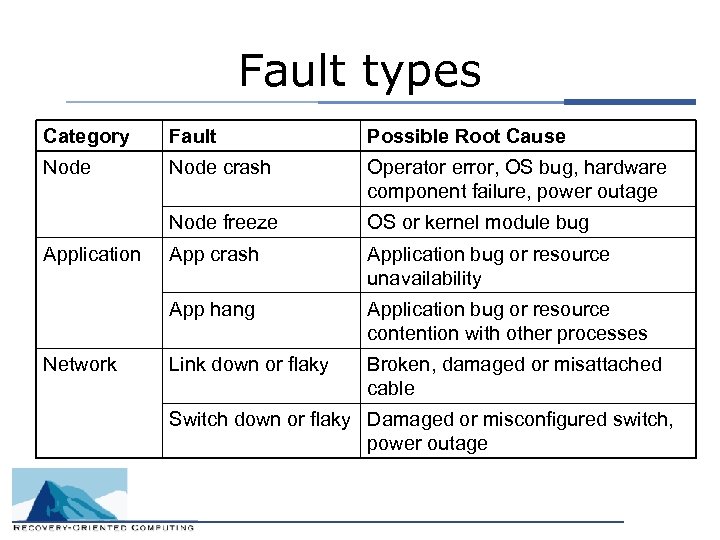
Fault types Category Fault Possible Root Cause Node crash Operator error, OS bug, hardware component failure, power outage Node freeze OS or kernel module bug App crash Application bug or resource unavailability App hang Application bug or resource contention with other processes Link down or flaky Broken, damaged or misattached cable Application Network Switch down or flaky Damaged or misconfigured switch, power outage
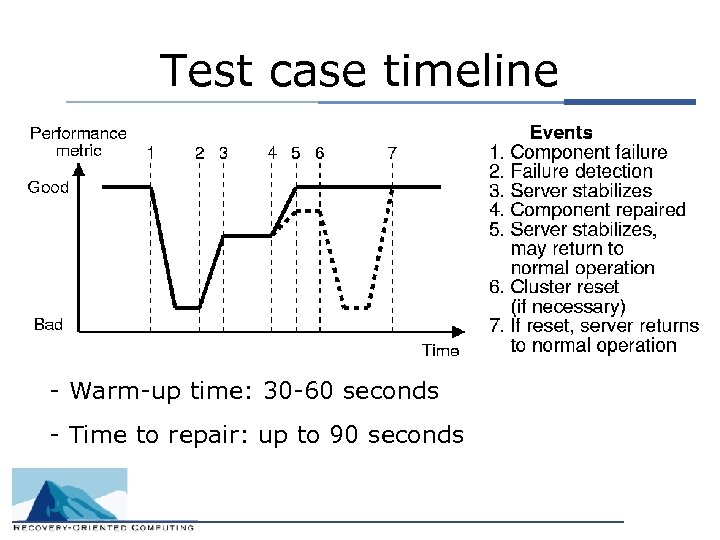
Test case timeline - Warm-up time: 30 -60 seconds - Time to repair: up to 90 seconds
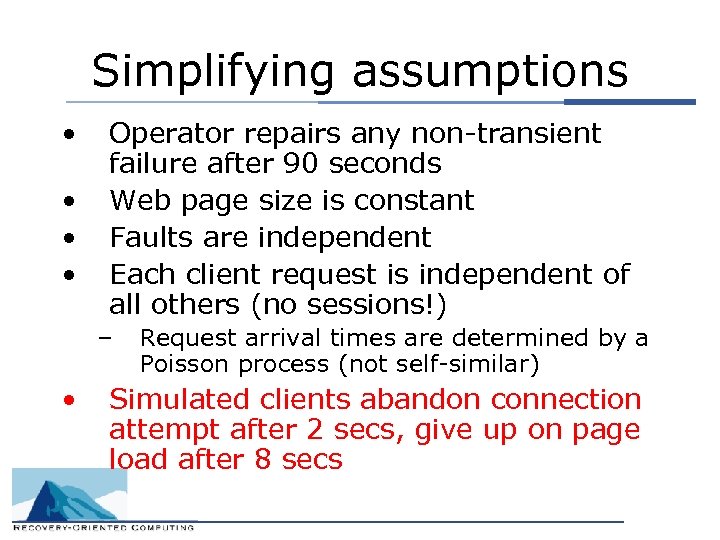
Simplifying assumptions • • Operator repairs any non-transient failure after 90 seconds Web page size is constant Faults are independent Each client request is independent of all others (no sessions!) – • Request arrival times are determined by a Poisson process (not self-similar) Simulated clients abandon connection attempt after 2 secs, give up on page load after 8 secs
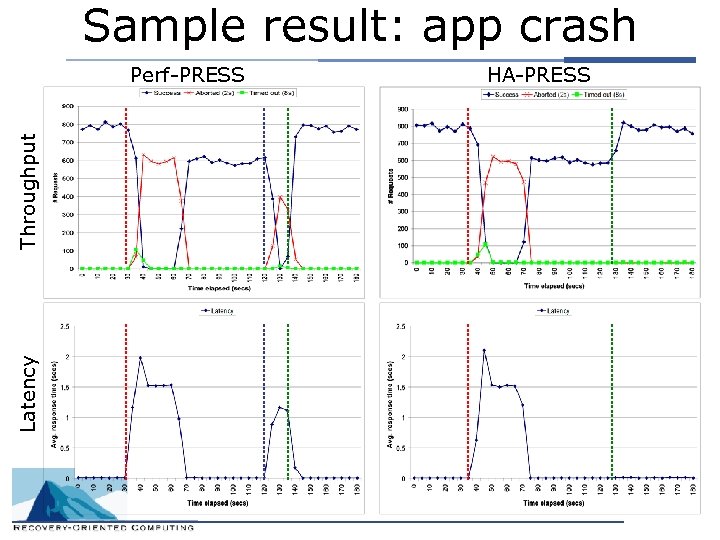
Sample result: app crash Latency Throughput Perf-PRESS HA-PRESS
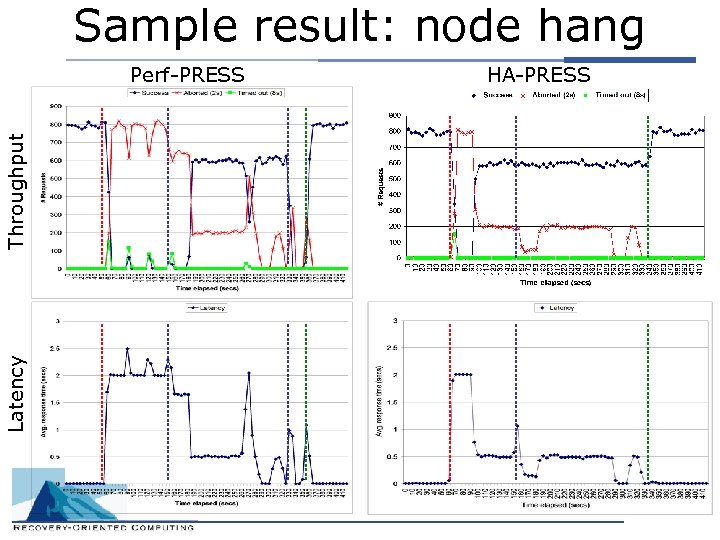
Sample result: node hang Latency Throughput Perf-PRESS HA-PRESS
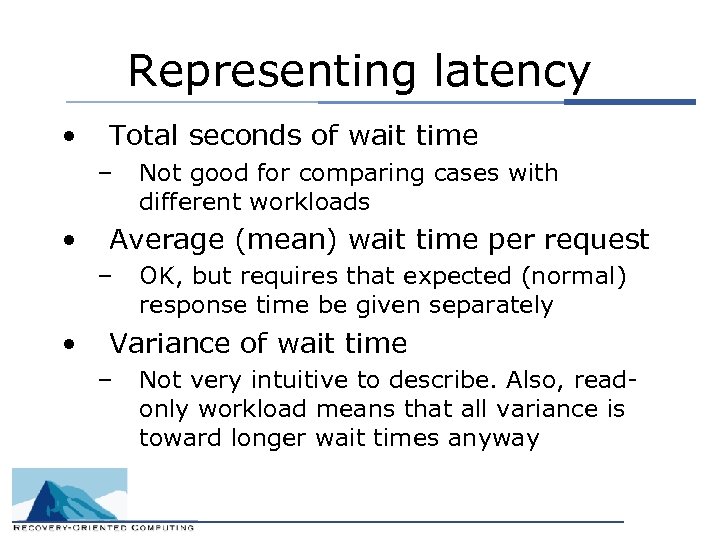
Representing latency • Total seconds of wait time – • Average (mean) wait time per request – • Not good for comparing cases with different workloads OK, but requires that expected (normal) response time be given separately Variance of wait time – Not very intuitive to describe. Also, readonly workload means that all variance is toward longer wait times anyway
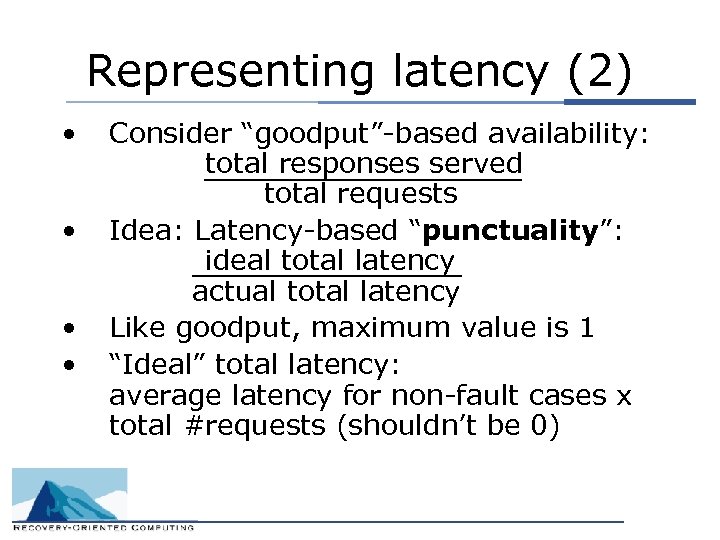
Representing latency (2) • • Consider “goodput”-based availability: total responses served total requests Idea: Latency-based “punctuality”: ideal total latency actual total latency Like goodput, maximum value is 1 “Ideal” total latency: average latency for non-fault cases x total #requests (shouldn’t be 0)
Representing latency (3) • Aggregate punctuality ignores brief, severe spikes in wait time (bad for user experience) – Can capture these in a separate statistic (EX: 1% of 100 k responses took >8 sec)
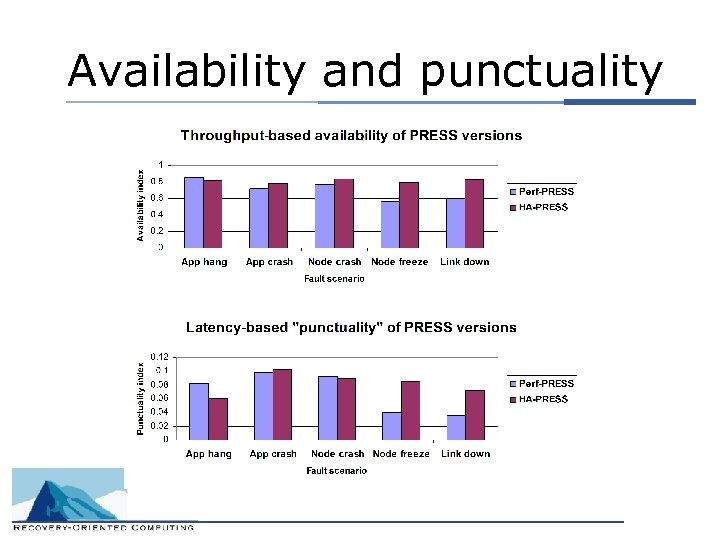
Availability and punctuality
Other metrics • Data quality, latency and throughput are interrelated – • Is a 5 -second wait for a response “worse” than waiting 1 second to get a “try back later”? To combine DQ, latency and throughput, can use a “demerit” system (proposed by Keynote)1 – These can be very arbitrary, so it’s important that the demerit formula be straightforward and publicly available 1 Zona Research and Keynote Systems, The Need for Speed II, 2001
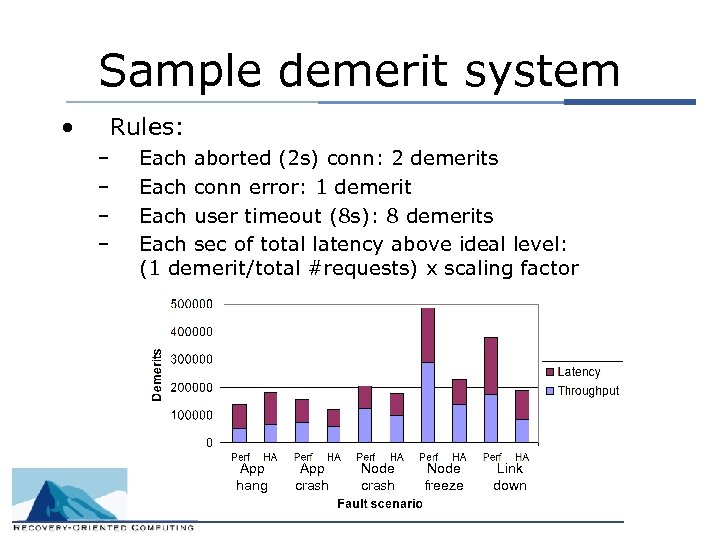
Sample demerit system • Rules: – – Each aborted (2 s) conn: 2 demerits Each conn error: 1 demerit Each user timeout (8 s): 8 demerits Each sec of total latency above ideal level: (1 demerit/total #requests) x scaling factor App hang App crash Node freeze Link down
Online service optimization Performance metrics: throughput, latency & data quality Cheap, fast & flaky Cheap, robust & fast (optimal) Expensive, robust and fast Expensive, fast & flaky Cost of operations & components Cheap & robust, but slow Environment: workload & faults Expensive & robust, but slow
Conclusions • • Latency-based punctuality and throughput-based availability give similar results for a read-only web workload Applied workload is very important – • Reliability metrics do not (and should not) reflect maximum performance/workload! Latency did not degrade gracefully in proportion to workload – At high loads, PRESS “oscillates” between full service, 100% load shedding
Further Work • • • Combine test results & predicted component failure rates to get longterm performability estimates (are these useful? ) Further study will benefit from more sophisticated client & workload simulators Services that generate dynamic content should lead to more interesting data (ex: RUBi. S)

Latency as a Performability Metric: Experimental Results Pete Broadwell pbwell@cs. berkeley. edu
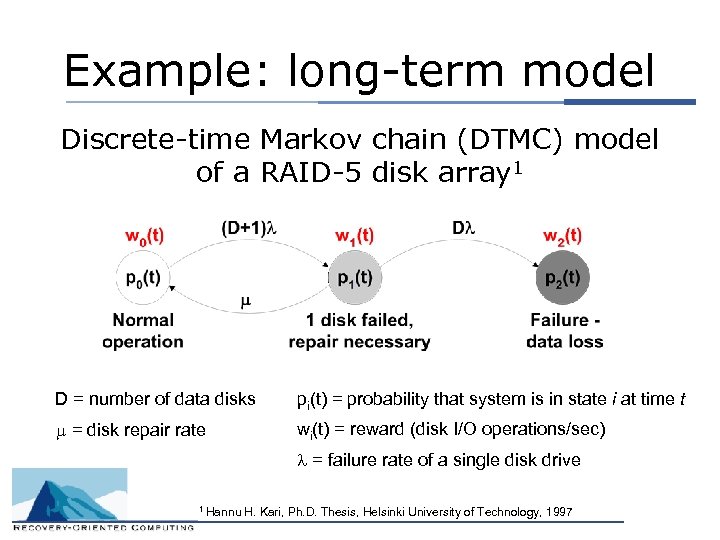
Example: long-term model Discrete-time Markov chain (DTMC) model of a RAID-5 disk array 1 D = number of data disks pi(t) = probability that system is in state i at time t m = disk repair rate wi(t) = reward (disk I/O operations/sec) l = failure rate of a single disk drive 1 Hannu H. Kari, Ph. D. Thesis, Helsinki University of Technology, 1997
1e40ecd8b2cff844476f8735cec44fed.ppt