

544e5771cceee98994155d5827fd564d.ppt
- Количество слайдов: 64
 King’s College, Financial Mathematics London January 19, 2010 5: 30 pm AGENTS IN THE GLOBAL NETWORK: SELF-ORGANIZATION AND INSTABILITIES Luciano Pietronero Collaborators: Valentina Alfi, Matthieu Cristelli and Andrea Zaccaria Institute of Complex Systems, CNR, Rome Italy University of Rome Sapienza and Centro Fermi, Rome (WEB page: http: //pil. phys. uniroma 1. it)
 Summary • After the subprime crisis there have been many conjectures for the possibile origin of this instability. Most suggestions focus on concepts like collective behavior, contagion, network domino effect, coherent portfolios, lack of trust, liquidity crisis, leverage effect and, in general psycological components in the traders behavior. • Standard risk analysis is usually linear analysis within a cause-effect relation. Possibly new insight to the risk problem could profit could be inspired by complex systems theory. • Different perspective in which the interaction between agents (direct or in direct) is explicitely considered together with the idea that the system may become globally unstable in the sense of self-organized criticality. The analysis is therefore shifted from the linear cause-effect relation to the study of the possibile (nonlinear) intrinsic instabilities. • We discuss some steps towards a systematic analysis of these ideas based on agent models and order book models together with the statistical analysis of experimental data. The final objective of these studies would be to define the characteristic properties of each of the above concepts from the models and then to identify their role and importance in the real financial markets. • To achieve this goal it is essential to increase the number and quality of the Stylized Facts which are identified from the massive data available
 Collegium Budapest, October 8 - 10, 2009 Financial risk, market complexity and regulations. (I. Kondor et al. ) • M. Summer (National Bank of Austria) Model of network, not much evidence for domino effect, insolvency not the key point, leverage important - debt overhang • J. Langsam (Morgan Stanley USA) Proposition of US Institute of Finance (www. ce-nif. org) Large psicological component, Lack of network overview Role of direct links vs general Trust Systemic risk definition (metric); data collection; service agency • J. Kiraly, A. Farkas (National Bank and Hungarian Authority) Contagion was not through toxic; Leverage problem
 Traditional approach, not much Complexity, big discussion") • M. Gordy (Federal Reserve USA) Traditional approach, not much Complexity, big discussion Procyclicality: Nonlinear amplification feedback Not topology but the fact that many large institutions behaved the same • G. Barone-Adesi (Institute of Finance, Lugano CH) Strongly correlated portfolios is risky • P. Hartmann (European Central Bank, FKF. ) Truly systemic financial crisis; Risk suppression; Regulation European systemic risk board Powerful feedback and amplification, nonlinearity 6% of US market has led to a global collapse • M. Tisset (Banque de France) Resileince, Liquidity
• M. Gordy (Federal Reserve USA) Traditional approach, not much Complexity, big discussion Procyclicality: Nonlinear amplification feedback Not topology but the fact that many large institutions behaved the same • G. Barone-Adesi (Institute of Finance, Lugano CH) Strongly correlated portfolios is risky • P. Hartmann (European Central Bank, FKF. ) Truly systemic financial crisis; Risk suppression; Regulation European systemic risk board Powerful feedback and amplification, nonlinearity 6% of US market has led to a global collapse • M. Tisset (Banque de France) Resileince, Liquidity
 Official reports on the Crisis: • Mid 2008: Danish Central Bank Worst scenario: subprime continues, US recession, increase of 2. 5% of interbank interest. Basic stability of the bank system !!! • Feb. 25, 2009: de Larosiere EEC Report Financial crisis - real economy - No more Trust Risk mispriced, excessive leverage Regulations on individuals but not on macro systemic risk Contagion - Correlations • NB: SAME STARTING INFORMATION BUT COMPLETELY DIFFERENT CONCLUSIONS (A FEW MONTHS LATER) PROBLEMS WITH CAUSE-EFFECT RELATION
 • Situation of equilibrium with agents") Classic theory of economics: (New Scientist editorial, 2008) • Situation of equilibrium with agents (quasi) rational and informed • Important price changes correspond to new information which arrives on the market • This information modifies the ratio between offer and demand then also the price • Relation cause - effect
Classic theory of economics: (New Scientist editorial, 2008) • Situation of equilibrium with agents (quasi) rational and informed • Important price changes correspond to new information which arrives on the market • This information modifies the ratio between offer and demand then also the price • Relation cause - effect
 Problems with the classic theory: • Great cathastrofic events like the ‘ 87 crash, the Inernet bubble of 2000 and the recent case of the Subprimes do not seem to have any relation with specific events or new information • Also the Stylized Facts at smaller scales cannot be really explained within the standard model • Breaking of the cause-effect relation: then what is the real origin of large price changes?
 Physics, Complexity, Socio-Economics: Physics: try to discover the laws of nature Economics: are there laws to be discovered? evolutive elements, adaptivity, the whole society is involved Complexity: new vision and possible point of contact Simplicity vs Realism (reproducing vs understanding)
 NEW perspective: • The market seems to evolve spontaneously towards states with intrinsic instability which then collapse or explode (endogenous) triggered by minor perturbations • Importance of social interactions (herding) effects especially in situations of uncertainity with respect to the fundamentals of economics (fear, panic, euphoria) • Breaking of the cause-effect relation and of the traditional economic principles • Relation to Critical phenomena and SOC in physics(? ) Feedback, amplification, nonlinearity
 Scaling, Criticality (64 - 70) and RG") MODELS AND BASIC PROBLEMS Ising * (1911) Scaling, Criticality (64 - 70) and RG Group (>72) Percolation* (‘ 70 -’ 80) Glasses Spin Glasses* etc. (>74) Deterministic Chaos* (78) Fractal Geometry (‘ 80 -’ 90) Polymers and Soft Matter Dynamical Systems and Turbulence Fractal Growth Physical Models: DLA/DBM* (82 -84) Selforganized Criticality Sandpile* (87) Granular Systems (‘ 90) Minority Game (‘ 97) Rare Events Complex Networks (>2000) INTERDISCIPLINARY APPLICATIONS Condensed Matter problems Phase Transitions Magnetic Systems Bio-inspired Problems Astrophysics Geophysics Information Theory Optimization Economics and Finance Social Sciences (Random Walk, Bachelier 1900) Agent Based Models (very many) Apply old Models or develop New Models? Universality?
MODELS AND BASIC PROBLEMS Ising * (1911) Scaling, Criticality (64 - 70) and RG Group (>72) Percolation* (‘ 70 -’ 80) Glasses Spin Glasses* etc. (>74) Deterministic Chaos* (78) Fractal Geometry (‘ 80 -’ 90) Polymers and Soft Matter Dynamical Systems and Turbulence Fractal Growth Physical Models: DLA/DBM* (82 -84) Selforganized Criticality Sandpile* (87) Granular Systems (‘ 90) Minority Game (‘ 97) Rare Events Complex Networks (>2000) INTERDISCIPLINARY APPLICATIONS Condensed Matter problems Phase Transitions Magnetic Systems Bio-inspired Problems Astrophysics Geophysics Information Theory Optimization Economics and Finance Social Sciences (Random Walk, Bachelier 1900) Agent Based Models (very many) Apply old Models or develop New Models? Universality?
 Universality? In nature trees are alike but not identical. Similarity and common basic structure but no strict universality. Exponents can therefore depend on specific situations: richness to be explored.
 OUR PERSPECTIVE • Workable ABM, clear math and properties • New elements: N variable, Stylized Facts due to Finite Size Effects, Self-organization • Approximate scaling, no strict universality: effective exponents depend on situation • Liquidity crises: Order Book Model for finite liquidity • ABM in the Global Network, Leverage • Coherence, correlated portfolios, similar behavior; risky
: • Arbitrage -- Random Walk (B&S) • Fat") Stylized Facts (Very few; Universal? ): • Arbitrage -- Random Walk (B&S) • Fat tails, Volatility Clustering etc. AND ALSO • Non stationarity • Self-organization, Liquidity • Global Network
Stylized Facts (Very few; Universal? ): • Arbitrage -- Random Walk (B&S) • Fat tails, Volatility Clustering etc. AND ALSO • Non stationarity • Self-organization, Liquidity • Global Network
 ABM model with moving average-based strategies (V. Alfi, L. P. , A. Zaccaria EPL 2008) (Lux Marchesi 2000; Other suggestions can be easily implemented; i. e. W. Shaw 2009) N players: NF fundamentalists NC chartists At each time step, each agent can change its strategy with probabilities Price formation (price change related to excess demand; liquidity problem)
 Switching between F and C strategies Origin of the Finite size effects F Kirman 1993; Alfarano&Lux 2006 fluctuations C
 N=50 Too low fluctuations N=500 NB:") Too fast fluctuations Nc Intermittency OK (Stylized Facts) N=50 Too low fluctuations N=500 NB: For N diverging fluctuations are suppressed. Therefore Stylized Facts correspond to finite size effects N=5000
Too fast fluctuations Nc Intermittency OK (Stylized Facts) N=50 Too low fluctuations N=500 NB: For N diverging fluctuations are suppressed. Therefore Stylized Facts correspond to finite size effects N=5000
 Asymmetric case: Basically Fundamentalists with bubbles due to Chartists (assumption of asymptotic stability: not quite realistic in these times) If the transition probabilities are symmetric the equilibrium distribution is bimodal or unimodal depending on the parameters With asymmetric transition probabilities the scenario is richer
 TENDENCY TO FUNDAMENTALISM: INSTITUTIONAL INVESTORS IN QUIET TIMES bimodal region relative number of chartists For large value of N chartists are suppressed
 N dependence of price fluctuations: Switching effect between Fundamentalists and Chartists N =50 Changes of opinion are too fast N=500 N 5000 Intermittent behavior: OK Too stable and dominated by fundamentalists (Lux, Stauffer 2000) Puzzle: Interesting fluctuations appear at finite N and disappear for infinite N; unlike Critical Phenomena in Physics
") N=1 M=10 b=5· 10 -4 K=0. 05 B=1 g=0. 1 s=1 (Pf = 0) NB: even a single agent can show some intermittency Bursts of price fluctuations appear spontaneously and are clearly due to Chartists’ dynamics (Possibility of analytical studies)
N=1 M=10 b=5· 10 -4 K=0. 05 B=1 g=0. 1 s=1 (Pf = 0) NB: even a single agent can show some intermittency Bursts of price fluctuations appear spontaneously and are clearly due to Chartists’ dynamics (Possibility of analytical studies)
 N=100 M=10 b=1· 10 -3 K=0. 002 B=1 g=0. 1 s=1 N=100 NB: All the parametrs are now in full control BUT fine tuning is always necessary
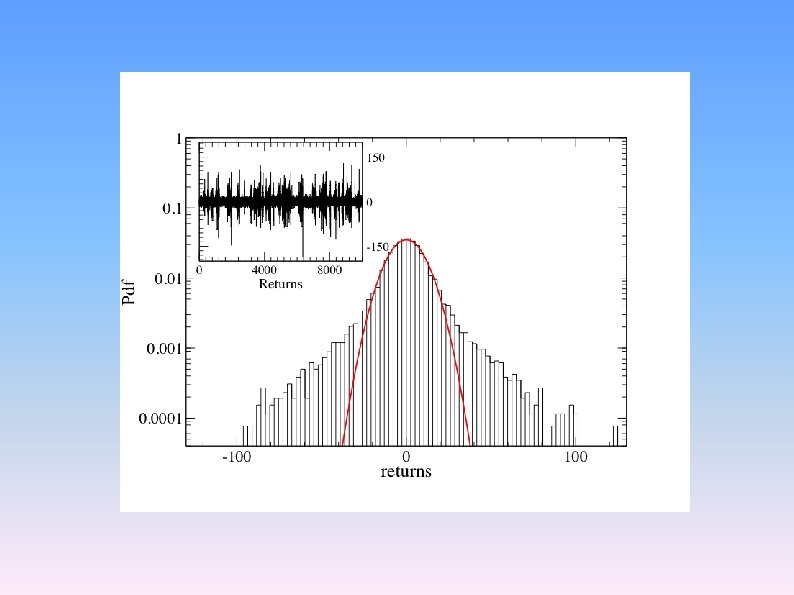
 Autocorrelation functions of returns and square returns NB: SF arise from Finite Size Effects Probability density function of price-returns
 What is really N or N*? • In general the number of agent N is fixed in the Agent Models This idea originates probably from Stat Phys but it is rather unrealistic for trading Nonstationarity, route to Self-organization • NB: Strongly correlated portfolios lead to an effective reduction of N* and therefore towards less stable situations. Comments by M. Gordy, G. Barone-Adesi, M. Marsili M. Buchanan (hedge funds with similar portfolio) Important: Estimate N* from real market data In the model the N agents may influence by the herding rules, but if they a priori behave the same this decreases N (network, leaders, gurus, media, panic etc. )
 ACTION NC and NF detect interesting signals and are stimulated to take an action In this case N* increases ACTION In this case little action is stimulated N* drops ~ CONSTANT
 ACTION INCREASE OF N* This resembles the GARCH phenomenology but At a microscopic level Following our concept: I I
 Therefore there is a multiplicative nature of correlations which leads to a persistence in the value of (high or low). CONCEPTUAL FRAMEWORK FOR FAT TAILS AND VOLATILITY CLUSTERING (NONSTATIONARITY) MICROSCOPIC AGENT-LIKE INTERPRETATION OF ARCH-GARCH PHENOMENOLOGY
 increases but price trend is much more") Why no arbitrage ? Any action (N*) increases but price trend is much more complex Therefore: much more information is crucial for the sign of the price return
Why no arbitrage ? Any action (N*) increases but price trend is much more complex Therefore: much more information is crucial for the sign of the price return
 Towards Self-organization Asymmetric case: Basically Fundamentalists with bubbles due to Chartists (not quite realistic in these times) If the transition probabilities are symmetric the equilibrium distribution is bimodal or unimodal depending on the parameters With asymmetric transition probabilities the scenario is richer
 ABM results for the Self-organized state Real data") (red N=50; black N=500; green N=5000) ABM results for the Self-organized state Real data from NYSE stock NB: largest peaks Correspond to the Intermediate case. It takes some stability in the C state to develop a bubble
(red N=50; black N=500; green N=5000) ABM results for the Self-organized state Real data from NYSE stock NB: largest peaks Correspond to the Intermediate case. It takes some stability in the C state to develop a bubble
 NB: Black (N=500) is the only case leading") (red N=50; black N=500; green N=5000) NB: Black (N=500) is the only case leading to stylized facts
(red N=50; black N=500; green N=5000) NB: Black (N=500) is the only case leading to stylized facts
 depending on the") Basic criterion for Self-Organization: • Agents decide whether trading (or not) depending on the price movements they observe (Competition with other investments in the Global Network) • Stable prices: Less trading • Large action (price movements): More trading (Euphoria, bubbles, panic, crashes) Caution: some agents may prefer a stable market and be scared by fluctuations. This would require an analysis of different time scales and, in any case, these agents certainly do not produce the Stylized Facts
Basic criterion for Self-Organization: • Agents decide whether trading (or not) depending on the price movements they observe (Competition with other investments in the Global Network) • Stable prices: Less trading • Large action (price movements): More trading (Euphoria, bubbles, panic, crashes) Caution: some agents may prefer a stable market and be scared by fluctuations. This would require an analysis of different time scales and, in any case, these agents certainly do not produce the Stylized Facts
 Each agent calculate the price-volatility on the previous T steps On the basis of the calculated volatility each agent has a probability to enter/leave the market if the volatility is above/under a certain threshold
 evolve and finally converge to") Self-Organization in action: Different starting N (50, 500, 3000) evolve and finally converge to the Quasi-critical state (N=500) which corresponds to the Stylized Facts N 2 N* N 1
Self-Organization in action: Different starting N (50, 500, 3000) evolve and finally converge to the Quasi-critical state (N=500) which corresponds to the Stylized Facts N 2 N* N 1
 Linear dynamics; N = 500; Heterogeneity with respect to their time horizon Volatility clustering is decreased because the behavior is less coherent Apparent power law behavior but no fundamental critical phenomenon
 Multiplicative dynamics: Extreme sensitivity to parameter region. Slightly different parameters lead to very different Fat Tails
 Comparison between linear and multiplicative dynamics Fat Tails are usually larger for the Multiplicative case
 Power laws and universality? • Herding: naturally leads to population switching (i. e. F vs C) For a given N and a single time horizon this leads to a characteristic time scale. Distribution of trading horizons leads to many time scales • Nonstationarity: key element for the Self-organization traders may decide NOT to play or to play variable amounts of shares (volume) Switching situation: Finite Size Effects • Strong deviations from gaussian behavior but not necessarily critical with universal power laws. NB. Different opinions about data analysis: HE Stanley; R. Cont; J. Kertesz; D. Sornette; C. Tsallis …
 Fat Tail effective exponents as a function of model properties: More Chartists lead to larger Tails Nonuniversality leads to a richer interpretation of data
 Real data: difficult to define a single exponent Alternative for non gaussianity: Kurthosis
 Kurthosis vs Market Sentiment: Chartists or Fundamentalists Stabilization vs destabilization not optimist vs pessimist F C
 ABM ideal ABM real General Motors Lehman Recent Crisis Pf=? ? ? Subprime
 But") ABM + Environment BASIC ANSATZ Fundamentalists dominate in the long run (? ) But in a complete model this may require evolution and adaptation for all possible instabilities
ABM + Environment BASIC ANSATZ Fundamentalists dominate in the long run (? ) But in a complete model this may require evolution and adaptation for all possible instabilities
 External fluctuations affect all properties but mostly the estimate of the Fundamental Price Different Situation: if Fundamentalists are discouraged In a global crysis N* is strongly suppressed
 Back to Liquidity problem Liquidity: seems more important than volume or news for price changes Microscopic model for the order book & finite liquidity (crisis). This should be included in a realistic ABM
 the price evolution is") Order Book & ABM In a typical Agent-Based Model (ABM) the price evolution is a coarse-grained clearing/adjustment mechanism that does not take into account the liquidity of the market real markets Therefore we need to investigate the microscopic mechanisms for price formation in order to find β(g) Order book model
Order Book & ABM In a typical Agent-Based Model (ABM) the price evolution is a coarse-grained clearing/adjustment mechanism that does not take into account the liquidity of the market real markets Therefore we need to investigate the microscopic mechanisms for price formation in order to find β(g) Order book model
 ask bid") Order Book in a nutshell (Microscopic version of Farmer’s zero intelligence model) ask bid Δq Δp incoming limit order incoming market order spread s(t) best bid b(t) p(t) best ask a(t) ω V p a buy limitorder can be placed in the interval [-∞, a(t)] limit order bid può cadere tra [-∞, a(t)] a sell limit order ask be placed in the tra [b(t), +∞] limit order can può cadere interval [b(t), +∞]
Order Book in a nutshell (Microscopic version of Farmer’s zero intelligence model) ask bid Δq Δp incoming limit order incoming market order spread s(t) best bid b(t) p(t) best ask a(t) ω V p a buy limitorder can be placed in the interval [-∞, a(t)] limit order bid può cadere tra [-∞, a(t)] a sell limit order ask be placed in the tra [b(t), +∞] limit order can può cadere interval [b(t), +∞]
 Order Book regimes We can identify two different regimes in the order book dynamics Very liquid market • • Small price variations Behavior similar to a continuous system Illiquid market: discreteness • • Large price variations The discreteness of the system is crucial
 Price Impact Function p
 best bid b(t) p(t+1)-p(t) =") Liquid market ask bid Δp market order spread s(t) best bid b(t) p(t+1)-p(t) = fraction of a tick p(t) a(t) best ask a(t) 1) p(t+1) a(t+ V p
Liquid market ask bid Δp market order spread s(t) best bid b(t) p(t+1)-p(t) = fraction of a tick p(t) a(t) best ask a(t) 1) p(t+1) a(t+ V p
 V spread s(t) p(t) a(t) best") Illiquid market ask bid market order Δp b(t) V spread s(t) p(t) a(t) best bid b(t)p(t+1)-p(t) = several ticks best ask a(t) p a(t+1)
Illiquid market ask bid market order Δp b(t) V spread s(t) p(t) a(t) best bid b(t)p(t+1)-p(t) = several ticks best ask a(t) p a(t+1)
 can be considered as the response") Price Impact Function The Price Impact Function (PIF) can be considered as the response function of a stock, that is. . . If an agent submit a “virtual” market order of volume ω at time t, what will be the average price change at time t+τ? The Price Impact Function of real market is a concave function with respect to the order volume (Lillo, Farmer, Mantegna 2003) (J. P. Bouchaud et al 2004) Markets are not in a linear response regime
Price Impact Function The Price Impact Function (PIF) can be considered as the response function of a stock, that is. . . If an agent submit a “virtual” market order of volume ω at time t, what will be the average price change at time t+τ? The Price Impact Function of real market is a concave function with respect to the order volume (Lillo, Farmer, Mantegna 2003) (J. P. Bouchaud et al 2004) Markets are not in a linear response regime
 Price Impact Surface We want to study the role played by liquidity/granularity in price response but the normal PIF is calculated averaging on order book configurations with different liquidity/granularity We define the Price Impact Surface (PIS) which is instead a function of volume and liquidity/granularity where g is a measure of liquidity/granularity
 Price Impact Surface - 1 Model result for τ=400 and k=4 is concave as one measured in real order book
 Equity Market Impact Function: Different results ? ? ? • R. Almgren et al + F. Abergel (Paris): exponent = 0. 6 • Lillo, Farmer, Mantegna: exp = 0. 2 - 0. 4 • J. P. Bouchaud et al: log behavior Present Model: 0. 6 seems to be natural but prefactor is also important More Liquid >
 Price Impact Surface - 2 If we rescale the PIS with the average impact function that is proportional to we observe a quasi-collapse in a unique curve (in particular for small values of the order volume) Relation to ABM: Small N leads to more Sparse orders and more granularity. N dependent price formation Therefore the PIS can be approximately factorized as:
 Stylized Facts of Order Book
 Summary from ABM: Globalization - Social interactions - Network: New opportunities and New Risks. • Feedback, amplification, nonlinearity • Fat tails and Stylized Facts arise from finite size effect Nonuniversality leads to richer analysis tool • General sentiment vs direct links, effective N* • Network oriented approach - New indicators for a systemic risk approach - Microscopic data and network of mutual exposure. Contagion - correlations. • Trust: definition in math terms and more attention to people’s behavior, herding etc. • More scientific oriented tests - less ideology
 Key Concepts: TO IDENTIFY FROM REAL DATA • • • Market sentiment, stabilizing vs destabilizing The effective independent agents N* in a market Analysis of Herding, Contagion, Correlations Liquidity analysis of order book Network oriented approach - Direct interaction vs global Trust. • Coherence problem, similar behavior


