

87485b4f5e6bc4e48a9127b5f37fd0df.ppt
- Количество слайдов: 87
 Keys to Thriving Enrollments in the New Economy Oklahoma State Regents for Higher Education Conference on Enrollment Management February 23 2011, University of Oklahoma - Norman, Oklahoma Jay W. Goff Vice-Provost and Dean of Enrollment Management Missouri University of Science & Technology AACRAO SEM Coordinator for Four-year Colleges & Universities
 WHY ARE WE HERE TODAY? The external environment colleges and universities operate in is changing quickly • Dramatic changes in student markets • Public expectations for a wide variety of high quality student services • Shrinking government funding • Greater needs for an institution-wide understanding of how to best react to the emerging student trends, needs and markets
 Total Enrollment Fall 2000 - 2010 56% Enrollment Growth 7500 7206 7000 6815 6371 6500 6167 5858 6000 5602 5459 5500 5407 2003 2004 5240 4883 5000 4626 4500 4000 3500 3000 2001 2002 2005 2006 2007 2008 2009 2010
 Missouri S&T: 90% engineering, science & computing majors 17 th in Nation for Largest Undergraduate Engineering Enrollment 14 th in Nation for Number of BS Engineering Degrees Granted Top 20 for engineering degrees granted to females and minorities 3% 13% Engineering 3% Business & IST 5% Arts & Social Sciences 76% Science & Computing Non-Degree & Undecided
 2001 -2010 Enrollment Change 49% Increase in Undergraduates 53% Increase in Female Students 83% Increase in Graduate Students 124% Increase in Minority Students 43% Increase in Non-Engineering Majors Since 2005, 60% of Growth due to Increased Retention Rates 87% Retention Rate Achieved and Sustained 66% Graduation Rate Achieved Lower discount rate from +38% to 25% Generated over $24 M in additional net revenues
 7 Years of Strategic and Dramatic Changes in Rolla January 1, 2008 2007 2003 and 2007 2004 2001 to 2005 2002, 2004 & 2007 2003 2002 - 2006 2001 University Name Change Academic Reorganization by Eliminating Schools and Colleges Updated the Mission, Vision and Strategic plans Office of Technology Transfer and Economic Development New Student and Business Information Systems New ERP (People. Soft) and 3 New Homepages and Platforms Student Diversity Initiative The new goals resulted in three new units and champions: o Student Diversity Programs o Women’s Leadership Institute o Center for Pre-College Programs New School of Management and Information Sciences Center for Education Research and Teaching Innovation (CERTI) 12 NEW Degree Programs and 19 Certificate Programs, 128 hour limited for BS Engineering Degrees Administrative Restructuring and Formal Enrollment Management Program o Enrollment Management, o Distance and Continuing Education o Research and Sponsored Programs o Undergraduate and Graduate Programs
 Why Does Your Position Exist?
 Leadership Concerns Higher education leaders and national media: 1. What do recent economic upheavals mean to colleges and universities? 2. What are the fundamental issues facing higher education in the coming decade? 3. Do we face unprecedented long term economic circumstances and challenges? 4. What must institutions be doing today to respond to issues and challenges?
 What We Learned: Our fundamental challenges remain unchanged, but the urgency to address those challenges will be accelerated by economic necessity. Higher education as an industry will undergo transformations similar to those experienced by other industries over the last 50 years. Changes in technology and the global economy point toward solutions to these issues.
 Remember the Happy Pirate: Adjusting to Change & New Tools
 Keys to Thriving in the Future Moving Back to a Buyer’s Market
 Keys to Thriving Enrollments in the Current Economy: 1. Focus Communications on the Value and Outcomes of the Student Experience 2. Manage in a Business Like Fashion – Capacity Management 3. Push Retention Efforts to Implement Fundamentals 4. Beef Up Financial Aid Staff and Support 5. Support the New Majority: A Transfer Student Friendly Programs 6. Make Pre K-20 Planning and Programs a Fundamental Business Practice
 SEM Primer
 The Student Success Continuum The Enrollment Management Perspective Pre-College Outreach/ Recruitment / Orientation Marketing Classroom experience Co-curricular support Degree/goal attainment Student’s college career Admission Financial Aid Academic support Retention
 is “a comprehensive process designed to help") What is SEM? Strategic Enrollment Management (SEM) is “a comprehensive process designed to help an institution achieve and maintain the optimum recruitment, retention, and graduation rates of students where ‘optimum’ is designed within the academic context of the institution. As such, SEM is an institution-wide process that embraces virtually every aspect of an institution’s function and culture. ” Michael Dolence, AACRAO SEM 2001 Research Recruitment Retention
What is SEM? Strategic Enrollment Management (SEM) is “a comprehensive process designed to help an institution achieve and maintain the optimum recruitment, retention, and graduation rates of students where ‘optimum’ is designed within the academic context of the institution. As such, SEM is an institution-wide process that embraces virtually every aspect of an institution’s function and culture. ” Michael Dolence, AACRAO SEM 2001 Research Recruitment Retention
 Core Enrollment Principles No Enrollment Effort is Successful without QUALITY Academic Programs to Promote Recruitment and Retention is an On-going, Multi-year PROCESS with Strong Access to Research and DATA +80% of Enrollments Come from REGIONAL Student Markets for BS/BA Degrees The Most Successful Recruitment Programs Clearly DIFFERENTIATE the Student Experience from Competitor’s Programs The Most Successful Retention Programs Clearly Address Students’ Needs and Regularly ENGAGE Students in Academic and Non-Academic Programs
 Role of the Enrollment Manager “Enrollment leaders serve many roles throughout the change management process, such as that of a visionary, encourager, storyteller, facilitator, arbitrator, problem solver, manager and coach. ” Jim Black, AACRAO SEM 2003 EMs are Systems Thinkers Adept at Influencing Change
 Environmental Scan
 United States: Tied for 17 th Out of 22 OECD Nations in High School Graduation Rates 100% United States 80% 60% 40% 20% ed Lu en xe m Un bou rg ite d St at Ne e w Ze s al an d Sp ai n Tu rk ey M ex ico nd Sw la Ita ly Ice Gr ee c Ge e rm an y Ja pa n Ko re a No rw ay Ire Cz la ec nd h Re pu bl Sw ic itz er la n De d nm ar k Un Po la ite nd d Ki ng do m Hu Slo ng va ar k R y ep ub lic 0% Note: Data is for 2005 and refers to “percentage of upper secondary graduates to the population at typical age of graduation. ” Source: 2007 OECD Education at a Glance, www. oecd. org/edu/eag 2007.
 ite d S an tat es Fin la De nd nm ar No k rw ay Au str alia Ko rea Ice la Ne the nd rla nd s Be lgiu m Sw Un ed ite en d K ing do m Ire lan Sw itze d rla nd Spa Lux em in bo Ne w Z urg eal an d Fra nce Ge rm an y Gre ece Au str Hu ia nga ry Po lan d Me Slo xic vak o R Cze epu blic ch Re pu blic Ita Po ly rtu gal Tu rke y Un da 50 45 40 35 30 25 20 15 10 5 0 Jap na Ca Percent of Adults Ages 25 -64 with Associates Degree or Higher United States: 3 rd Out of 30 OECD Countries in Overall Postsecondary Attainment in 2005 United States (38%) Source: 2007 OECD Education at a Glance, www. oecd. org/edu/eag 2007.
 Attainment Trends
 Need for Completed Degrees in the US Assuming current rates of college attendance, persistence and “off shoring” do not change, analyst Anthony P. Carnevale concludes that by 2012 the U. S. will face a cumulative 10 -year shortage of: 850, 000 associate degrees 3. 2 million bachelor’s degrees 2. 9 million graduate degrees National Center for Higher Education Management Systems: - 55% of the population will need college degrees by 2025 in order to equal degree attainment in top-performing countries, a potential “degree gap” of 15. 6 million SOURCE: College Board 2008 “Achieving the Dream of America”
 Challenge: Changes in the College-Bound Student Markets The Midwest and Northeast will experience a 4% to 10% decline in high school graduates between 2009 – 2014 (WICHE) The profile of college-bound students is rapidly becoming more ethnically diverse and female dominant (NCES, WICHE, ACT, College Board) The number of students interested in engineering, computer science, and natural science degrees has declined to record lows (ACT, CIRP) More full-time college freshmen are choosing to start at two-year colleges (IPED, MODHE) More students are enrolling in more than one college at a time (National Student Clearinghouse) Future student market growth will include more students requiring financial aid and loans to complete a degree (WICHE)
 Heavy Competition for Students +4200 Colleges and Universities SOURCE: U. S. Education Department http: //chronicle. com Section: The 2007 -8 Almanac, Volume 54, Issue 1, Page 8
 Large Tuition & Fee Increases
 2011 -2017 3% to 8% Annual Declines in Traditional Students SOURCE: WICHE, 2008
 SOURCE: WICHE, 2008
 SOURCE: WICHE, 2008
 Enrollment Planning should be Global
 Look Beyond Business & STEM
 Female Enrollments Exceed 57% of All College Students SOURCE: NCES, The Condition of Education 2006, pg. 36
 76% of families would be “somewhat” or “very likely” to consider a more expensive institution if it could deliver greater value. SOURCE: Longmire & Company, Inc. 2009 “Study of the Impact of the Economy on Enrollment”
 2010 e-expectations report 46% claimed the current economic crisis caused them to reconsider the schools they would apply to or attend —an increase from 34 percent just last year. SOURCE: 2010 E-Expectation Report – Omni. Update/NRCCUA/Noel Levitz https: //www. noellevitz. com/NR/rdonlyres/52057241 -5 FD 7 -450 E 8399 -C 772 C 1 F 9 A 3 F 9/0/EExpectations_Focusing. Your. ERecruitment. Efforts_0710. pdf
 2010 e-expectations report 1 in 4 students reported removing a school from their prospective list because of a bad experience on that school’s Web site. · 92% would be disappointed with a school or remove it entirely from their lists if they didn’t find the information they needed on the school’s Web site. SOURCE: 2010 E-Expectation Report – Omni. Update/NRCCUA/Noel Levitz https: //www. noellevitz. com/NR/rdonlyres/52057241 -5 FD 7 -450 E 8399 -C 772 C 1 F 9 A 3 F 9/0/EExpectations_Focusing. Your. ERecruitment. Efforts_0710. pdf
 As college prices have escalated while family income growth has stalled, student debt has increased dramatically in recent years. SOURCE: College Board 2008 “Achieving the Dream of America”
 Large Growth in Students Loans SOURCE: U. S. Dept of Education, National Center for Education Statistics, National Postsecondary Student Aid Survey (1993 -2008).
 Private Student Loan Markets Expected to Boom
 1. Focus Communications on the Value of the Student Experience Demonstrate Quality related to: • Institutional Mission • Student Learning • the Public’s ROI
 “Governing boards and institutional leaders must move beyond the ‘iron triangle’ of seemingly conflicting choices – improving quality, increasing access, and yet constraining costs – toward a ‘culture of accountability. ’” § Moving Beyond the Iron Triangle, Arne Duncan, U. S. Secretary of Education, Trusteeship (Association of Governing Boards of Universities and Colleges), September/October 2009.
 Keys to Attracting and Enrolling Students 1. Sending the right message to the right students, at the right time, in the right format 2. The development and management of a multi-level prospective student communication plans 3. Consistently sending our messages through well- trained, committed, caring individuals across the campus 4. Having the appropriate resources to implement the plans
 Highest Yielding Enrollment Activities Campus Visit/Summer Camps § Over 70% of the students who visit campus or attend a camp apply § About 61% of these applicants enroll, so about 42% of our high school level camp attendees end up enrolling § 2009’s freshmen report that around 26% of the students attending at least one summer program Telecounseling § Increases students attendance at HS/CC visit, receptions & campus visitation Regular Communication/Relationship Development § Current communication plans provide contacts every 2 to 4 weeks from the end of the Junior Year to the April of Senior Year • General Plan: 14 to 18 contacts/communications • Minority or Women: 21 to 27 contacts/communications • Minority Women: 28 to 36 contact/communications
 Focus Communications on Outcomes and Value 1. We’re one of America’s top technological research universities. 2. Our students get great jobs at great salaries. 3. Our students graduate with the ability to address real-world problems. 4. We’re one of America’s “ 30 safest campuses. ” 5. S&T is one of the top 10 “best value” national public universities.
 Over 600 Corporate Partners and Hiring Organizations
 Career Success for Grads 3 -year Averages Midwest’s Largest Career Fair - Over 660 Companies recruit on campus: § +4, 250 on-campus interviews - Average starting salary for graduates at commencement: § over $57, 300 - Over 500 students completed a co-op or internship for +160 companies around the world § $2, 650 average monthly co-op salary § $2, 875 average monthly internship salary - 90% of grads have secured firm plans at graduation - Mid-career average salary for all graduates: § $95, 200 (Payscale. com, August 2009) - Many top corporations, such as Shell Oil, Caterpillar, Toyota and Boeing list Missouri S&T as a “Top 20 Key School” for finding their future leaders
 Promote Learning Objectives Where Innovation Is Tradition
 Emerging Trends § Ability to clearly explain the value of our programs to all stakeholders: Use accreditation material in all communications § Promoting success stories with regard to access, and affordability and outcomes for individuals and society § REMEMBER: The public is inclined to support costs associated with maintaining program quality and rigor when paired with sound management practices including appropriate efficiencies
 2. Manage in Business-like Fashion Capacity Management and Diversifying Revenues in the Context of an Institutional Business Model
 Guiding Philosophy at George Mason University “An institution of higher education should not be run like a business, but it should be run in a business-like fashion. ” - Alan Merten, President, George Mason University
 Paradigm Shift Measuring quality based on educational outcomes instead of spending per student.
 Capacity Task Force Charge Assess whether the student population was at, below, or above the university’s capacity to provide each student with a quality education.
 Defining Capacity Educational capacity is a complex management issue and incorporates many variables for any college or university Capacity ultimately is a planning and quality assurance concept. Generally defined: – “Educational capacity is the university’s ability to receive, enroll, house, feed, and properly educate students in an appropriate time period. ”
 Key Factors in Determining Capacity Quality Teaching and Learning Enrollment and Research Growth Teaching Loads & Instructional Faculty Numbers Instructional and Laboratory Space Student Financial Assistance Resources Student and Campus Support Resources Housing, Dining and Parking Volume
 Emerging Trends § Colleges and universities need to know their true service capacity § Understand your institutional business model and what activities specific revenue streams are supporting. Be prepared to explain how tuition and student fee revenues directly benefit activities with which students are engaged § Develop revenue sources other than tuition revenue to supplement research, public service an other non-instructional activities
 3. Push Fundamental Retention Programs Implement Fundamental Structures and Improve Engagement from a Student/Family Perspective
 Fundamental Student Retention Conclusions 1. Financial aid helps increase persistence for students who need and receive financial aid. 2. Student populations will historic persistence problems § Older students § African Americans & Hispanics § Students who work more than 30 hours weekly, and § First generation college students 3. Schools can improve retention rates by: § Accurately determining when and why students withdraw § Up-to-date information helps administrators determine better strategies for increasing retention rates SOURCE: DANA Center Retention Report, 1998
 Financial Considerations the Most Common Reason for Leaving College SOURCE: ELS: 2002 “A First Look at the Initial Postsecondary Experiences of the High School Sophomore Class of 2002 (National Center for Education Statistics)
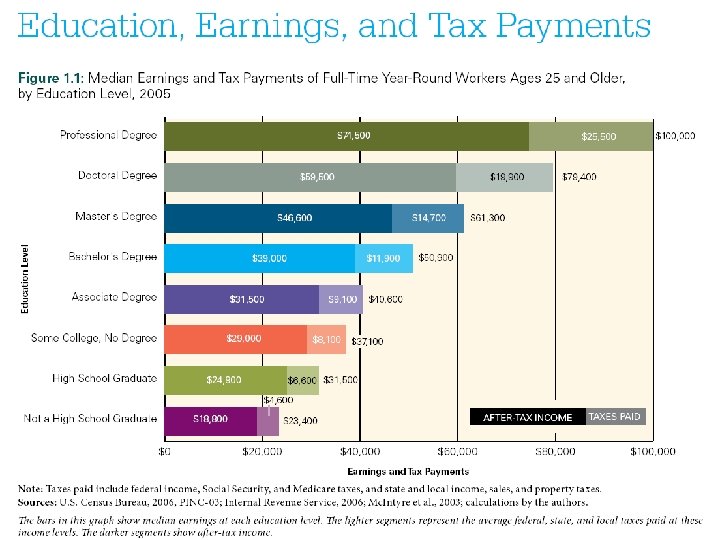
 Income and Attainment
 Identifying Interests of Incoming Students: Ability to Scale Student Services 2500 2000 1500 1000 High School College 500 ba te De ns ica tio Pu za ga ni O r bl tio n TV o/ ice rv r te ea Ra di Se er ov t G en Th nm en t ics et th l St ud Va rs ity A hl A t al m ur In tra Ba nd /M us et ic s ic 0 SOURCE: ACT’s AIM 2008
 Incoming Students’ Self-Identified Interests and Needs 1400 1, 348 1300 Help with Writing 20% 1, 259 1, 233 1, 232 1, 205 1, 204 1200 1, 163 Help with Math Skills 16% 1, 128 1, 112 1100 Help with Reading 23% 1, 024 1, 004 1000 977 988 995 879 880 738 733 Help with Study Skills 20% 910 908 900 1, 011 1, 009 992 863 839 805 800 772 771 Want to Study Abroad 26% 764 754 700 2003 2004 2005 2006 2007 2008 SOURCE: ACT’s AIM 2008
 Fundamentals of Effective Retention Programs: 1. 2. 3. 4. 5. 6. 7. 8. Designate a visible individual to coordinate a campus-wide planning team Conduct a systematic analysis of the characteristics of your students Focus on the nexus of student characteristics and institutional characteristics Carefully review the high impact strategies identified in through the survey Do not make first to second year retention strategies the sole focus of planning team efforts Establish realistic short-term and long-term retention, progression, and completion goals Orchestrate the change process Implement, measure, improve! SOURCE: ACT’s What Works in Student Retention, 2004
 Emerging Trends 1. Have an executive level leader, clear goals based on benchmarks and designated funding for improving retention 2. Build retention goals into the strategic plan and employee performance contracts 3. Have a standing executive committee to examine retention issues 4. Following-up with leaving students after the fourth week to reduce attrition rates and increasing the “stop-out” levels 5. Centralized unit to provide communications and support for students’ families.
 4. Beef up Financial Aid Staff and Support Redefining the role of the Financial Aid Counselor Embracing Transparency of Total Cost of Attendance
 Large Increases in Requests for Aid 74% of schools saw an increase in their FAFSA applications Large differences among the various school types: 7% of private colleges and 13% of public colleges saw their FAFSA filings rise by over 20% Over 1/3 of proprietary schools saw a similar increase. One other point here is that overall, SOURCE: NAFSA survey of 3, 300 colleges/universities, Sept. 2009
 Importance of Financial Aid in College Choice 90% of prospective college students consider financial aid an important factor influencing their college choice. SOURCE: Education Dynamics 2010
 Factors Most Noted in Choosing a College Majors & Career Programs Offered Location/Campus Characteristics Cost/Affordability Campus Size/Safety Characteristics of Enrolled Students Selectivity
 Average Student Borrowing is on the Rise SOURCE: Measuring Up, 2004 and 2008 databases. Includes subsidized and unsubsidized Stafford and PLUS loans made to students and parents.
 Percent of New Students for Whom Financing was a Major Concern 1992 -93 to 2006 -07 CHART SOURCE: CIRP & College Board, 2007
 Emerging Trends 1. Expanded FA staff to handle large increases in aid 2. 3. 4. 5. request (FAFSAs) and Special Circumstance Appeals Creation of Student Loan Specialist Positions Dedicating 10% to 20% of fee Increases towards Need -Based Aid Extended training for admissions / recruitment staff to counsel families on financial planning and options Capital Campaigns Solely Focused on Raising Need. Based Aid
 5. Support the New Majority: Transfer Students A Transfer Student Friendly Programs Align Institutions, Degrees and Processes
 Emerging Trends 1. Designated staff to support transfer students 2. Advising staff training to properly place students with increasing amounts of transfer credit 3. Compartmentalizing Degrees - Moving beyond program to program articulation: creation of sets of associate degrees and UG certificates designed for transfer in different fields. These include general education and defined courses by learning objectives to meet major requirements
 6. Pre K-20 planning and programs as a Fundamental Business Practice A Primary Key to Increasing the College Going and Matriculation Rates
 The Role of Parents & Communications 90% choose their child‘s colleges on the web 82 % plan to play a pivotal role in helping their children make the final decision about college 17% entrust their child to make that decision independently SOURCE: Circling Over Enrollment: The E-Expectations of the Parents of College-Bound Students, 2009
 Base Year of the Educational Longitudinal Study of 2002, U. S. Department of Education, National Center for Education Statistics, 2005.
 Increasing the college going rate is key WICHE, 2008
 More than 30% of College Freshmen Need Remedial Courses PARTICIPATION IN REMEDIAL EDUCATION: Percentage of entering freshmen at degree-granting institutions who enrolled in remedial courses, by type of institution and subject area: Fall 2000 NOTE: Data reported for fall 2000 are based on Title IV degree-granting institutions that enrolled freshmen in 2000. The categories used for analyzing these data include public 2 -year, private 2 -year, public 4 -year, and private 4 -year institutions. Data from private not-for-profit and for-profit institutions are reported together because there are too few private for-profit institutions in the sample to report them separately. The estimates in this indicator differ from those in indicator 18 because the populations differ. This indicator deals with entering freshmen of all ages in 2000 while indicator 18 examines a cohort (1992 12 th-graders who enrolled in postsecondary education). SOURCE: Parsad, B. , and Lewis, L. (2003). Remedial Education at Degree-Granting Postsecondary Institutions in Fall 2000 (NCES 2004– 010), table 4. Data from U. S. Department of Education, NCES, Postsecondary Education Quick Information System (PEQIS), “Survey on Remedial Education in Higher Education Institutions, ” fall 2000.
 Schools Need to Identify Current Programs that Address Traditional Transition Barriers 1. Lack of Early Childhood Education 2. Quality of Teacher Preparation 3. Curriculum Alignment 4. Culture of K-12 Education: Low Expectations 5. Lack of Community and Industry Involvement in Schools 6. Effective Use and Integration of Technology 7. Proper Collection and Interpretation of Data 8. Lack of Understanding College Readiness 9. Proper Assessment Systems and Longitudinal Data 10. Capacity and Quality of Educational Leadership 11. Mental Health Issues 12. Math and Science Education 13. Literacy / Communication Skills 14. Guidance Counseling 15. Parental Involvement (Lack of) 16. Money and Finances 17. General Information on Colleges 18. Lack of Role Models or Mentors 19. Physical Health Related Issues
 Potent Key Points to Identify Pre-Kindergarten: 22% of US 4 -year-olds are Enrolled in Preschool Programs; Only 3% of 3 -year-olds are Enrolled 4 th GRADE: Math and Science Reading Needs to be at Textbook Level (5 th grade) 8 th GRADE: Only 2 of 10 Eighth Graders Ready for a College Prep High School Curriculum 12 th GRADE: Less than 60 % of high school graduates enroll in Post-Secondary Education within One Year of High School Graduation
 Identify Existing Barriers and Support Along the Student Pipeline Student Lifecycle Barriers / Problems Elementary School Pre K K Type of Support 1 2 High School Middle School 3 4 5 6 7 8 9 10 College/University - Undergraduate 13 - 12 - HS certific 14 - 11 Diploma ate AA/AS 15 University – Graduate/Professional School 18 - 19 - 20 - 16 - 17 - MS/MA/MFA Ph. D/M BS/BA Grad /MBA/JD D D
 SAMPLE: S&T’s Pre-College Programs by 2008, 26% of S&T’s freshman class attended an on-campus pre-college program Summer Programs 1 2 3 4 5 6 7 8 9 10 11 12 C Camp Invention (1 week) R Aerospace Camp (4 days) R Robotics Camp (3 days) R Missouri Academy for Youth Advancement (MAYA) (1 month) R It's A Girl Thing! (3 day) R Summer Solutions (girls) (1 week) R Summer Research Experience R Summer Research Academy R Summer Transportation Instit. (1 month) R Business Tech Week R Jackling Introduction to Engineering (1 week) R Minority Introduction to Technology & Engineering (1 week) R Nuclear Engineering Camps (1 week) R C. H. I. P. Camp Computer Highly Interactive Program (4 days) R Materials Camp (1 week) R Explosives (1 week) R Hit the Ground Running (3 weeks) College Freshmen
 Emerging Trend for P-20 Strategies 1. Produce an inventory of initiatives and their outcomes related to pre-college pipeline efforts (pre-kindergarten through 12 th grade) that help prepare students to succeed in college and their careers 2. State-wide P-20 initiatives to improve college readiness and going rates 3. Outreach activities that emphasize reading
 Summary Thoughts
 “We are what we repeatedly do. Excellence, therefore, is not an act but a habit. ” -Aristotle
 Focusing on SEM Basics It is all about working collaboratively to help more students succeed Embrace the Principles of Change Management Do not ignore the data – we must identify the problems first New tools will be needed for future success
!") Learn how to use your new hook(s)!
Learn how to use your new hook(s)!
 Keys to Thriving Enrollments in the New Economy Jay W. Goff Vice-Provost and Dean of Enrollment Management Missouri University of Science & Technology Rolla, Missouri, USA 573 -341 -4378 enrollment. mst. edu goffjw@mst. edu AACRAO: http: //aacrao. org/