d8060d59007927e58fb5cd5d320cf03a.ppt
- Количество слайдов: 50

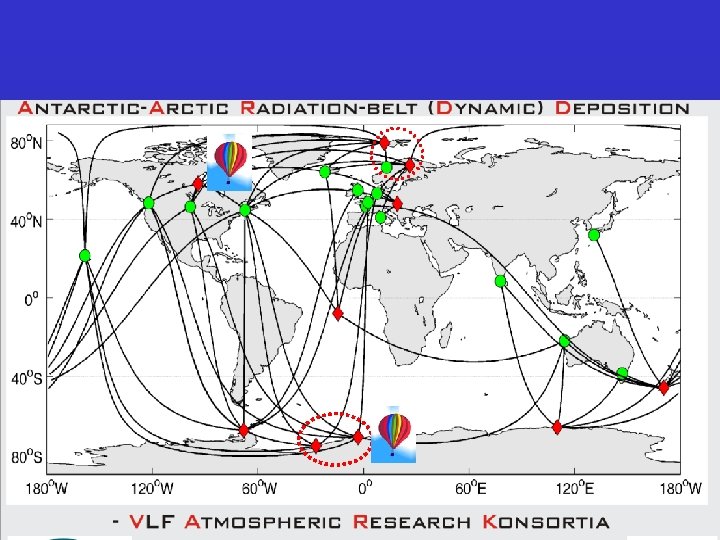
 Israel South Africa Antarctica New Zealand

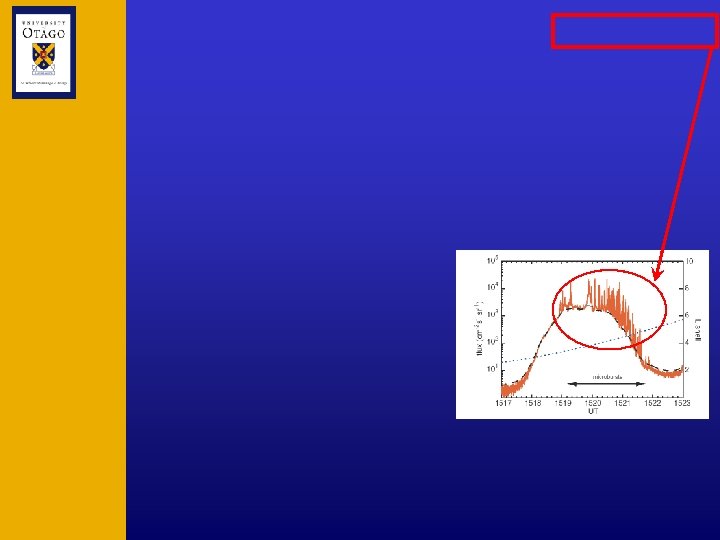

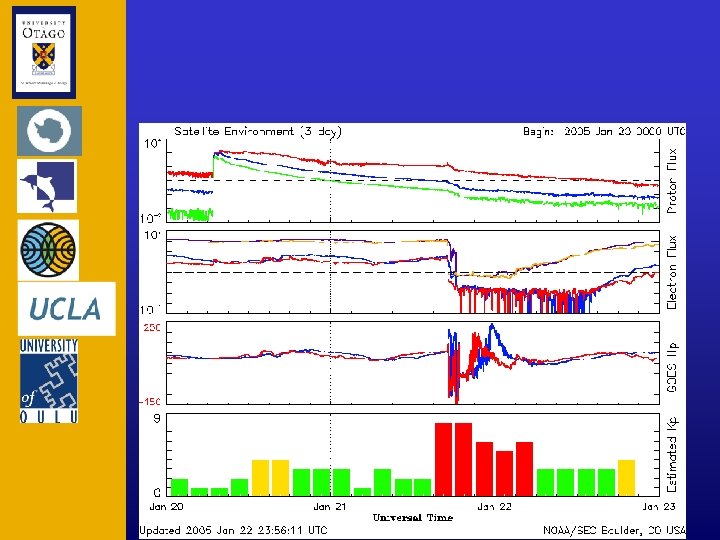
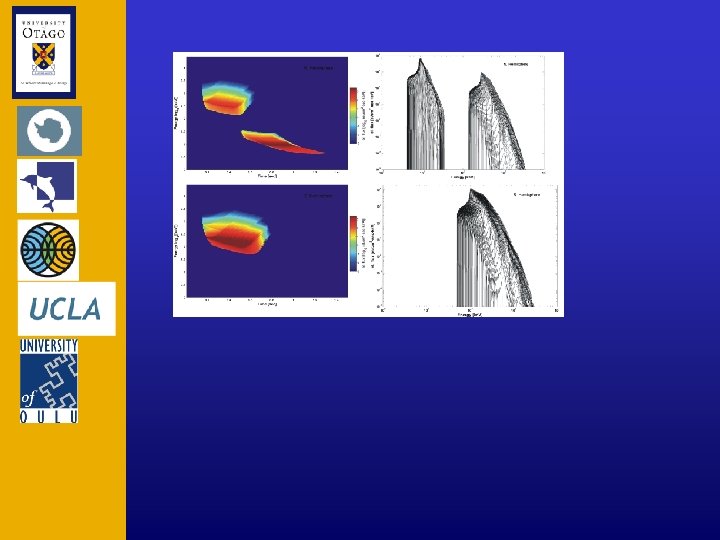
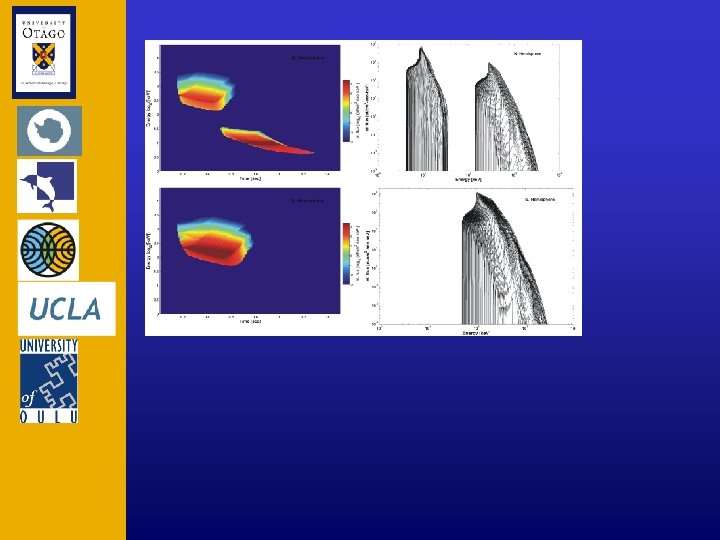


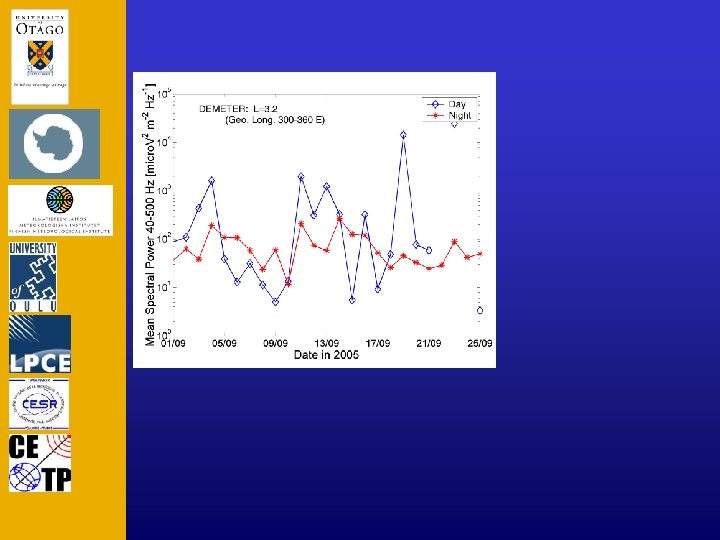
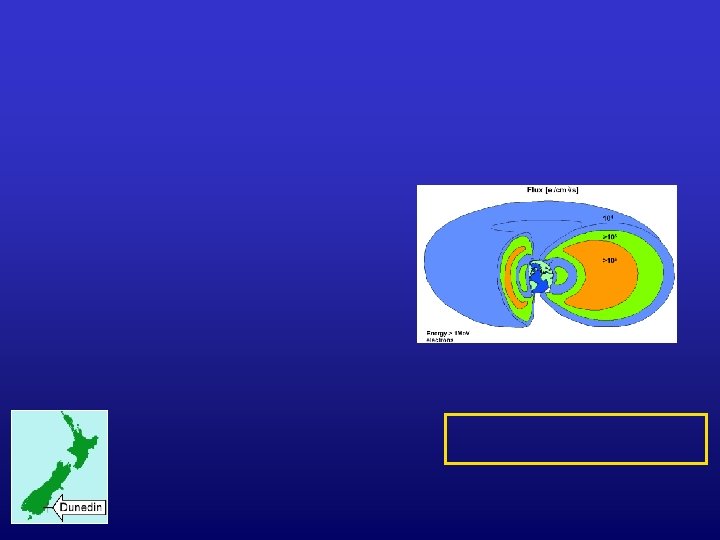
 Geomagnetic storm of 11 Sept 2005 led to an increase in the energetic electron population in the inner edge of the outer radiation belt 1000 times ambient 100 above pre-storm levels decays over ~14 days to pre-storm levels (and 5 times above ambient), after which there is a DEMETER data-gap
 NOTE: CRRES shifted to fit DEMETER fluxes Hardening in electron spectra seen by the low-Earth orbiting DEMETER in drift-loss cone is consistent with that seen by CRRES near the geomagnetic equator in June 1991. We represent the spectra by the fitted power law shown.
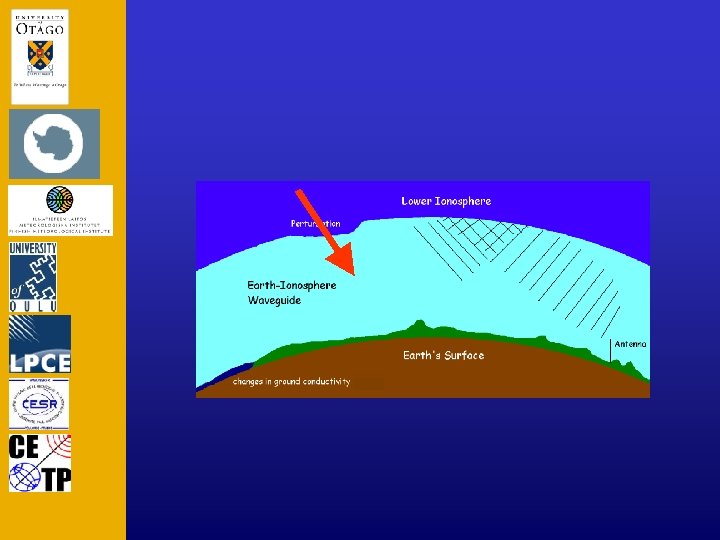
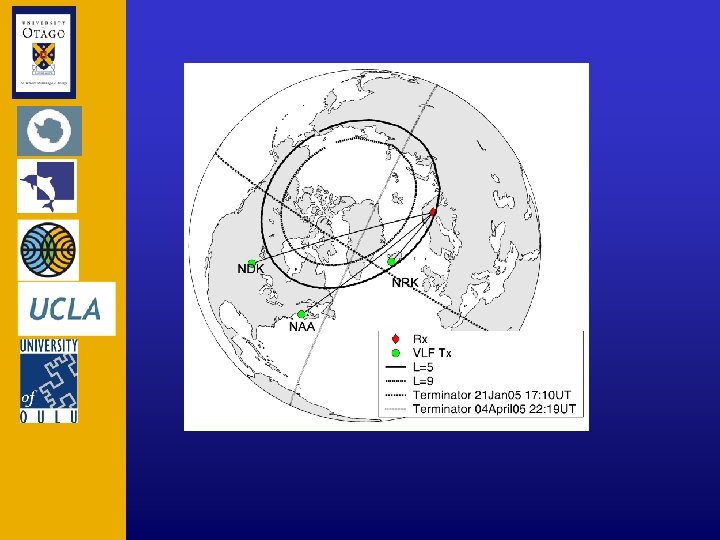
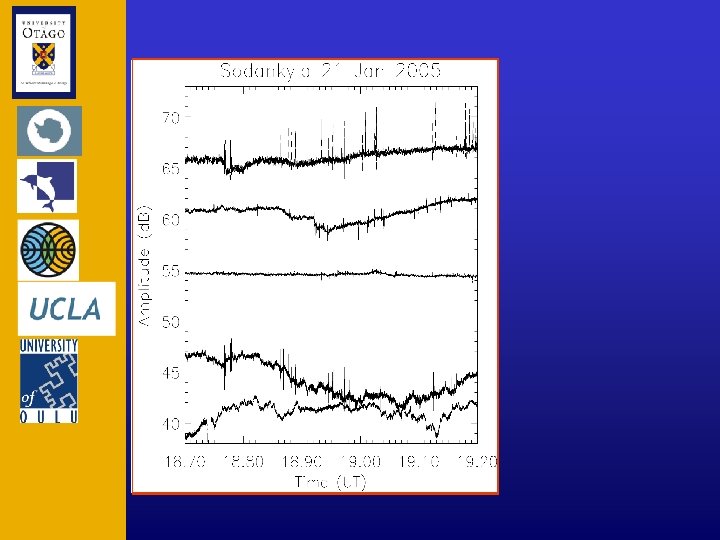
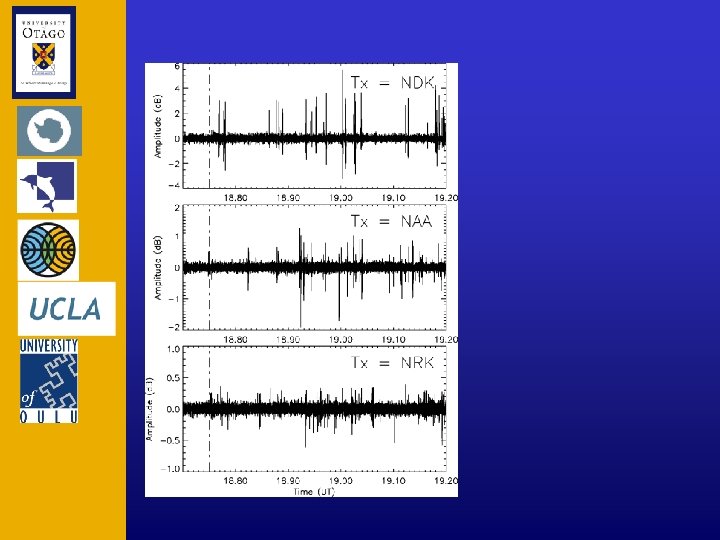
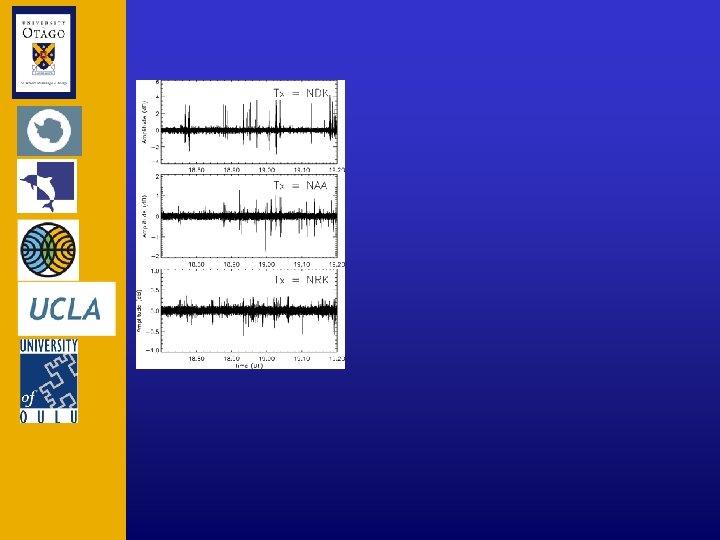
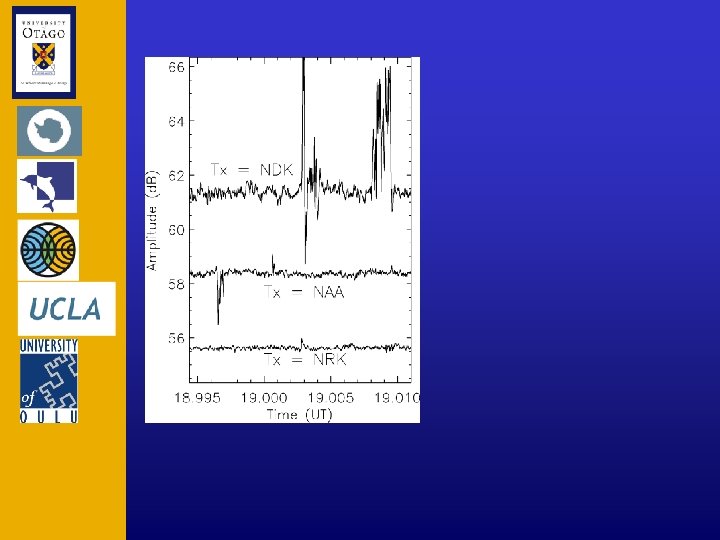
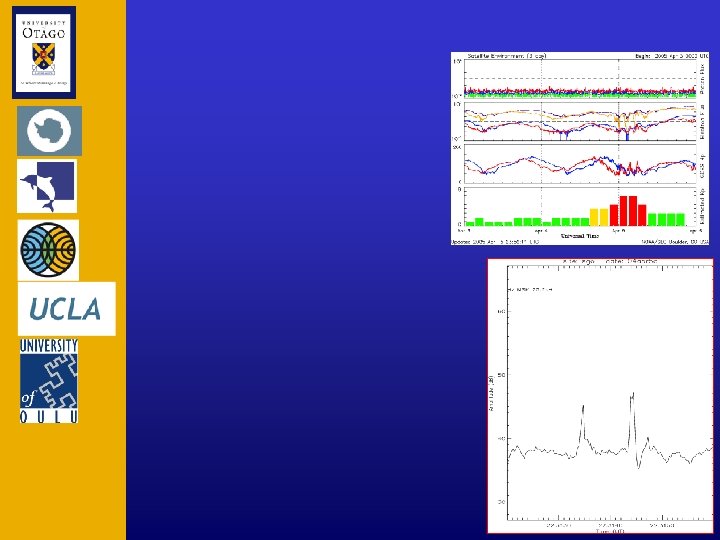
 NYA, Ny Ålesund SGO, Sodankylä NAA, 24 k. Hz 600 k. W CAM, Cambridge From 1 September 2005 we undertook subionospheric observations of NAA from our 3 European AARDDVARK receiver sites.
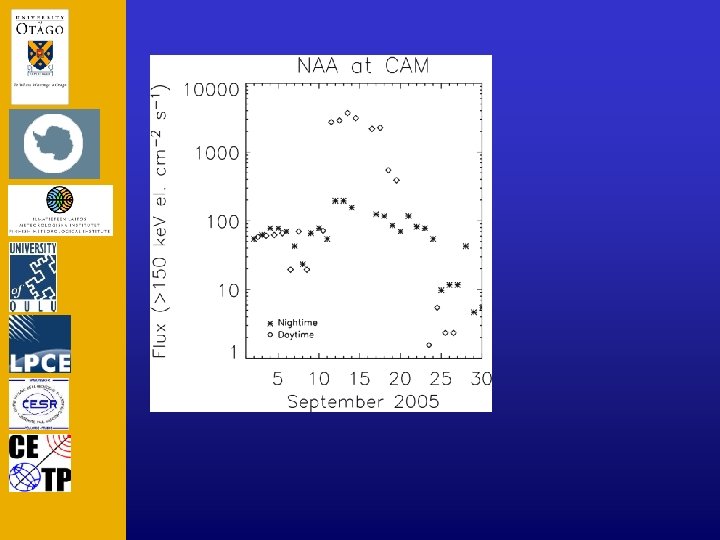
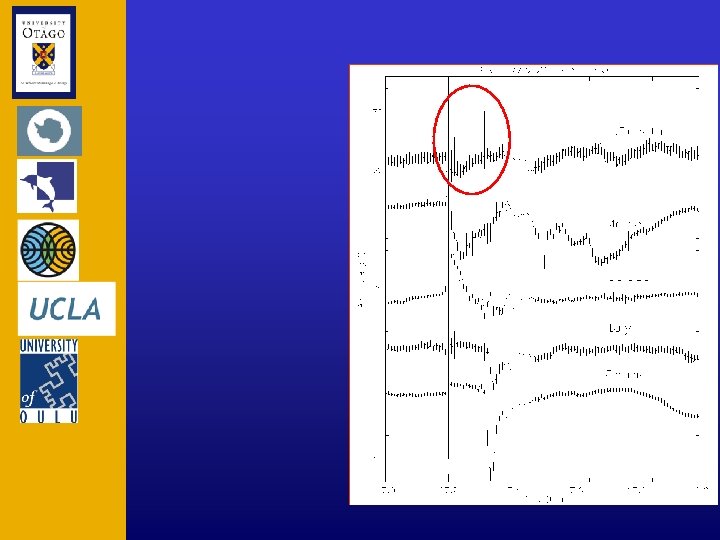
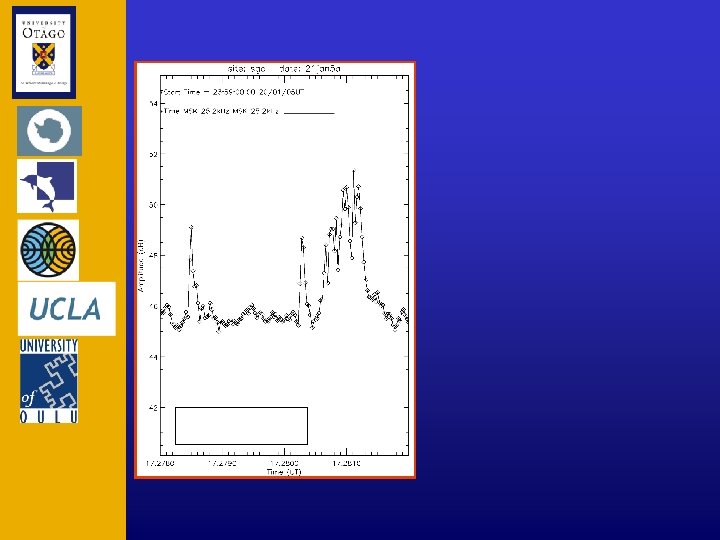
 Dominated by Solar Proton Event line = SPE Solar Proton Event and something else? Must be precipitation from RB (too low L for protons) Change in NAA at CAM due to energetic electron precipitation: 14± 1 d. B decrease at Midnight 2. 4± 0. 3 d. B increase at Midday
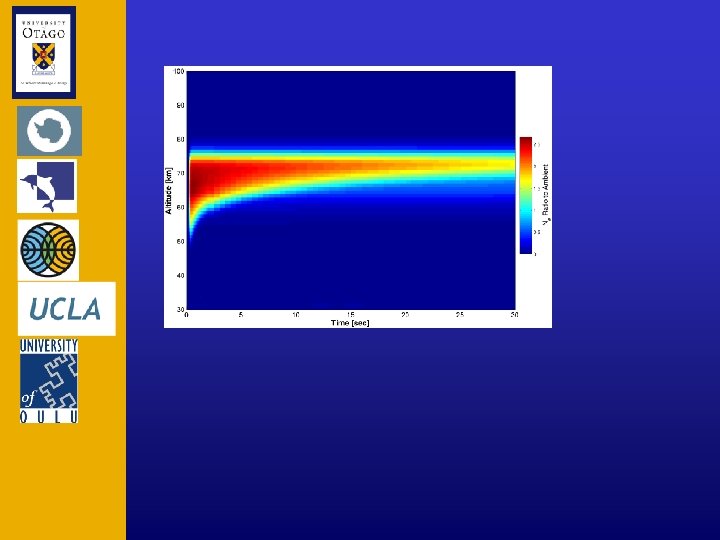
 HENCE predict expected change in amplitude for a given precipitation along our NAA-CAM path.