324a028fc358995e96dfaf701f477f2d.ppt
- Количество слайдов: 190

Israel and the World Economy: Power of Globalization Assaf Razin May 2, 2017 Graduate Institute GENEVA

Israel and the World Economy: Power of Globalization The Israeli economy, a remarkable development- success story, provides a counter example to the current anti-globalization arguments. I present an economic-history perspective of Israel’s long struggle with inflation and of Israel’s unique immigration story.

Book’s Table of Contents Part 1—Historical Background Chapter 1: The Rise and the Conquest of High Inflation Chapter 2: Immigration Wave: Soviet. Jew Exodus Chapter 3: Understanding Migration and Income Inequality

Part 2—Globalization, Disinflation, and Financial Regulation Chapter 4: The "Great Moderation" and Israel's Disinflation Chapter 5: The 2008 Global Crisis and Israel-Economy Resilience

Part 3—Information. Technology Surge Chapter 6: Technology Transmission through FDI Chapter 7: Israel High Technology and Globalized Finance

Part 4 -- Trending Developments Chapter 8: East Asia Rises Chapter 9: Israel’s Exports Rerouted Chapter 10: Immigration Policy of Advanced Economies Enabling Brain Drain from Israel Chapter 11: High Fertility and Low Skill Acquisition Chapter 12: Costs of Occupation Prologue

Israel Triumph over Inflation, and Its Resistance to Depression Forces Chapters 1 and 4

Inflation: Scope and Coverage 1. Early acceleration to three-digit levels, lasting 8 years, generated by populist government; 2. Credible stabilization program, based on political backing triggered sharp fall in inflationary expectations, and consequently to sharp inflation reduction to two- digit levels; 3. Convergence to the advanced countries’ levels during the “great Moderation”; 4. Resistance to the deflation-depression forces that the 2008 crisis created.

High Inflation accelerated starting in the 1977 and Stabilized in 1985: CPI Inflation, 1969 -1993, % 400 350 300 250 200 150 100 50 Source: BOI 3 19 9 1 19 9 9 19 8 7 19 8 5 19 8 3 19 8 1 19 8 9 19 7 7 19 7 5 19 7 3 19 7 19 6 9 0

Political Background for Macro. Populistic Policy • The newly elected government abruptly switched away from a long-running economic regime, which had been able to maintain fiscal discipline in the presence of strong external shocks (the Yom Kippur War and the first Oil Crisis). • The economic crisis started to develop when the opposition “Gahal” (now “Likkud”) party gained power for the first time since independence. The political upheaval in 1977, the so-called “Maapach”, was a game changer for economic policy in Israel.

Macroeconomic populism Dornbusch and Edwards (1989) define populism as policies that are favoured by a substantial part of the voting population, but which ultimately harm the majority of the population.

Economic-Regime Switch • The pre-MAAPACH economic regime had pegged exchange rate, capital controls, and fiscal discipline. • The post-MAAPACH regime eased capital controls without putting regulatory safeguards, relaxed fiscal discipline and allowed accommodative monetary policy.

A country can only achieve two of three goals: Monetary Autonomy, Exchange Rate Stability, and Capital mobility. She can choose only twq. Post Maapach Cha Regime: Moving in Triangle Down

Populism: “sugar high” Stage In the First Phase after their policies are enacted, the populists are vindicated. The surging government spending and mandated wage hikes tend to produce a temporary “sugar high”, followed by a crash.

Populism’s: Sobering Stage Beneath the surface, however, the country’s economic potential is deteriorating and inflation accelerates. Financial disorders appear. Populist leader recommits to harmful policies and steers the country towards decline, capital flight, and sometimes debt crises.

Economic Activity During the Inflation Crisis • Economic activity severely impacted by swelling credit frictions Output Growth and Unemployment, 1977 -1986 8% 6% 4% 2% -1% -3% 1977 1978 1979 1980 1981 1982 GDP per capita growth (annual %) Source: ICBS, World Bank 1983 1984 1985 Unemployment Rate 1986

The Inflation-Generating Populism • Budget deficit explosion. • Relaxation of BOI commitment to peg the exchange rate at a certain level. • Relaxation of Capital and Prudential Controls.

The Conquest of High Inflation Source: BOI

Populism Relies on Seigniorage • Failing economic governance made it essential for the government to raise revenue through money expansion. • The fast-expanding government spending and transfer were financed by the printing press. • But, how much seigniorage revenue (the profit made by a government by issuing currency) will the inflation-induced money creation generate?

Seigniorage through Inflation Spike Calvo (2016) writes: “An inflation spike is, in the short run, one of the cheapest and most expeditious manners for securing additional fiscal revenue. Moreover, this "carrot" is always there. As noted, though, a problem arises if the government repeatedly reaches out for the carrot. However, even in this case, the evidence presented in Friedman (1971) does not prove that authorities were making an error. ”

Friedman Irrelevant Steady State Calculations Necessary condition for maximization of seigniorage revenue across steady state is that the inflation rate is equal to one over the semi-elasticity of demand for money. This Laffer point is significantly below the rates in high inflation episodes.

Populism’s Monetized Budget Deficit leads to Balance of Payment Crisis Because of the steadily worsening fiscal imbalances, the central bank’s domestic assets grow s. Because of perfect capital mobility, the domestic interest rate is determined through the interest rate parity, as follows:

International Reserves and Exchange Rate Exchange rate regime switches with Speculative Attack:

Time Inconsistency Makes Inflation Stabilization Less Likely to Occur •

Effects of Expectations •

Effects of Expectations: Real Value of Public Debt •

Inflation Stabilization: The Politics • Following almost 8 years of the hyperinflation economic chaos, the Israeli voters brought about some major political rebalancing towards the political center. • The newly established Unity Government (“Likkud” plus “Avoda”) implemented successfully key stabilization measures; all of them required political consensus.

Inflation Stabilization Must Involve Income Redistribution To overcome this difficulty there must be a fullfledged social agreement between the government, savers (who hold government bonds), public sector wage earners, and recipients of food subsidies. To fix the inflated outlays on debt service, wage bill, and subsidies, some major redistribution of income must accompany the inflation-halting step. A Tri-Party agreement between the government, the Federation of Labor (“Histadrut”) and the association of private-sector employers stabilized the wage-price dynamics and enabled a sharp nominal devaluation that ended in a competitiveness-

Institutional Features of Stabilization Policy • A new legislation (“Khok Hahesderim”) allowed the government to exercise tighter control over its spending and taxation. • A new law forbade the Central Bank to monetize the budget deficit (“Khok Iee Hadpassa”), and ended the accommodating monetary policy.

The No-Printing Clause—The Seed for Israel’s Central Bank Independence The 1985 Israel inflation stabilization package included the non- printing item, preventing the Bank of Israel to purchase from the treasury directly government treasuries: “Chok Iee Haadpasa”.

Policy Credibility: Key to Success Sargent (2009) argues that high inflation can be stopped quickly, if inflationary expectations are consistent with a credible stabilization program. His argument is that inflationary expectations are quick to adjust when the economic regime credibly shifts. Israel’s expectations-changing episode is akin to Volcker-policy effect on inflationary expectations in the US, see Sargent (1999).

Israel’s Quick Adjustment of Inflationary Expectations Cukierman (1988 b) reports that expect for a brief period, when the public feared that the government will not be able to prevent the initial large one-shot (policy-induced) price shock from spreading, inflationary expectations started to decline sharply and steadily within months after the implementation of the 1985 stabilization policy. Six months later there was no significant difference between actual and expected inflation.

Eradicating Inflation: The Benefits of Globalization

“Great Moderation” and Globalization A wave of globalization took place in the 1990 s after the collapse of communism and the openness acceleration in China. The 1992 single-market reform in Europe and the formation of the euro zone were watersheds of globalization. The globalization wave has swept emerging markets in Latin America, European transition economies, Emerging markets, including China and India, likewise became significantly more open.

The “Great Moderation” US Trend Deviations of Unemployment and Bond Yield Spread, 1953 -2014, standard deviations. 0. 6 0. 4 The Great Moderation Period 0. 2 0. 0 -0. 2 -0. 4 -0. 6 Unemployment Spread '53 '56 '59 '62 '65 '68 '71 '74 '77 '80 '83 '86 '89 '92 '95 '98 '01 '04 '07 '10 '13 Source: FRED, BLS, an extension to Eckstein, Setty and Weiss (2015) Notes: Detrended unemployment rate obtains through HP-filter, in SD. Bond yield spread is defined as the difference between two things: 5 -Year Treasury Constant Maturity Rate, and Moody's Seasoned Baa Corporate Bond Yield, HP filtered, in SD.

Decline of World inflation Global inflation declined from 30 percent to 4 percent between 1993 and 2003.

Why Did Inflation Rate Fall During the 1990 s? • A hypothesis, which Rogoff put forth, is that “globalization—interacting with deregulation and privatization—has played a strong supporting role in the past decade’s (i. e. , the 1990 s) disinflation. ” • A contributing factor for the moderation also is the increasing independence of central banks.

Globalization: Measurs of International. Financial Integration

Israel Globalizing Real Interest Rate Adjusted for Real Exchange Rate Changes (US benchmark) 1. 40 1. 30 1. 20 UK Israel 1. 10 1. 00 Germany Canada 19 88 19 90 19 92 19 94 19 96 19 98 20 00 20 02 20 04 20 06 20 08 20 10 20 12 20 14 20 16 0. 90 USA (real exchange rate) Source: Stats Bureau, FERD, World Bank, Real-exchange-rate adjusted, yields on three-month government bonds for Israel, Canada, Germany and the United Kingdom, and the yields on three-month US government bonds.

Convergence of Inflation Rates Figure 4. 1 shows the convergence of Israel inflation rate to US, Germany and OECD rates. Inflation Rates (Annual GDP Deflator, percentage) 28 Israel 23 18 OECD members 13 United States 8 Canada Germany 3 Source: The World Bank 96 19 97 19 98 19 99 20 00 20 01 20 02 20 03 20 04 20 05 20 06 20 07 20 08 20 09 20 10 20 11 20 12 20 13 20 14 95 19 19 94 93 19 92 19 91 19 90 19 19 89 19 19 88 -2

Drivers of Domestic Inflation: Through the Lance of the Phillips Curve The price of imports and the exchange rate; Capacity pressures and labor market tightness in the domestic economy; Public expectations about future inflation, future exchange rates, and future foreign prices; The amount of world economy slack; The level of foreign wages are also important for countries open to immigration.

Globalization Flattens the Phillips Curve— Inflation Falls • With perfect mobility of labor, capital, and goods, the log-linear approximate aggregate supply curve (Phillips Curve) is given by:

•

Inflationary Expectations (Derived from Financial Markets) and the Rate of Unemployment, 19902016 -1990 2001 2002 -2011 Inflation -20162012 Unemployment

2008 Global Depression and Israel’s Resilience

Capital Market Resilience: Portfolio Capital Outflows from the US Figure 5. 8 describes the portfolio capital outflows from the US to selected countries. Israel is in the middle of the pack of countries that enjoy inflow of portfolio capital investments in the aftermath of the 2008 global financial crisis. Portfolio Flows, Crisis Economies (Index, Dec 1994 = 100) 8000 6000 Portugal 4000 Israel 2000 0 -2000 -4000 Chile Greece Spain -6000 1994 1996 1998 2000 2002 2004 2006 2008 2010 2012 2014 Source: Anusha Chari

Growth during the Crisis Figure 5. 6 shows that among similar small open economies Israel's GDP grew over the recent 20 years, including the 2008 -2010 period at a similar cumulative rate as Chile; but at a much higher rate than Greece, Spain and Portugal; which had a financial sector crash. Real GDP, Israel and Selected Countries (Jan 2003 = 100) 170 160 150 140 130 120 110 100 90 80 70 Chile Israel Switzerland Canada Norway Spain Portugal Greece 94 19 96 19 Source: FRED 98 19 00 20 02 20 04 20 06 20 08 20 10 20 12 20 14 20

GNP Levels Figure 5. 7 depicts GNP levels for Israel, Turkey, Brazil and Canada; economies, which spared financial, sector crash. Israel exhibits a more moderate drop of output than all these countries. Real GNP, Countries with No Financial Crisis (January 1998 = 100) 180 [SERIES NAME] 160 [SERIES NAME] 140 Canada 120 Brazil 100 19 96 19 97 19 98 19 99 20 00 20 01 20 02 20 03 20 04 20 05 20 06 20 07 20 08 20 09 20 10 20 11 20 12 20 13 20 14 80 Source: FRED

Creditor protection and Resistance Creditor rights index (CRI) compiled by Djankov et al. (2007). This is a panel that covers 129 countries for 1978– 2008. The CRI ranges from 0 to 4, with a highernumber associated with better protection for creditors. Israel is among the Creditor rights index = 3 countries, grouped together with Germany and Australia. Italy, and Norway, is among Creditor rights index = 2 countries. Hong Kong belongs to Creditor rights index = 4 countries.

Table A 1. Creditor Rights Index as of 2007 Low creditor rights index High creditor rights index Creditor rights index = 0 Creditor rights index = 3 Mexico Singapore Colombia Austria France Venezuela Australia Peru Malaysia South Africa Germany Netherlands Creditor rights index = 1 Slovenia Israel Greece Poland Korea Czech Republic Ireland Philippines Denmark Portugal Hungary Brazil United States United Kingdom Canada Switzerland Hong Kong Argentina Sweden New Zealand Pakistan Finland Creditor rights index = 4 Creditor rights index = 2 Bulgaria Chile Belgium Turkey Italy China Sri Lanka Thailand Norway India Russia Spain Romania Japan Indonesia

Domestic Credit-Output Ratios: International Comparisons As shown in figure 5. 4, Israel did not have a significant credit growth in the wake of the 2008 crisis. The US and the UK, in contrast, were vulnerable to a gigantic credit expansion (Germany, as if Israel escaped such credit bubbles). Domestic Credit to Private Non-Financial Sector (% of GDP) 250 200 United States 150 United Kingdom 100 Germany 50 Israel 2015 2012 2009 2006 2003 2000 1997 1994 1991 1988 1985 1982 1979 1976 1973 1970 0 Source: International Monetary Fund, International Financial Statistics, data files, and World Bank and OECD GDP estimates.

Exchange-Rate Policy Reaction Like emerging economies, Israel monetary authorities were concerned about monetary expansion in the West, appreciating their currencies. The “Great Recession” downward pressures on the demand for Israel’s exports and the strengthening of the Israeli currency as capital inflows picked up.

Under Valued Exchange Rate The rationale for the Bank of Israel forex market intervention in the aftermath of the global financial crisis. However, the effectiveness of such policy is short lived. Once the VIX index falls, sterilized-foreign-exchangemarket intervention becomes ineffective. Excessively high foreign reserves also have fiscal medium term costs.

Effectiveness of Sterilized Intervention Sterilized intervention is ineffective when there is high private capital mobility to the extent that domestic and foreign securities viewed by a large group of investors, are close substitutes. Conditions under which sterilized intervention is effective happen to exist for a crisis economy, however, when there is a probability of capital flow reversal, liquidity shortage, or major real trade shock, leading to financial-intermediaries collapse.

Israel Avoiding the Zero Lower Bound Trap while the Natural Rate Remained Positive! Depression shock: Inflation down policy rate down by more real interest rate, r, down policy rate reaches zlb=0 Output Gap remain stuck!

Israel did not fall into the liquidity trap Israel’s did not suffer a financial shock! It’s natural real interest rate did not fall below zero and therefore it avoided the policy rate zero lower bound which leads to liquidity trap

Israel’s Spike in the Credit Default Swaps: Prerequisit for Foreign- Exchange Market Intervention A credit default swap (CDS) is a financial swap agreement that the seller of the CDS will compensate the buyer (usually the creditor of the reference loan) in the event of a loan default (by the debtor) or other credit event.

Figure 5 B: Sterilized Foreign Exchange Market Intervention Sterilized purchase of foreign assets

Small Countries Engaging in a Currency War Nominal Exchange Rate of Various Countries that Engaged in the "Currency War" : Israel, Switzerland, Sweden, Brazil and Indonesia (2007=100) Indonesia 130 Sweden Brazil 120 Israel 110 Switzerland 100 90 80 70 2005 2006 2007 2008 2009 2010 2011 Source: FRED Note that if the risk premium does not change the sterilized foreign-exchange-market intervention cannot affect the exchange rate.

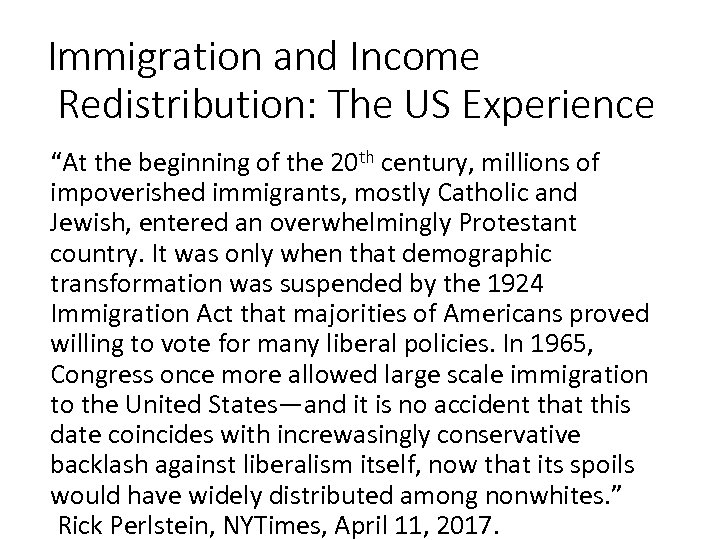
Around the World: Almost Never Free Migration Jeff Sachs (2017) says: “If people were told that they could move, no questions asked, probably a billion would shift around the planet within five years, with many coming to Europe and the US. No society would tolerate even a fraction of that flow. Any politician who says, “let’s be generous, ” without saying”we’re not going to the doors wide open” will lose. ” Rational, and generous policy that also resonates politically, will not eliminate national borders altogether. 60

Israel and the World Economy: Benefits of Migration The Israeli economy, a remarkable development- success story, provides a counter example to the current anti-globalization arguments. I present an economic-history perspective of Israel’s long struggle with inflation and of Israel’s unique immigration story.

What Could Have Been with Free Migration Jeff Sachs (2017) says: “If people were told that they could move, no questions asked, probably a billion would shift around the planet within five years, with many coming to Europe and the US. No society would tolerate even a fraction of that flow. Any politician who says, “let’s be generous, ” without saying”we’re not going to the doors wide open” will lose. ” Rational, and generous policy that also resonates politically, will not eliminate national borders altogether. 62

Milton Friedman immigration quotation "You cannot simultaneously have free immigration and a welfare state. "

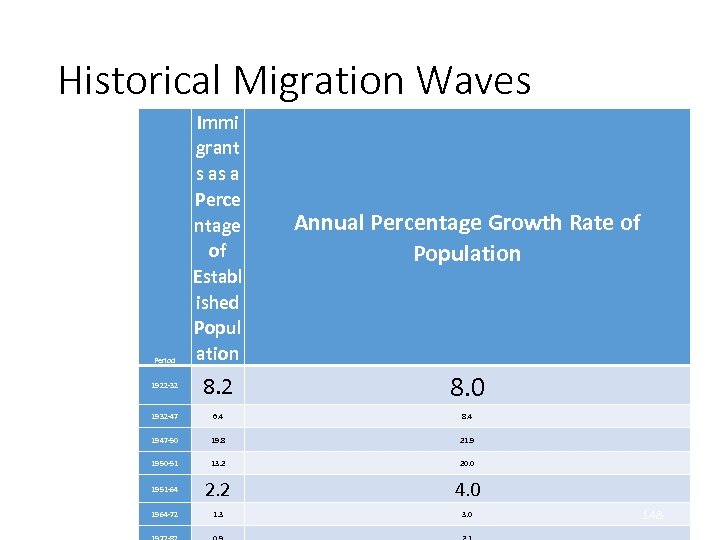
Israel’s story is unique! Almost no other country allows for free immigration. Israel’s Free immigration regime is based on the “Law of Return”.

Established Population and Immigrants in percentage of established population Period 1922 -32 8. 0 1932 -47 6. 4 8. 4 1947 -50 19. 8 21. 9 1950 -51 13. 2 20. 0 1951 -64 2. 2 4. 0 1964 -72 1. 3 3. 0 1972 -82 0. 9 2. 1 1982 -89 0. 4 1. 8 1989 -2001 19. 0 2. 9 Annual Percentage Growt Source: Ben-Porath (1985) for the years 1922 -1982, Central Bureau of Statistics (1992), Bank of Israel (1991 b) for the years 1982 -2001. 65

Immigration Waves and Growth Immigrants as a Percentage of Established Population Annual Percentage Growth Rate of Population 1922 -32 8. 0 1932 -47 6. 4 8. 4 1947 -50 19. 8 21. 9 1950 -51 13. 2 20. 0 1951 -64 2. 2 4. 0 1964 -72 1. 3 3. 0 1972 -82 0. 9 2. 1 1982 -89 0. 4 1. 8 1989 -2001 19. 0 2. 9 Period

of Jews from the to Israel, USA and eft axis, thousands) tion of Jews in Israel percent) 200 Israel 180 160 140 120 Jews 100 80 60 USA 40 Ge 20 0 70 -88 89 90 91 92 93 94 95 96 97 98

The Skill, Age and Income of Immigrants from the FSU and the National Average, 1990 -2011 Immigrants from the FSU National Average Share in Total Population (%) 14. 5 100 Household Size (numbers of standard persons) 2. 32 2. 74 14 13. 3 Head of household with a bachelor degree (%) 41. 1 29. 5 gross monthly labor income per standard person (2011 NIS) 4, 351 4, 139 [1] Including immigrants Schooling Years Of Head of Household (no. )

The 1990 s Immigration of the Soviet Jews Immigration wave is like a positive “Supply-side shock”. It contributed to inflation reduction and to the high-tech sector. But…it was also correlated with a sharp rise in disposable income inequality. 69
![Immigrants’ Educational Characteristics [1] Including immigrants Immigrants from the National Average FSU Share in Immigrants’ Educational Characteristics [1] Including immigrants Immigrants from the National Average FSU Share in](https://present5.com/presentation/324a028fc358995e96dfaf701f477f2d/image-70.jpg)
Immigrants’ Educational Characteristics [1] Including immigrants Immigrants from the National Average FSU Share in Total Population (%) 14. 5 100 Household Size (numbers of standard persons) 2. 32 2. 74 14 13. 3 Head of household with a bachelor degree (%) 41. 1 29. 5 gross monthly labor income per standard person (2011 NIS) 4, 351 4, 139 Schooling Years Of Head of Household (no. ) 70

Euro. Asia / / N. Ameri Israel Africa ca Probability of outranking parents Rank shift pace, controlling for initial family position FSU Ethiop ia Arab 40% 49% 37% 58% 75% 59% -0. 22 (0. 17) -0. 02 (0. 15) - 2. 69*** (0. 16) -4. 58*** (0. 49) -6. 92*** (0. 16) First row is the probability of the child of reaching higher percentile in children’s generation distribut average percentile in their income distribution. Second row is the regression results of child-rank on t controlling for parents’ income rank using 100 percentile dummies. Base group is of families with Asia : matched to parents using administrative data. Standard errors in parentheses; upper asterisks indicate--*** p<0. 01, ** p<0. 05, * p<0. 1 .

Earning Deciles of Children Born to the Bottom-Decile Parents 18 16 Population 14 FSU Immigrant Families 12 10 8 6 4 2 0 Bottom 2 nd 3 rd 4 th 5 th 6 th 7 th 8 th 9 th Top

Probability of outranking parents by 5 percentiles by parents’ quantiles FSU Arab population

Income Inequality and Redistribution: International Comparison USA 0. 42 UK 0. 41 Israel 0. 41 Greece 0. 38 Cancada 0. 38 Australia 0. 38 Spain 0. 38 Korea 0. 37 Norway 0. 37 Taiwan 0. 36 Poland 0. 36 Germany 0. 35 Ireland 0. 35 Finland 0. 35 Slovak Republic 0. 35 Japan 0. 33 Austria 0. 33 Netherlands 0. 33 Sweden 0. 33 Denmark 0. 33 Luxembourg Switzerland 0. 32 0. 31

Disposable Income Inequality in Israel and Several EU-15 Countries, 1973 -2013 0. 40 Israel 0. 37 UK 0. 34 Italy 0. 31 France 0. 28 Germany 0. 25 0. 22 1973 1979 1985 1991 1997 2003 2009 75

Redistribution in Post Soviet-Jew Immigration Wave 76

Understanding Immigration. Redistribution Puzzle with a political economy model I use a majority-voting fiscal-burden model to explain the mechanism through which a supply side shock of skilled migration can change the political-economy equilibrium policies.

Role of Immigrants’ Vote Razin, Sadka and Swagel (J Pub E 2001) compare the political equilibrium with and without voting by immigrants. Without Immigrants’ voting: unskilled (skilled) immigrants raise (lower) the fiscal burden, which reduces (raises) redistribution. With Immigrants’ voting: unskilled immigrants strengthen (weaken) the proredistribution coalition, which raises (reduces) redistribution.

Voting turnout pattern of Soviet. Jew Immigrants Voting turnout patterns of Soviet. Jew immigrants to Israel in the 2001 elections, conducted by Arian and Shamir (2002) find: No marked difference in the voting turnout rates between these new immigrants and the established population. 79

Immigrants’ Academic Characteristics Even more striking is the percentage of the head of the household with a bachelor degree: 41. 1% among the new immigrants, compared to a national average of just 29. 5%. 80

Free Migration: Unique to Israel’s Law of Return not only enabled free immigration but also grants these immigrants immediate citizenship, and naturally voting rights. 81

Disposable income inequality in Israel, which was roughly stable until the beginning of the 1990 s, took a sharp rising trend thereafter, even though no such change occurs with respect to the market-triggered inequality. Interestingly, the upward shift in disposable income inequality occurs following the start of the immigration from the FSU. In this paper we provide a political economy explanation of how the immigration cause such a shift in disposable income inequality. 82

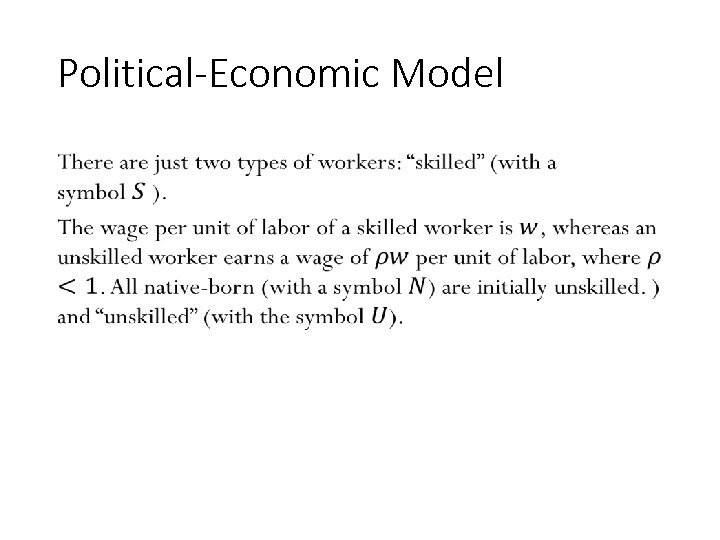
Political-Economic Model • 83

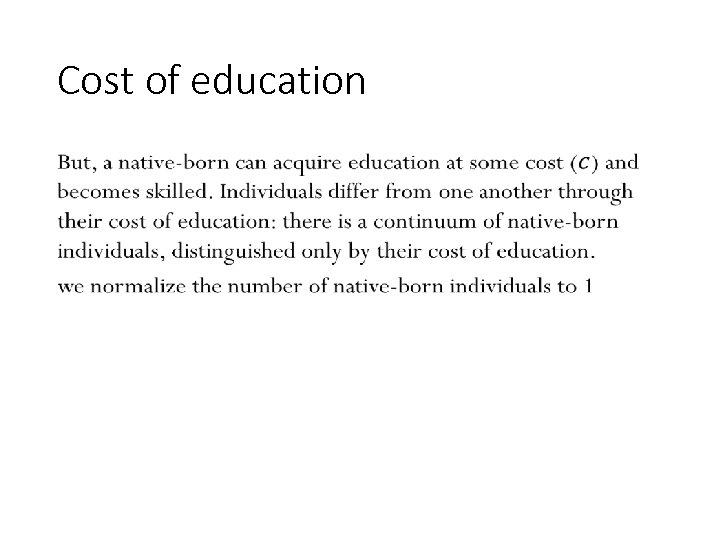
Cost of education • 84

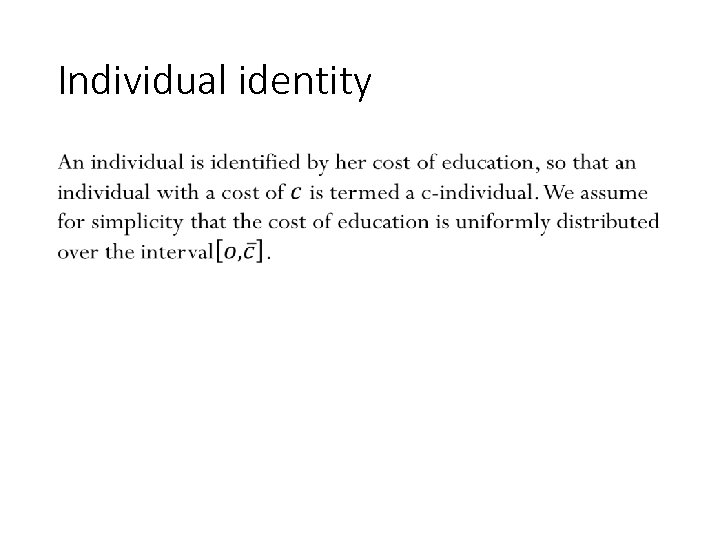
Individual identity • 85

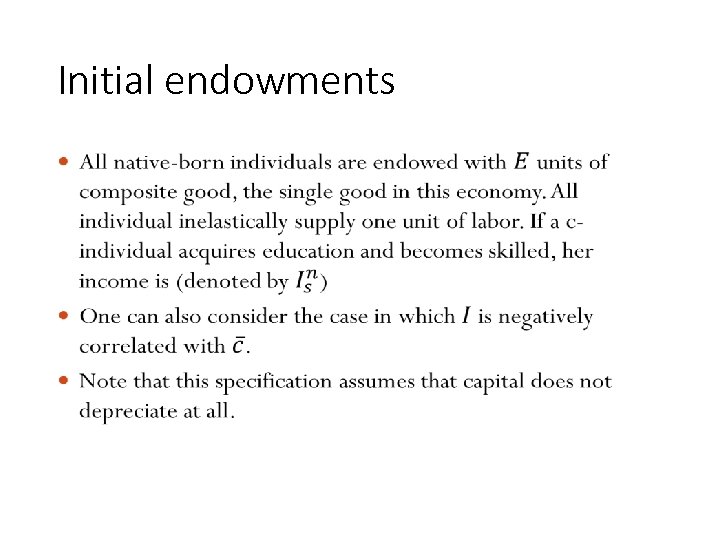
Initial endowments • 86

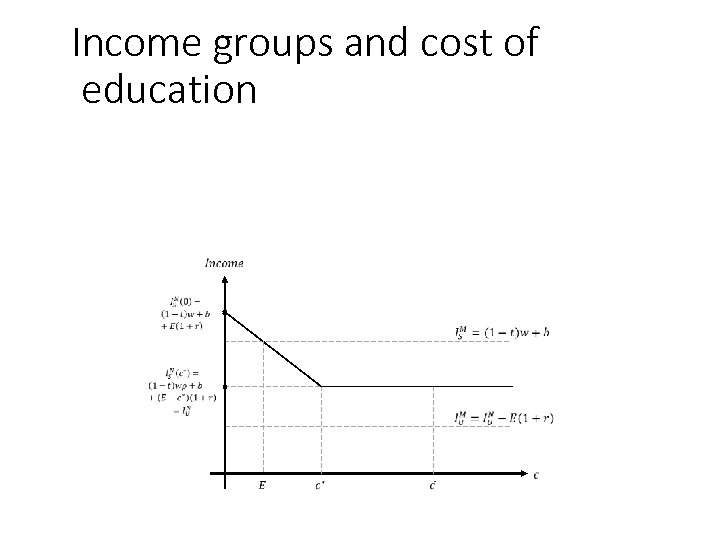
Income groups and cost of education 87

Income Groups: Ranking In sum, we have the following ranking of incomes: 88

• 89

Supply of Migrants • 90

Supply Side Block • 91

The Redistribution System • 92

Progressive and regressive systems • 93

Majority voting • 94

Policy setup • 95

Shock Experiment • 96

Political Equilibrium Changes Pre Shock –Unskilled native born are the largest sub group and unskilled (migrants plus native born) are the Majority Post Shock—Skilled migrants are the largest sub group and Skilled (migrants plus native born) are the Majority

EFFECTS Number of Skilled Migrants: Up Number of Unskilled Migrants: Down Income of Unskilled Native Born: Up Income of Skilled Migrants: Up Income of Unskilled Migrants: Down Wage: Down Return to Capital: UP Social Benefit: Down Tax Rate: Down

Numerical Effects 0. 89 0. 14 0. 97 0. 03 0. 194 0. 063 0. 312 1. 0 1. 11 0. 97 0. 03 0. 202 0 0. 228 2. 99

What Could Have Been with Free Migration Jeff Sachs (2017) says: “If people were told that they could move, no questions asked, probably a billion would shift around the planet within five years, with many coming to Europe and the US. No society would tolerate even a fraction of that flow. Any politician who says, “let’s be generous, ” without saying”we’re not going to the doors wide open” will lose. ” Rational, and generous policy that also resonates politically, will not eliminate national borders altogether. 100

Milton Friedman immigration quotation "You cannot simultaneously have free immigration and a welfare state. "

Israel’s story is unique! Almost no other country allows for free immigration. Israel’s Free immigration regime is based on the “Law of Return”.

Established Population and Immigrants in percentage of established population Period 1922 -32 8. 0 1932 -47 6. 4 8. 4 1947 -50 19. 8 21. 9 1950 -51 13. 2 20. 0 1951 -64 2. 2 4. 0 1964 -72 1. 3 3. 0 1972 -82 0. 9 2. 1 1982 -89 0. 4 1. 8 1989 -2001 19. 0 2. 9 Annual Percentage Growt Source: Ben-Porath (1985) for the years 1922 -1982, Central Bureau of Statistics (1992), Bank of Israel (1991 b) for the years 1982 -2001. 103

Immigration Waves and Growth Immigrants as a Percentage of Established Population Annual Percentage Growth Rate of Population 1922 -32 8. 0 1932 -47 6. 4 8. 4 1947 -50 19. 8 21. 9 1950 -51 13. 2 20. 0 1951 -64 2. 2 4. 0 1964 -72 1. 3 3. 0 1972 -82 0. 9 2. 1 1982 -89 0. 4 1. 8 1989 -2001 19. 0 2. 9 Period

of Jews from the to Israel, USA and eft axis, thousands) tion of Jews in Israel percent) 200 Israel 180 160 140 120 Jews 100 80 60 USA 40 Ge 20 0 70 -88 89 90 91 92 93 94 95 96 97 98

The Skill, Age and Income of Immigrants from the FSU and the National Average, 1990 -2011 Immigrants from the FSU National Average Share in Total Population (%) 14. 5 100 Household Size (numbers of standard persons) 2. 32 2. 74 14 13. 3 Head of household with a bachelor degree (%) 41. 1 29. 5 gross monthly labor income per standard person (2011 NIS) 4, 351 4, 139 [1] Including immigrants Schooling Years Of Head of Household (no. )

The 1990 s Immigration of the Soviet Jews Immigration wave is like a positive “Supply-side shock”. It contributed to inflation reduction and to the high-tech sector. But…it was also correlated with a sharp rise in disposable income inequality. 107
![Immigrants’ Educational Characteristics [1] Including immigrants Immigrants from the National Average FSU Share in Immigrants’ Educational Characteristics [1] Including immigrants Immigrants from the National Average FSU Share in](https://present5.com/presentation/324a028fc358995e96dfaf701f477f2d/image-108.jpg)
Immigrants’ Educational Characteristics [1] Including immigrants Immigrants from the National Average FSU Share in Total Population (%) 14. 5 100 Household Size (numbers of standard persons) 2. 32 2. 74 14 13. 3 Head of household with a bachelor degree (%) 41. 1 29. 5 gross monthly labor income per standard person (2011 NIS) 4, 351 4, 139 Schooling Years Of Head of Household (no. ) 108

Euro. Asia / / N. Ameri Israel Africa ca Probability of outranking parents Rank shift pace, controlling for initial family position FSU Ethiop ia Arab 40% 49% 37% 58% 75% 59% -0. 22 (0. 17) -0. 02 (0. 15) - 2. 69*** (0. 16) -4. 58*** (0. 49) -6. 92*** (0. 16) First row is the probability of the child of reaching higher percentile in children’s generation distribut average percentile in their income distribution. Second row is the regression results of child-rank on t controlling for parents’ income rank using 100 percentile dummies. Base group is of families with Asia : matched to parents using administrative data. Standard errors in parentheses; upper asterisks indicate--*** p<0. 01, ** p<0. 05, * p<0. 1 .
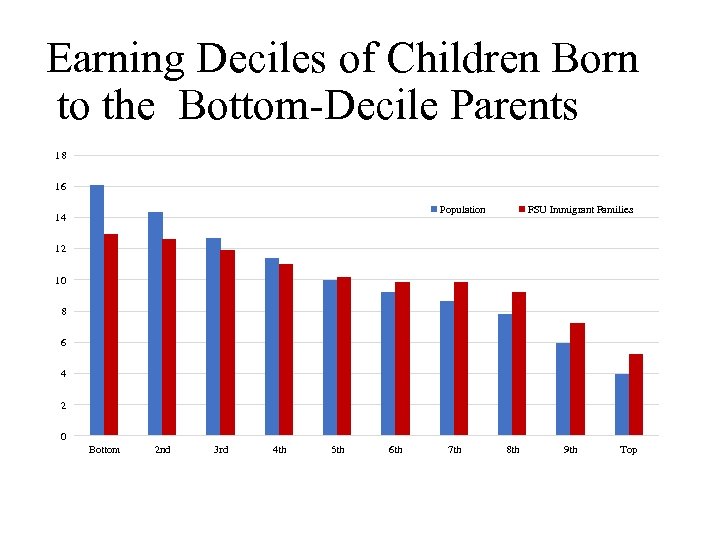
Earning Deciles of Children Born to the Bottom-Decile Parents 18 16 Population 14 FSU Immigrant Families 12 10 8 6 4 2 0 Bottom 2 nd 3 rd 4 th 5 th 6 th 7 th 8 th 9 th Top
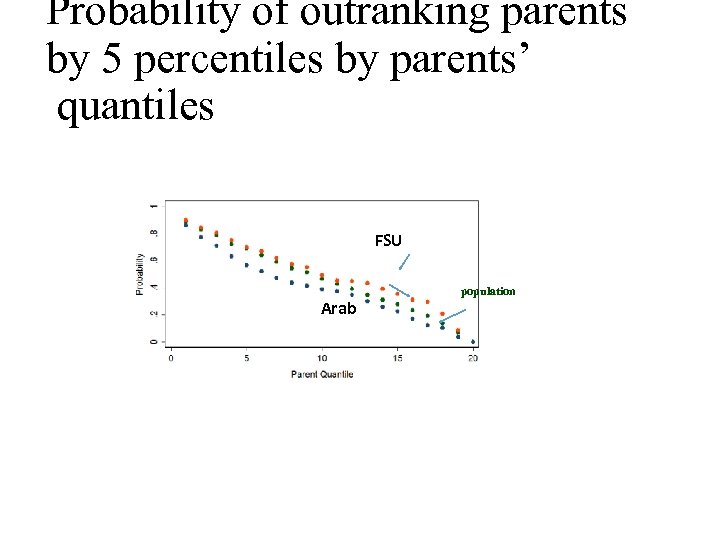
Probability of outranking parents by 5 percentiles by parents’ quantiles FSU Arab population
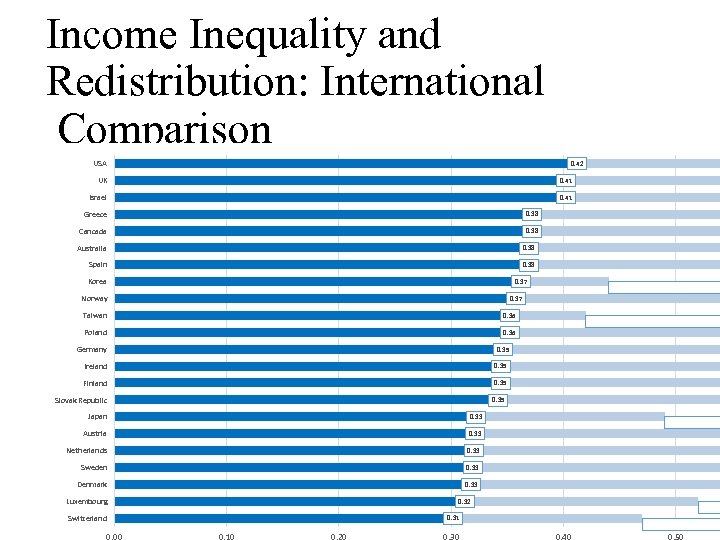
Income Inequality and Redistribution: International Comparison USA 0. 42 UK 0. 41 Israel 0. 41 Greece 0. 38 Cancada 0. 38 Australia 0. 38 Spain 0. 38 Korea 0. 37 Norway 0. 37 Taiwan 0. 36 Poland 0. 36 Germany 0. 35 Ireland 0. 35 Finland 0. 35 Slovak Republic 0. 35 Japan 0. 33 Austria 0. 33 Netherlands 0. 33 Sweden 0. 33 Denmark 0. 33 Luxembourg Switzerland 0. 32 0. 31
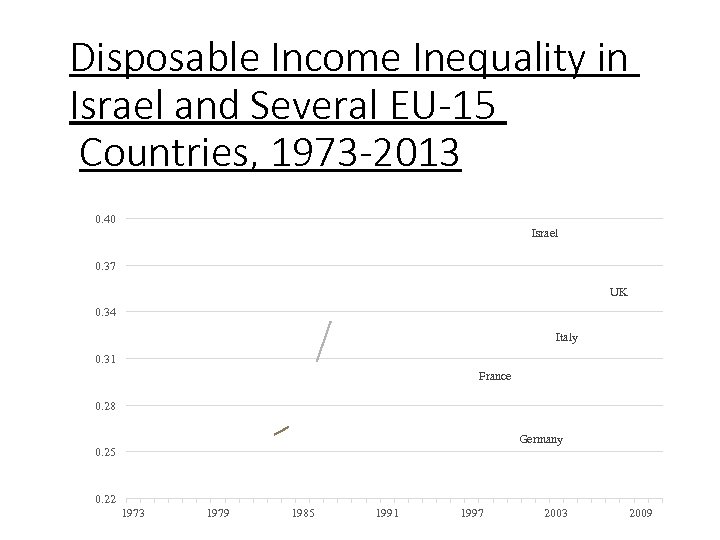
Disposable Income Inequality in Israel and Several EU-15 Countries, 1973 -2013 0. 40 Israel 0. 37 UK 0. 34 Italy 0. 31 France 0. 28 Germany 0. 25 0. 22 1973 1979 1985 1991 1997 2003 2009 113
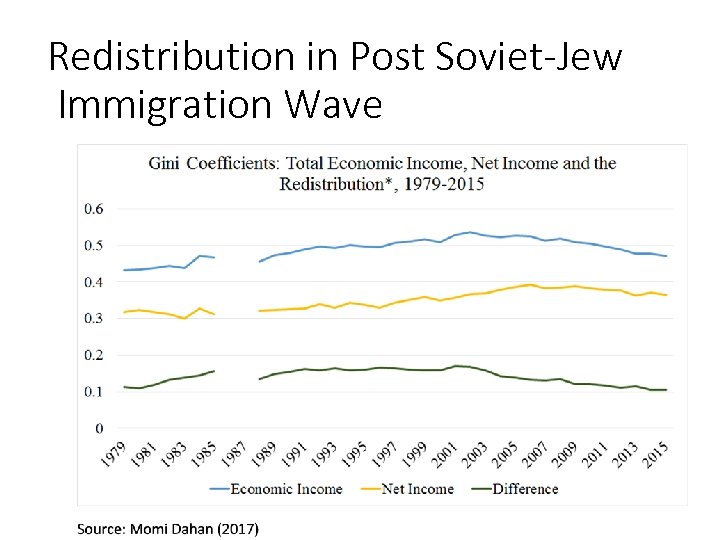
Redistribution in Post Soviet-Jew Immigration Wave 114
Understanding Immigration. Redistribution Puzzle with a political economy model I use a majority-voting fiscal-burden model to explain the mechanism through which a supply side shock of skilled migration can change the political-economy equilibrium policies.
Role of Immigrants’ Vote Razin, Sadka and Swagel (J Pub E 2001) compare the political equilibrium with and without voting by immigrants. Without Immigrants’ voting: unskilled (skilled) immigrants raise (lower) the fiscal burden, which reduces (raises) redistribution. With Immigrants’ voting: unskilled immigrants strengthen (weaken) the proredistribution coalition, which raises (reduces) redistribution.
Voting turnout pattern of Soviet. Jew Immigrants Voting turnout patterns of Soviet. Jew immigrants to Israel in the 2001 elections, conducted by Arian and Shamir (2002) find: No marked difference in the voting turnout rates between these new immigrants and the established population. 117
Immigrants’ Academic Characteristics Even more striking is the percentage of the head of the household with a bachelor degree: 41. 1% among the new immigrants, compared to a national average of just 29. 5%. 118
Free Migration: Unique to Israel’s Law of Return not only enabled free immigration but also grants these immigrants immediate citizenship, and naturally voting rights. 119
Disposable income inequality in Israel, which was roughly stable until the beginning of the 1990 s, took a sharp rising trend thereafter, even though no such change occurs with respect to the market-triggered inequality. Interestingly, the upward shift in disposable income inequality occurs following the start of the immigration from the FSU. In this paper we provide a political economy explanation of how the immigration cause such a shift in disposable income inequality. 120
Political-Economic Model • 121
Cost of education • 122
Individual identity • 123
Initial endowments • 124
Income groups and cost of education 125
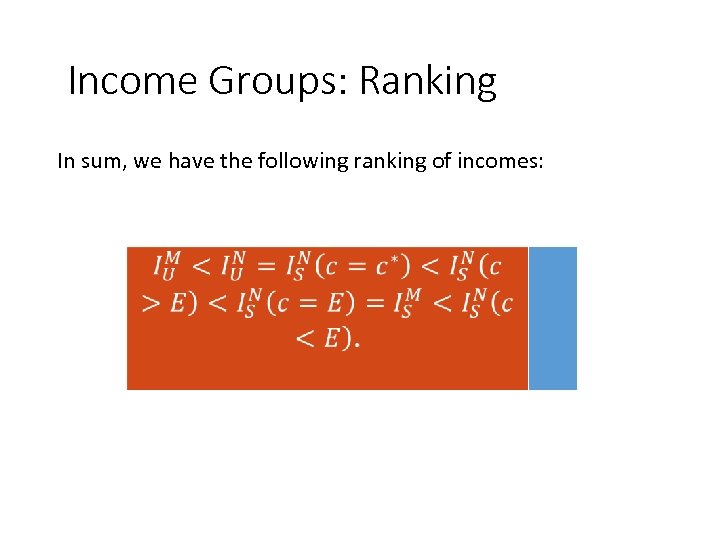
Income Groups: Ranking In sum, we have the following ranking of incomes: 126
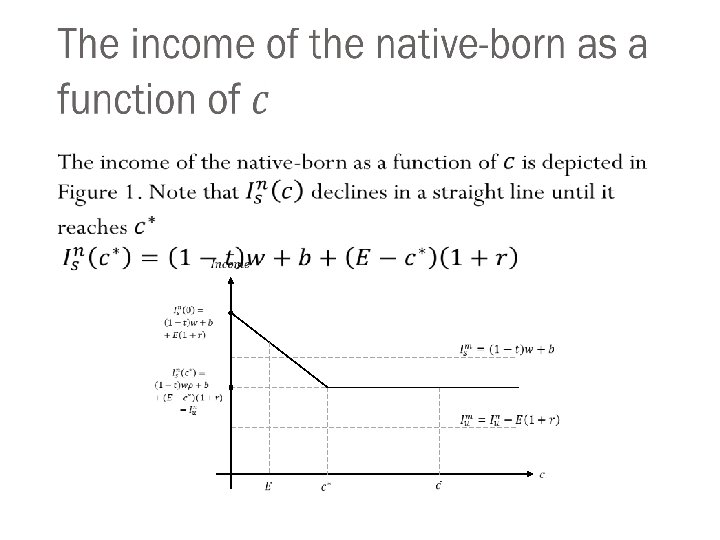
• 127
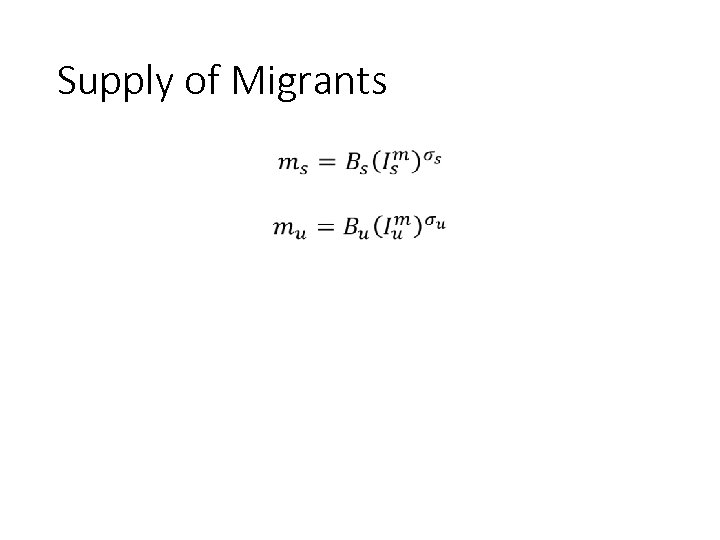
Supply of Migrants • 128
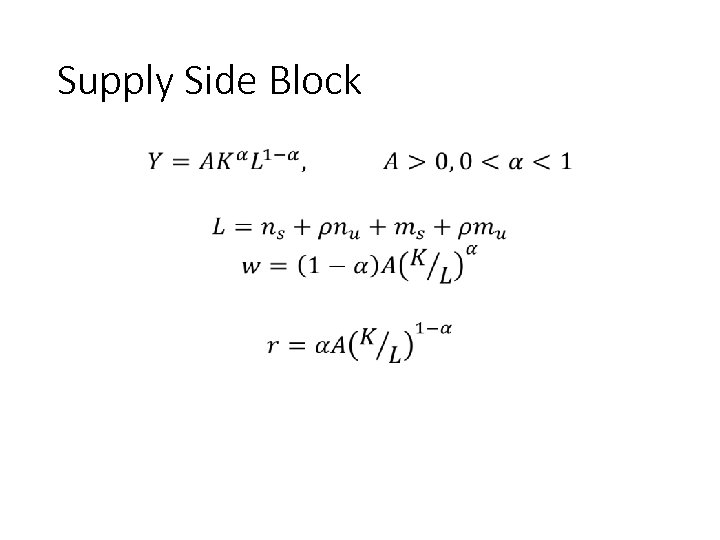
Supply Side Block • 129
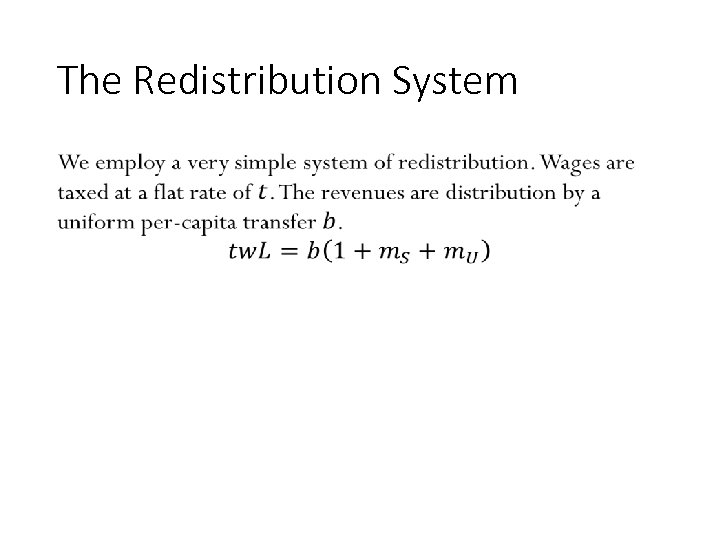
The Redistribution System • 130
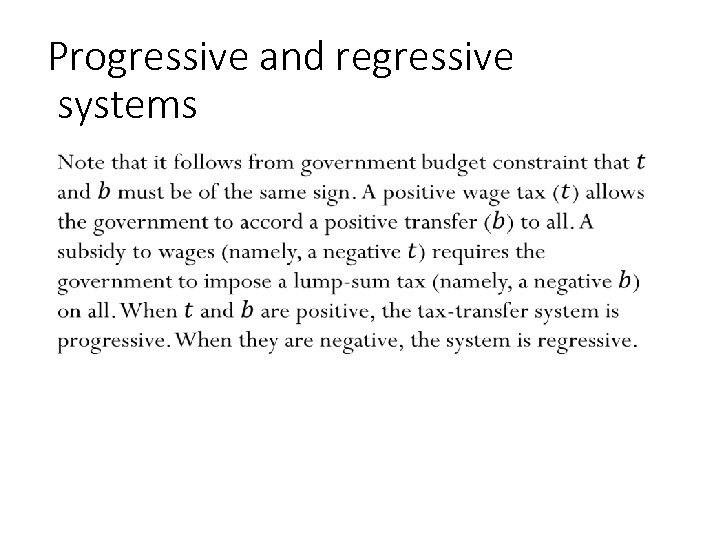
Progressive and regressive systems • 131
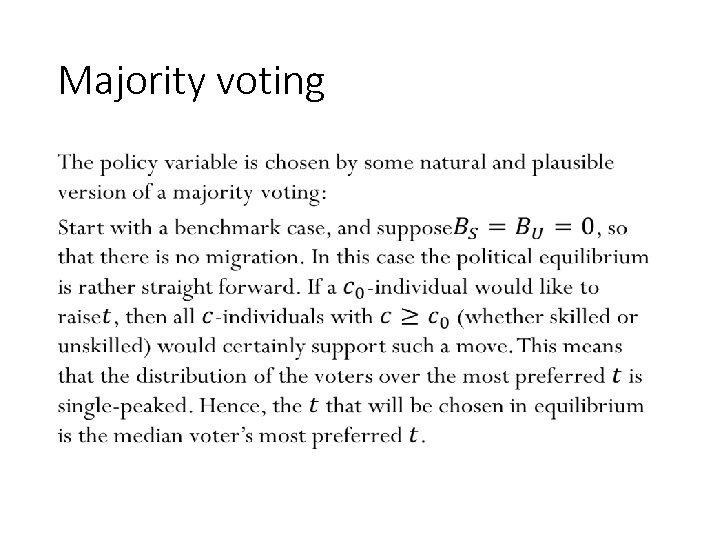
Majority voting • 132
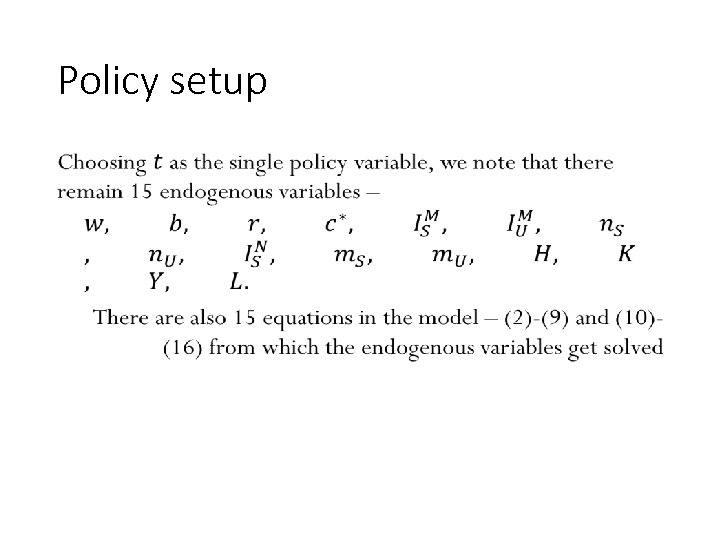
Policy setup • 133
Shock Experiment • 134
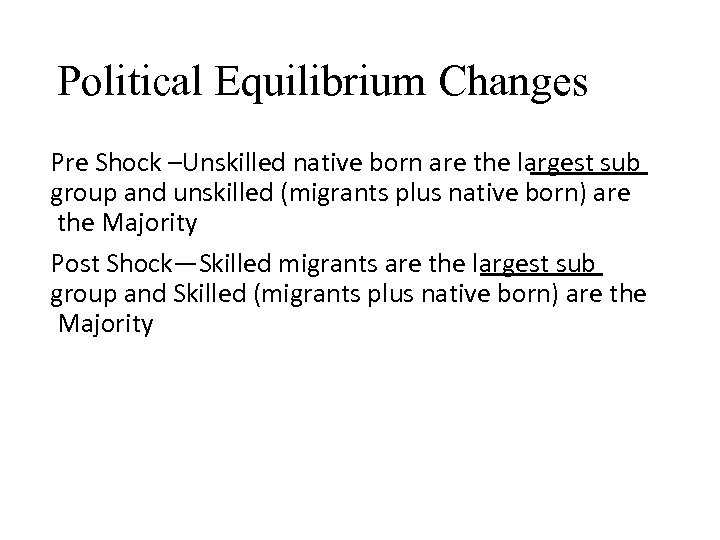
Political Equilibrium Changes Pre Shock –Unskilled native born are the largest sub group and unskilled (migrants plus native born) are the Majority Post Shock—Skilled migrants are the largest sub group and Skilled (migrants plus native born) are the Majority
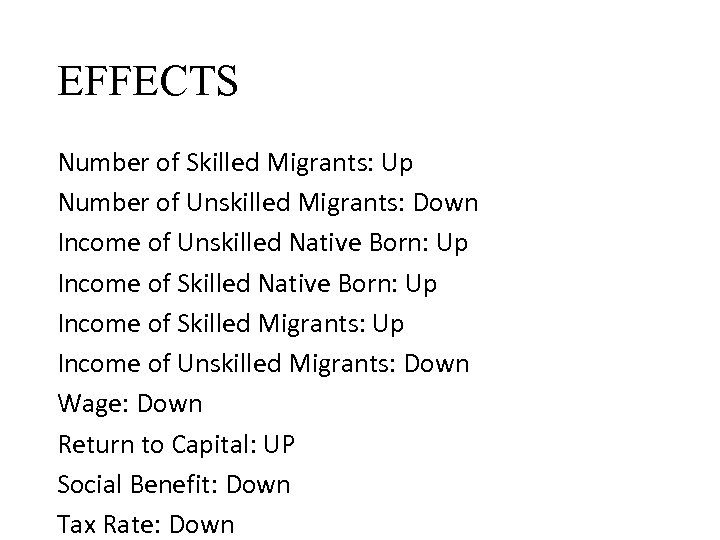
EFFECTS Number of Skilled Migrants: Up Number of Unskilled Migrants: Down Income of Unskilled Native Born: Up Income of Skilled Migrants: Up Income of Unskilled Migrants: Down Wage: Down Return to Capital: UP Social Benefit: Down Tax Rate: Down
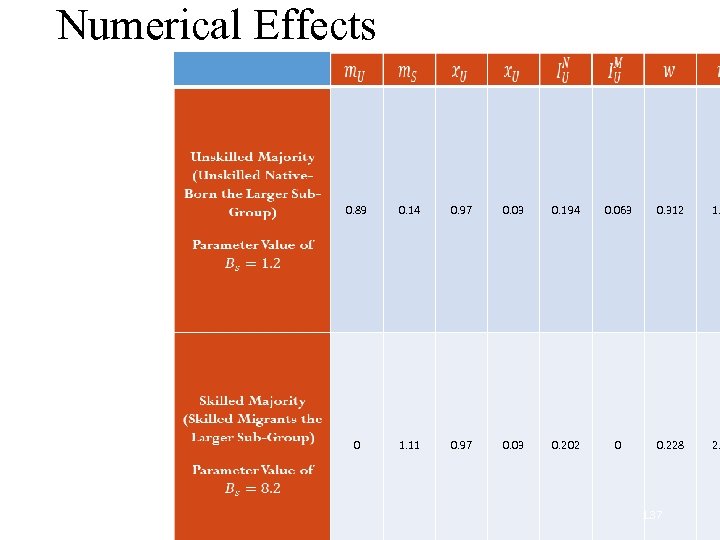
Numerical Effects 0. 89 0. 14 0. 97 0. 03 0. 194 0. 063 0. 312 1. 0 1. 11 0. 97 0. 03 0. 202 0 0. 228 2. 137
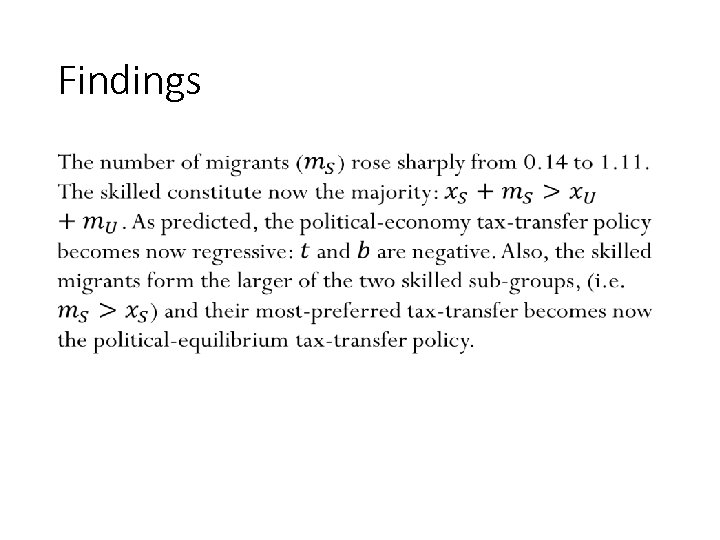
Findings T • 138
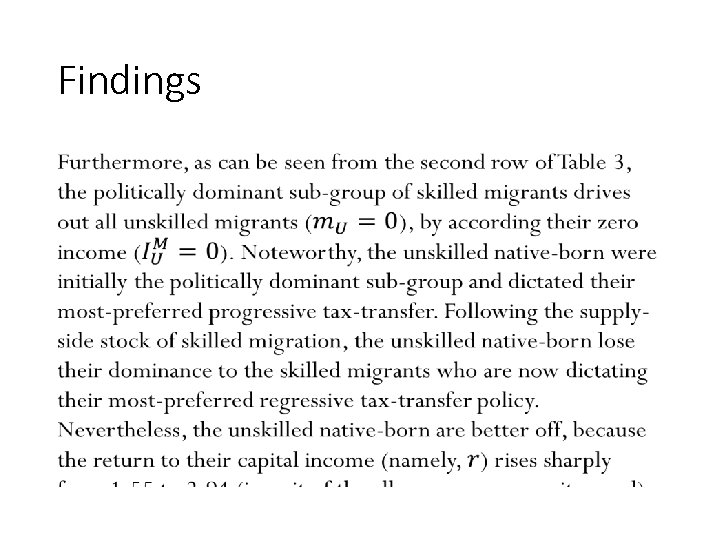
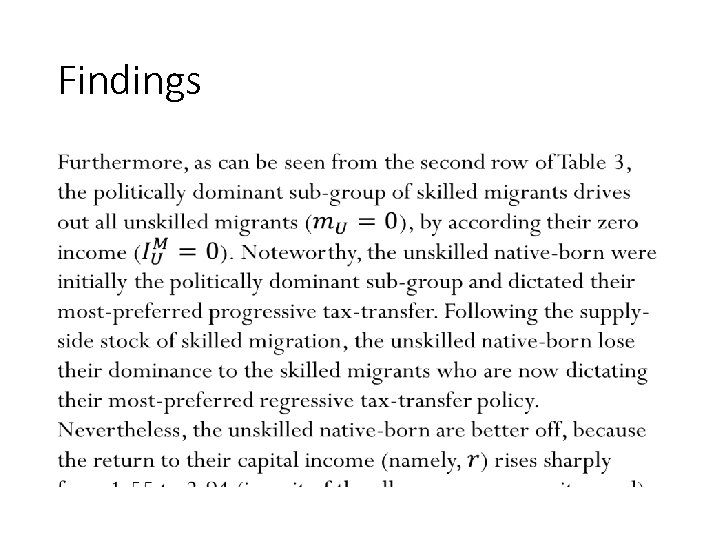
Findings • 139
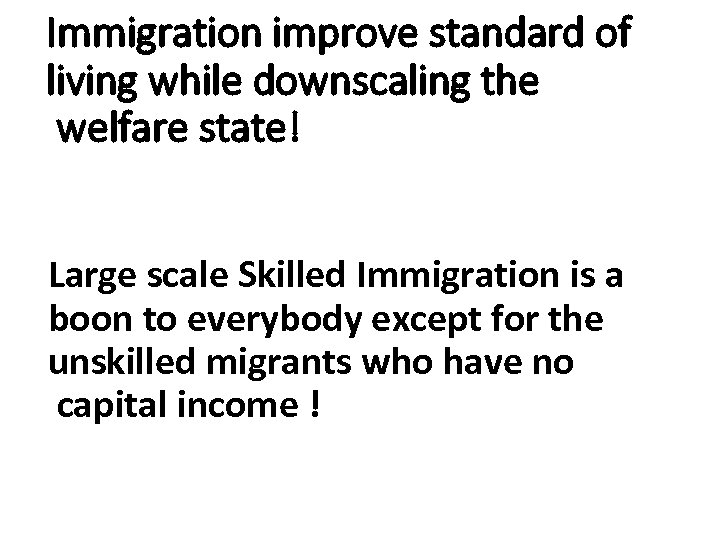
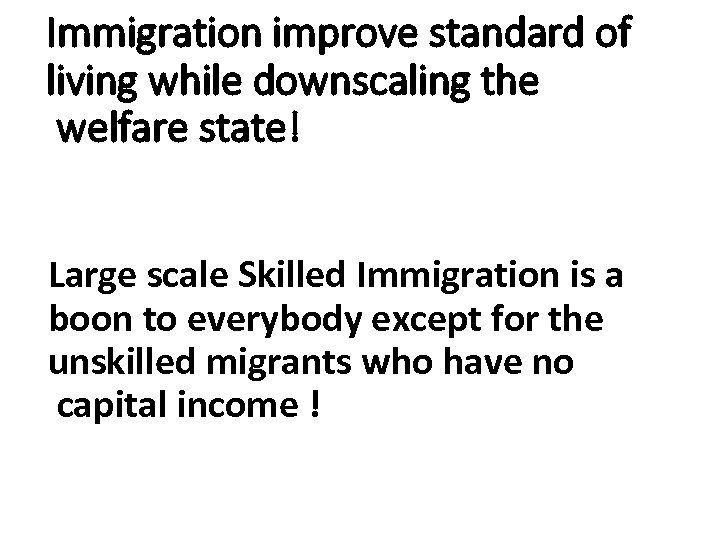
Immigration improve standard of living while downscaling the welfare state! Large scale Skilled Immigration is a boon to everybody except for the unskilled migrants who have no capital income !

!Thank You
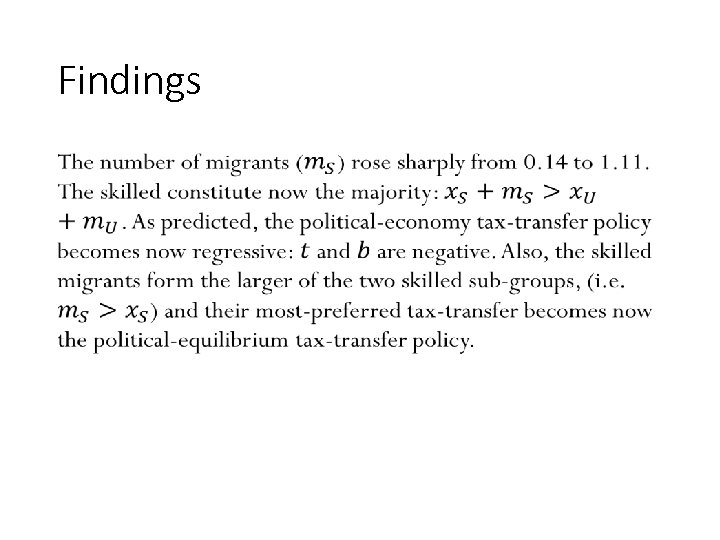
Findings T • 142
Findings • 143
Immigration improve standard of living while downscaling the welfare state! Large scale Skilled Immigration is a boon to everybody except for the unskilled migrants who have no capital income !

!Thank You
Israel’s Free migration, based on the Law of Return, Is Unique!
Immigration and Income Redistribution: The US Experience “At the beginning of the 20 th century, millions of impoverished immigrants, mostly Catholic and Jewish, entered an overwhelmingly Protestant country. It was only when that demographic transformation was suspended by the 1924 Immigration Act that majorities of Americans proved willing to vote for many liberal policies. In 1965, Congress once more allowed large scale immigration to the United States—and it is no accident that this date coincides with increwasingly conservative backlash against liberalism itself, now that its spoils would have widely distributed among nonwhites. ” Rick Perlstein, NYTimes, April 11, 2017.
Historical Migration Waves Immi grant s as a Perce ntage of Establ ished Popul ation Annual Percentage Growth Rate of Population 1922 -32 8. 0 1932 -47 6. 4 8. 4 1947 -50 19. 8 21. 9 1950 -51 13. 2 20. 0 1951 -64 2. 2 4. 0 1964 -72 1. 3 3. 0 Period 148
Migration Wave as a “Natural Experiment” Immigration to the pre-state Palestine and to the State of Israel came in waves. Immigration at times, especially in the nascent statewood, and in the last wave from the Former Soviet Union (FSU) amounted to about 20 percent of the established population. 149
The 1990 s Immigration of the Soviet Jews Akin to a positive “Supply-side shock” of skill migration into Israel. It underpinned the eradication of inflation and the emergence of the high-tech sector. It was also correlated with a sharp rise in disposable income inequality. 150
A Political-Economy Model can explain the Immigration. Redistribution Phenomenon I use a majority-voting fiscal-burden model to explain the mechanism through which a supply side shock of skilled migration can change the political-economy equilibrium policies.
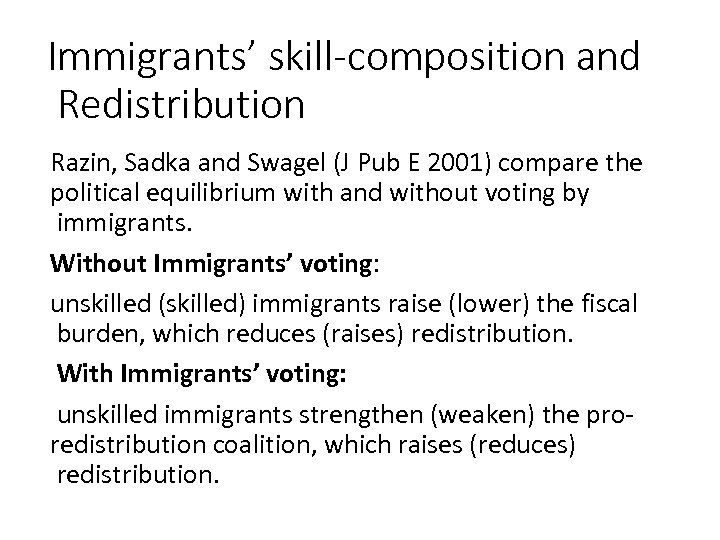
Immigrants’ skill-composition and Redistribution Razin, Sadka and Swagel (J Pub E 2001) compare the political equilibrium with and without voting by immigrants. Without Immigrants’ voting: unskilled (skilled) immigrants raise (lower) the fiscal burden, which reduces (raises) redistribution. With Immigrants’ voting: unskilled immigrants strengthen (weaken) the proredistribution coalition, which raises (reduces) redistribution.
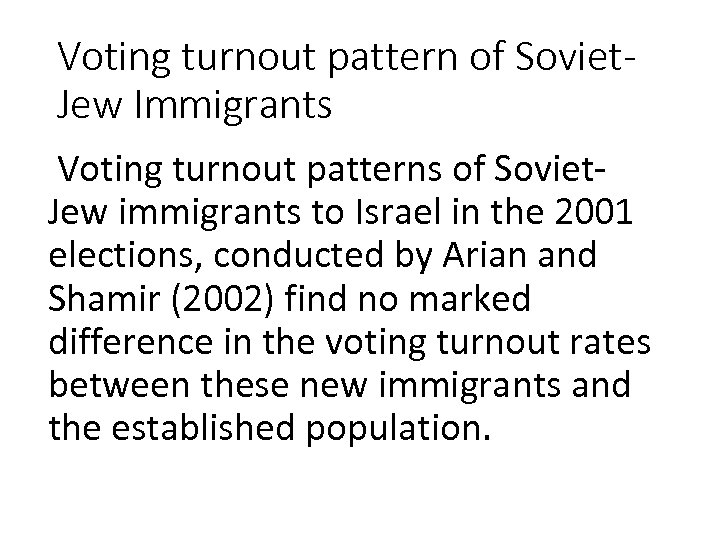
Voting turnout pattern of Soviet. Jew Immigrants Voting turnout patterns of Soviet. Jew immigrants to Israel in the 2001 elections, conducted by Arian and Shamir (2002) find no marked difference in the voting turnout rates between these new immigrants and the established population. 153
![Immigrants’ Educational Characteristics [1] Including immigrants Immigrants from the National Average FSU Share in Immigrants’ Educational Characteristics [1] Including immigrants Immigrants from the National Average FSU Share in](https://present5.com/presentation/324a028fc358995e96dfaf701f477f2d/image-154.jpg)
Immigrants’ Educational Characteristics [1] Including immigrants Immigrants from the National Average FSU Share in Total Population (%) 14. 5 100 Household Size (numbers of standard persons) 2. 32 2. 74 14 13. 3 Head of household with a bachelor degree (%) 41. 1 29. 5 gross monthly labor income per standard person (2011 NIS) 4, 351 4, 139 Schooling Years Of Head of Household (no. ) 154
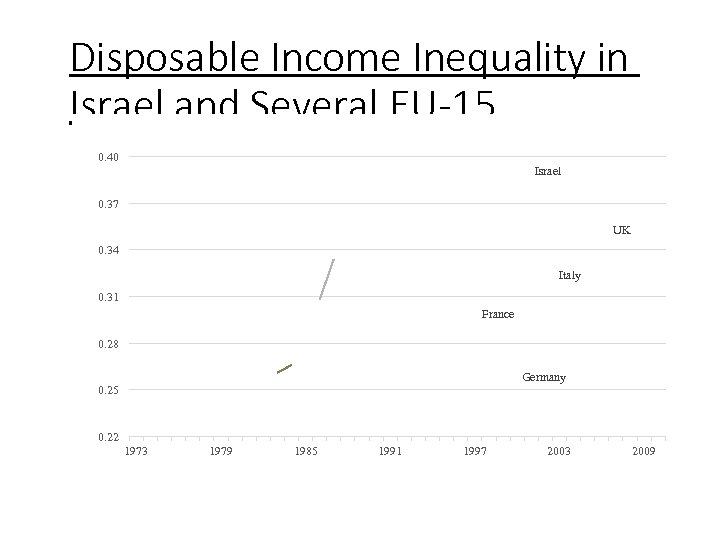
Disposable Income Inequality in Israel and Several EU-15 Countries, 1973 -2013 0. 40 Israel 0. 37 UK 0. 34 Italy 0. 31 France 0. 28 Germany 0. 25 0. 22 1973 1979 1985 1991 1997 2003 2009 155
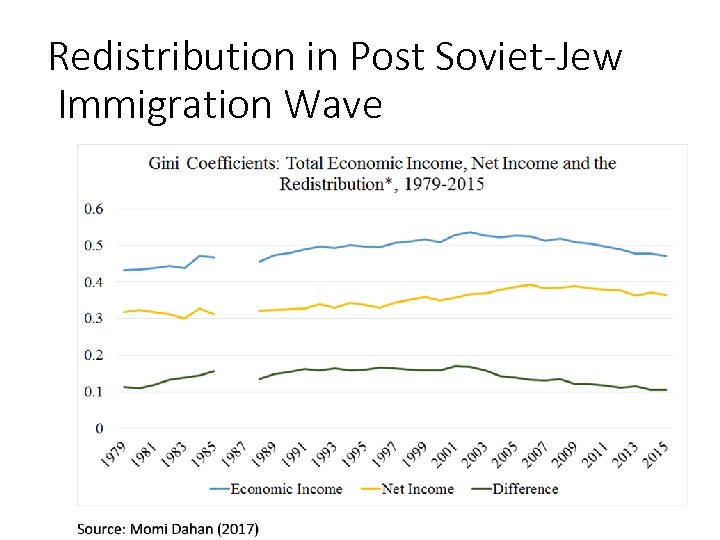
Redistribution in Post Soviet-Jew Immigration Wave 156
Immigrants’ Academic Characteristics Even more striking is the percentage of the head of the household with a bachelor degree: 41. 1% among the new immigrants, compared to a national average of just 29. 5%. 157
Free Migration: Unique to Israel’s Law of Return not only enabled free immigration but also grants these immigrants immediate citizenship, and naturally voting rights. 158
Disposable income inequality in Israel, which was roughly stable until the beginning of the 1990 s, took a sharp rising trend thereafter, even though no such change occurs with respect to the market-triggered inequality. Interestingly, the upward shift in disposable income inequality occurs following the start of the immigration from the FSU. In this paper we provide a political economy explanation of how the immigration cause such a shift in disposable income inequality. 159
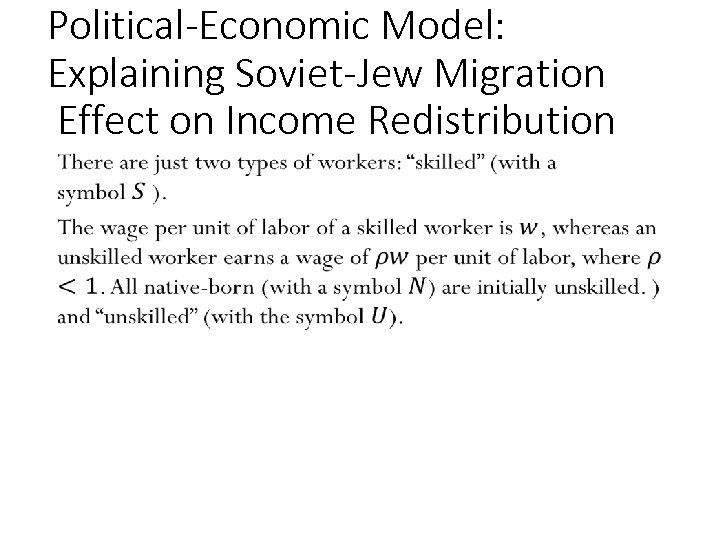
Political-Economic Model: Explaining Soviet-Jew Migration Effect on Income Redistribution • 160
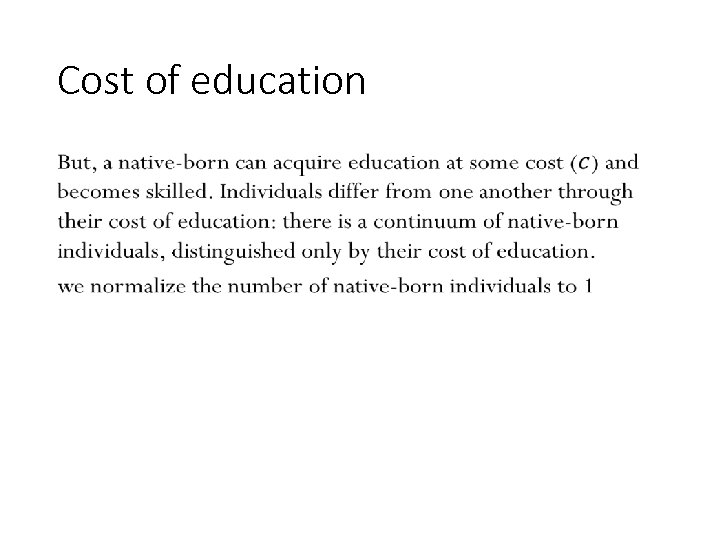
Cost of education • 161
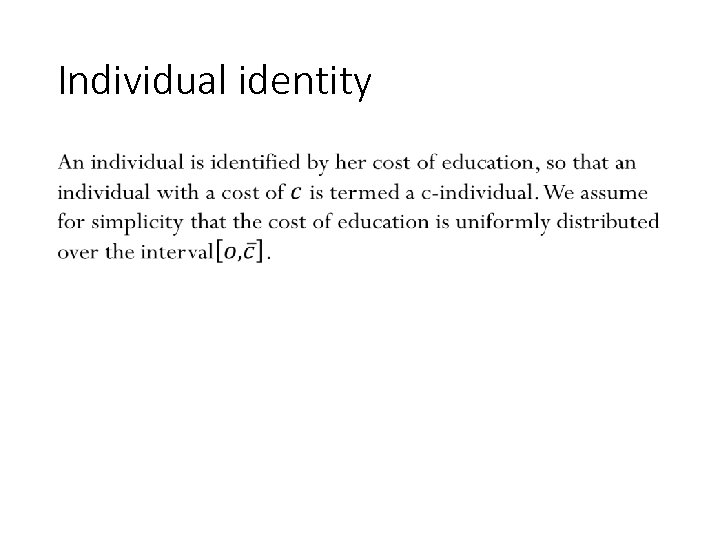
Individual identity • 162
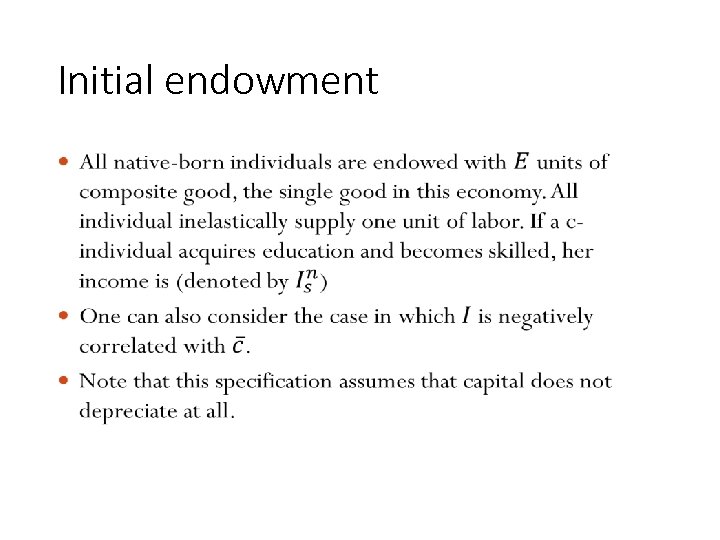
Initial endowment • 163
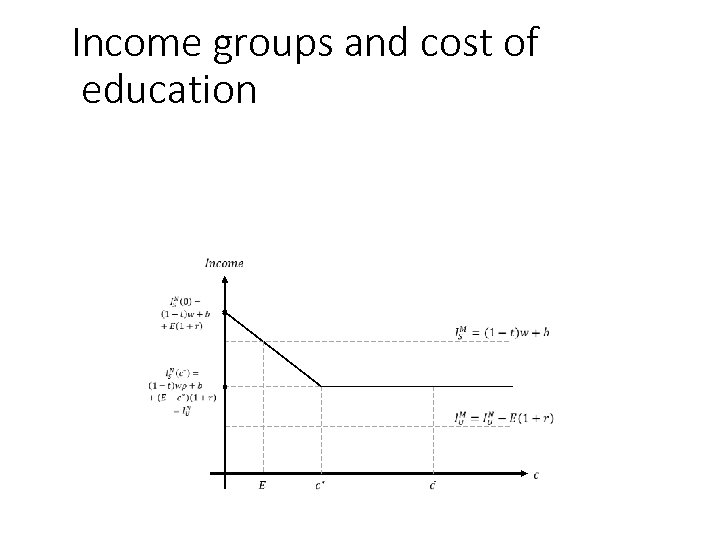
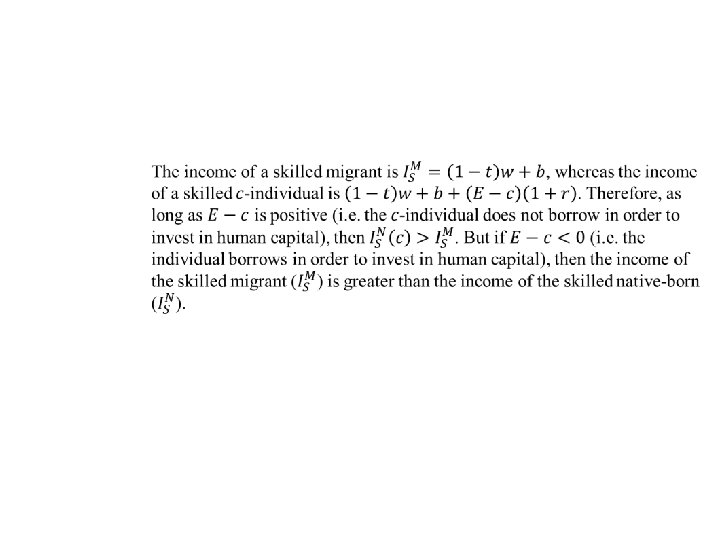
Income groups and cost of education 164
165
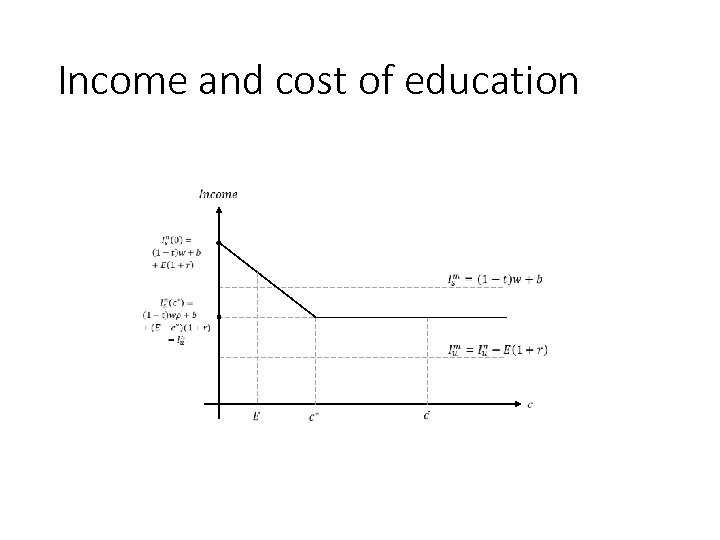
Income and cost of education 166
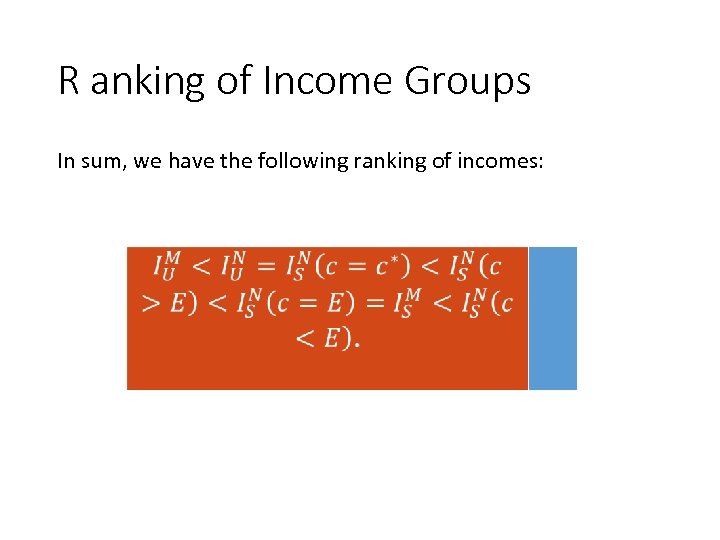
R anking of Income Groups In sum, we have the following ranking of incomes: 167
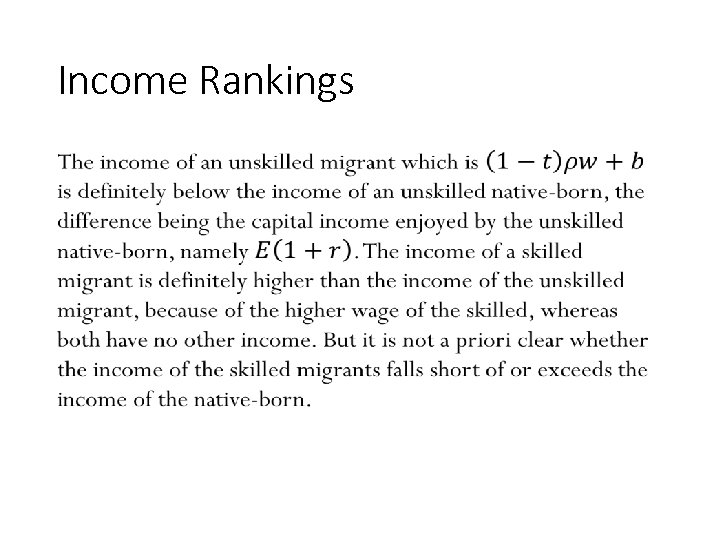
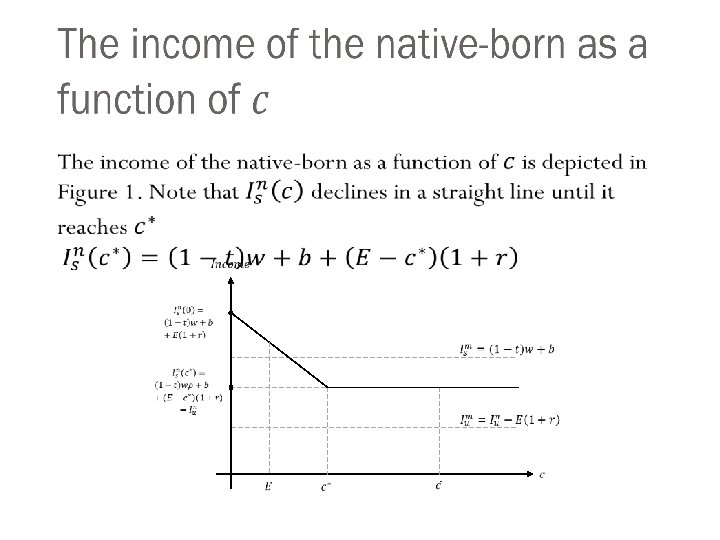
Income Rankings • 168
• 169
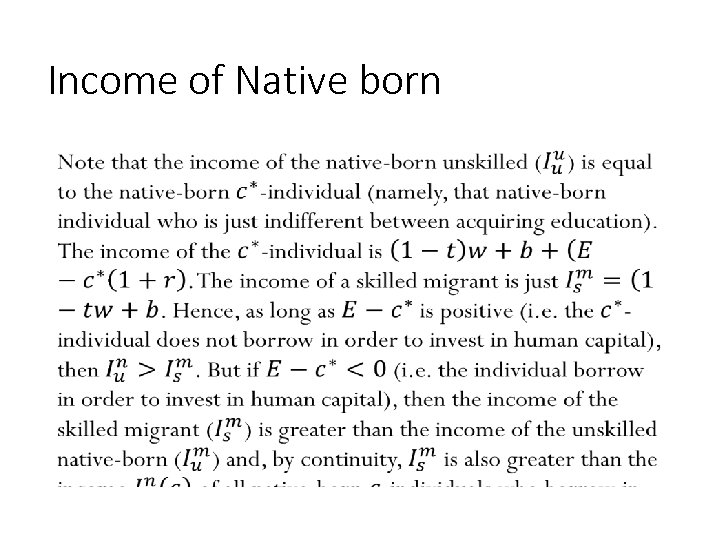
Income of Native born • 170
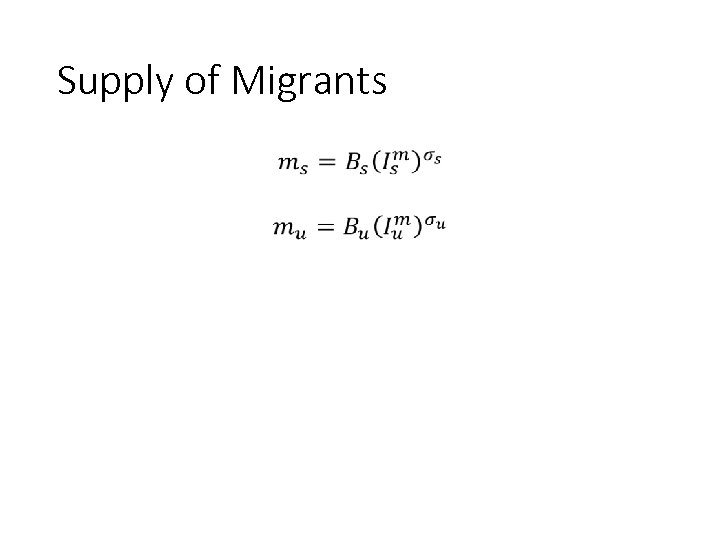
Supply of Migrants • 171
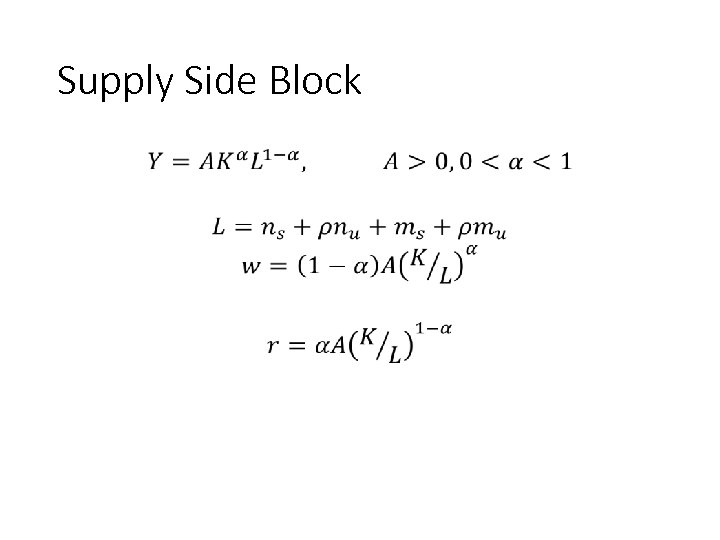
Supply Side Block • 172
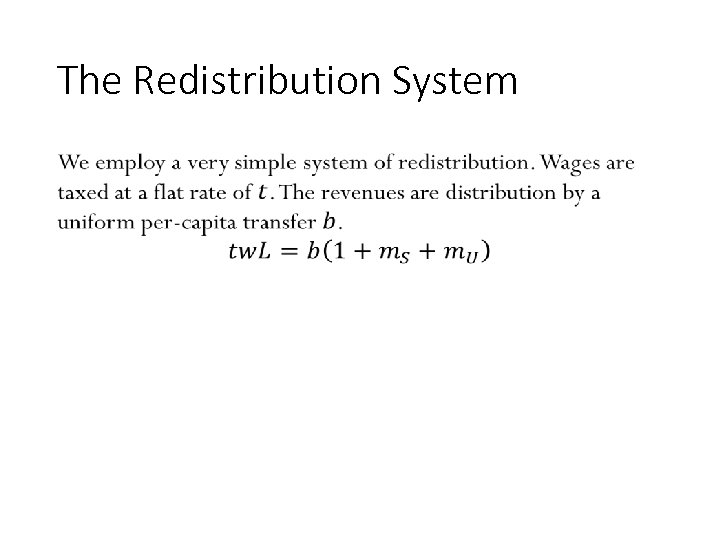
The Redistribution System • 173
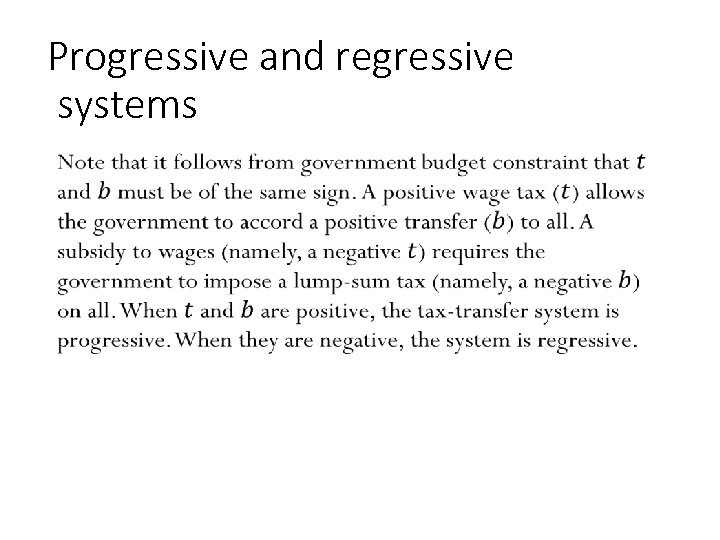
Progressive and regressive systems • 174
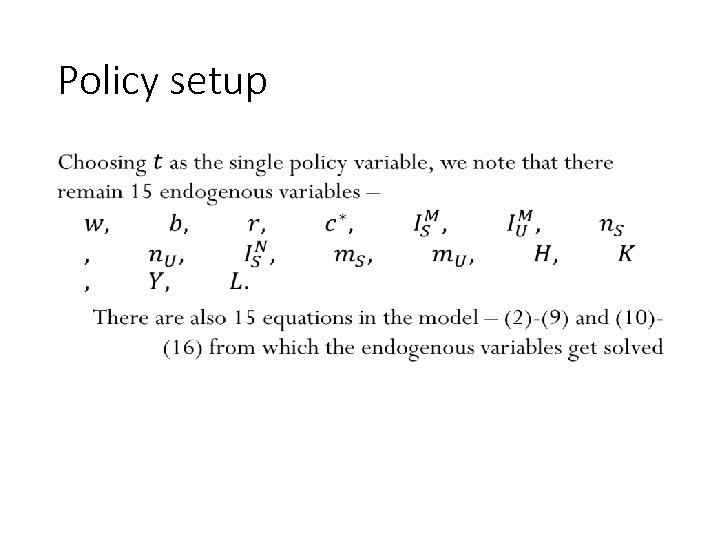
Policy setup • 175
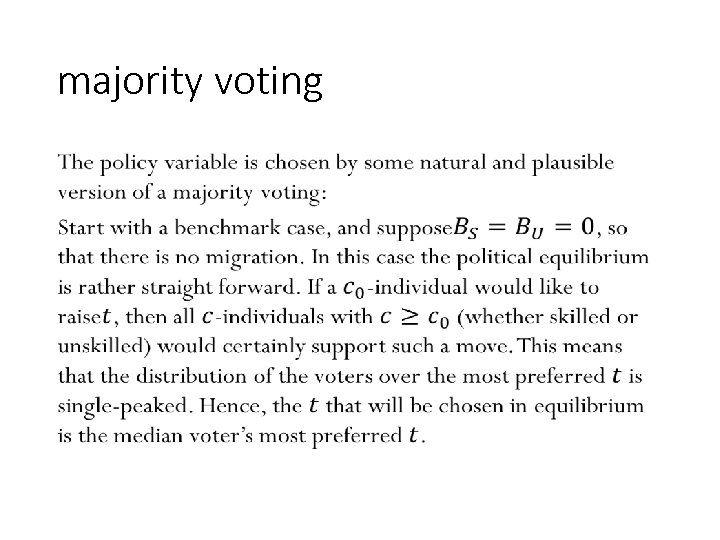
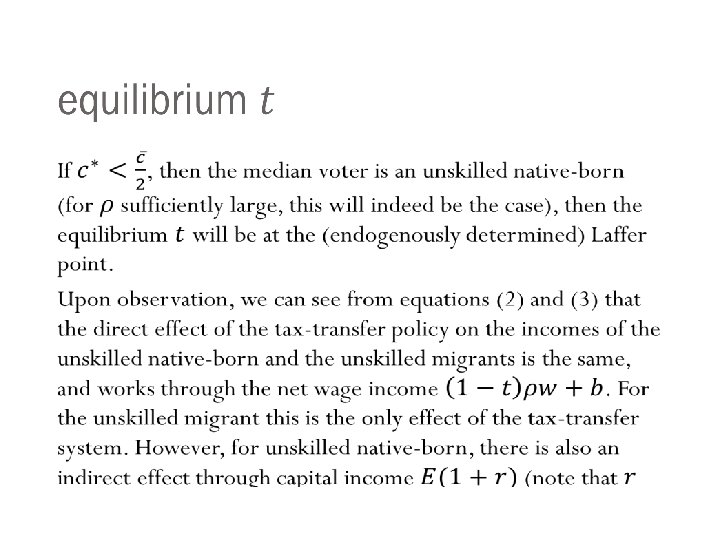
majority voting • 176
• 177
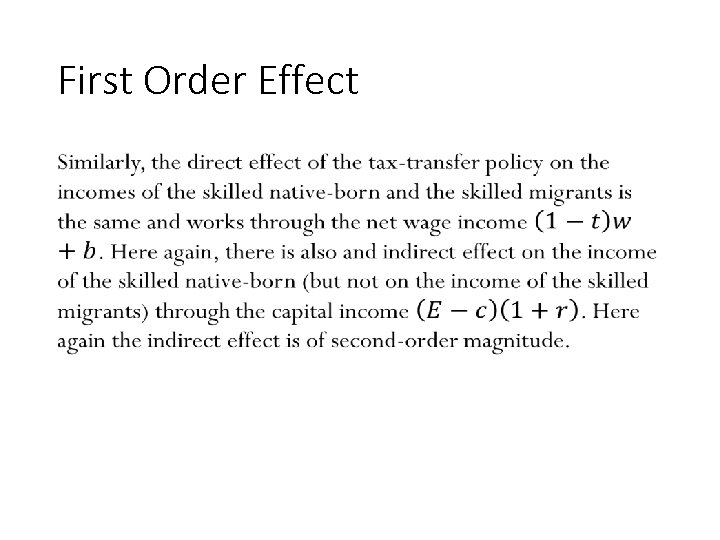
First Order Effect • 178
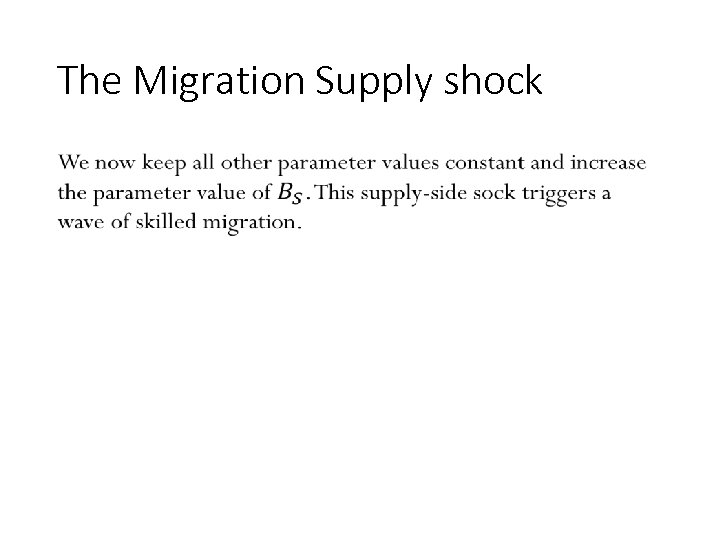
The Migration Supply shock • 179
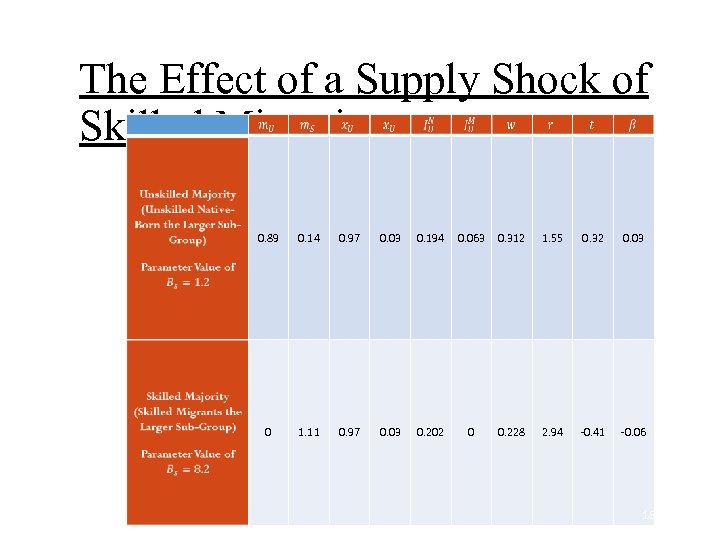
The Effect of a Supply Shock of Skilled Migration 0. 89 0. 14 0. 97 0. 03 0. 194 0. 063 0. 312 1. 55 0. 32 0. 03 0 1. 11 0. 97 0. 03 0. 202 0 0. 228 2. 94 -0. 41 -0. 06 180
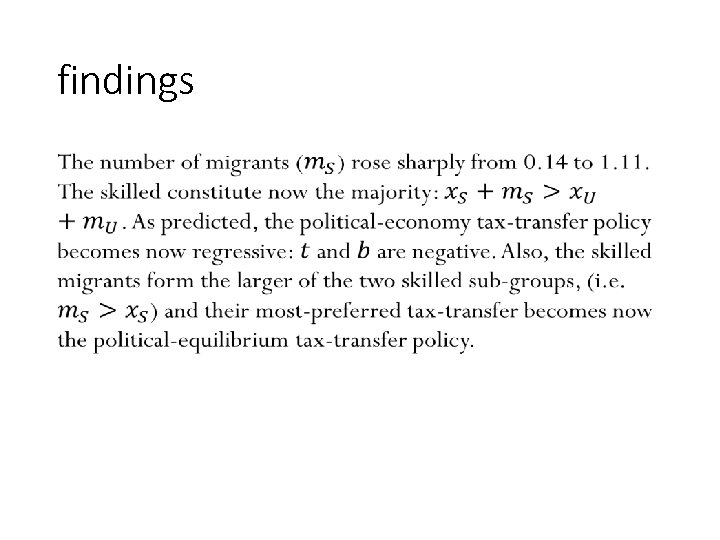
findings • 181
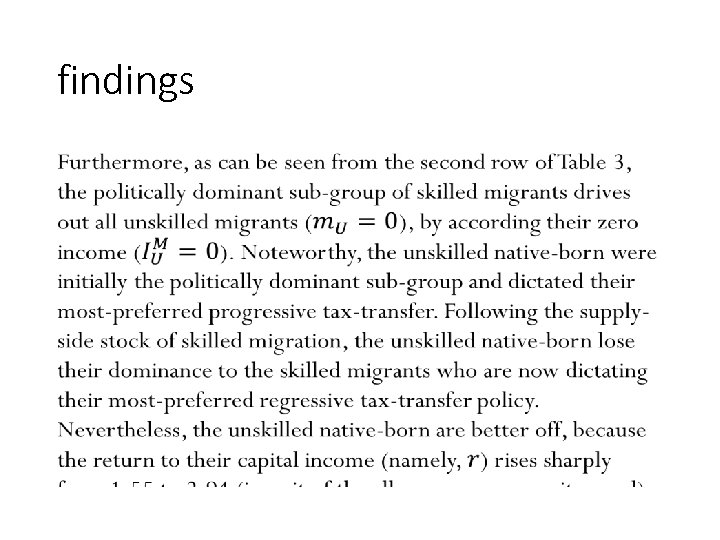
findings • 182

Chapter 7: FDI and the Information-Technology Surge
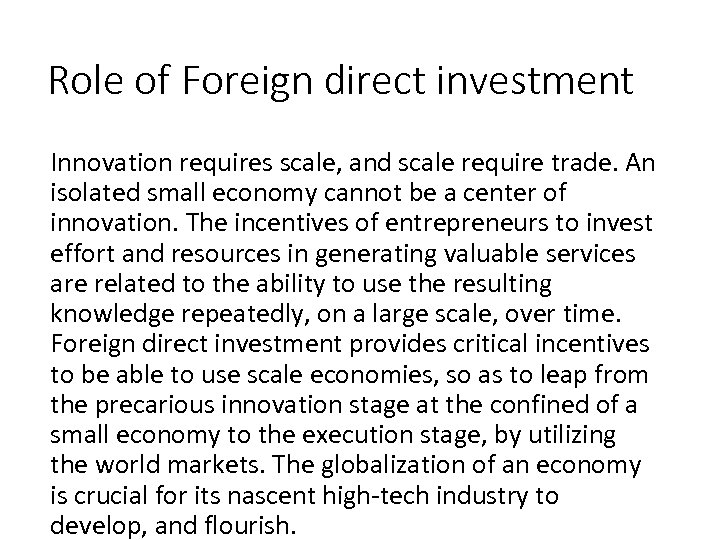
Role of Foreign direct investment Innovation requires scale, and scale require trade. An isolated small economy cannot be a center of innovation. The incentives of entrepreneurs to invest effort and resources in generating valuable services are related to the ability to use the resulting knowledge repeatedly, on a large scale, over time. Foreign direct investment provides critical incentives to be able to use scale economies, so as to leap from the precarious innovation stage at the confined of a small economy to the execution stage, by utilizing the world markets. The globalization of an economy is crucial for its nascent high-tech industry to develop, and flourish.
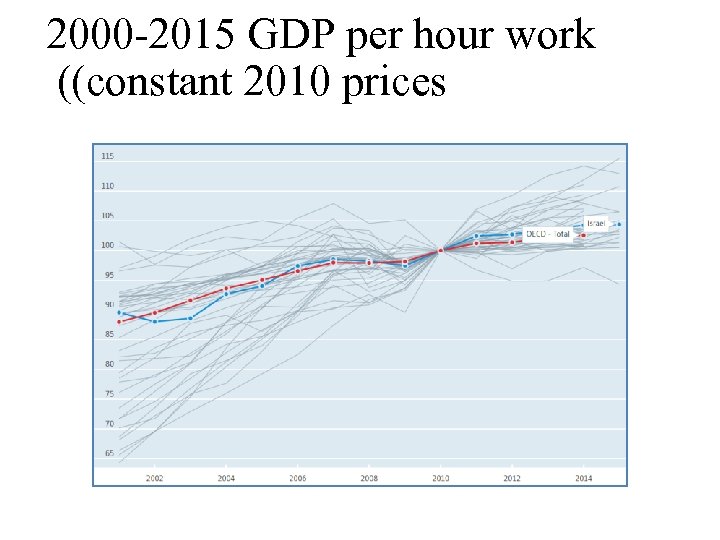
2000 -2015 GDP per hour work ((constant 2010 prices
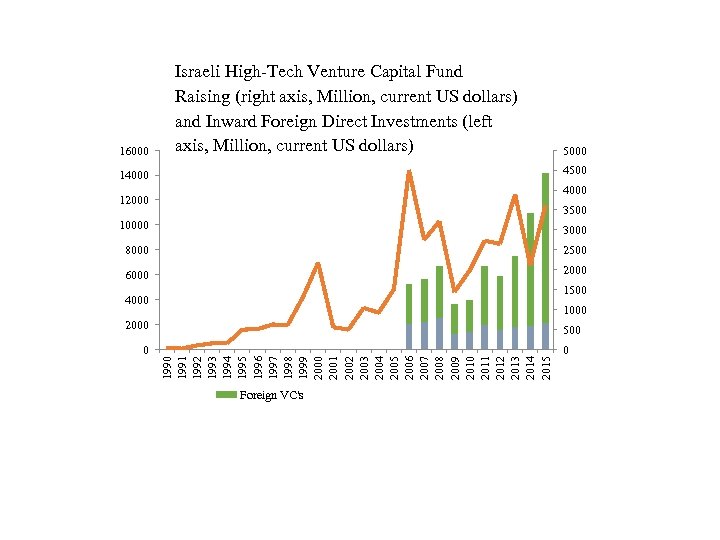
16000 Israeli High-Tech Venture Capital Fund Raising (right axis, Million, current US dollars) and Inward Foreign Direct Investments (left axis, Million, current US dollars) 5000 4500 14000 12000 3500 10000 3000 8000 2500 6000 2000 1500 4000 1000 2000 500 0 1991 1992 1993 1994 1995 1996 1997 1998 1999 2000 2001 2002 2003 2004 2005 2006 2007 2008 2009 2010 2011 2012 2013 2014 2015 0 Foreign VC's
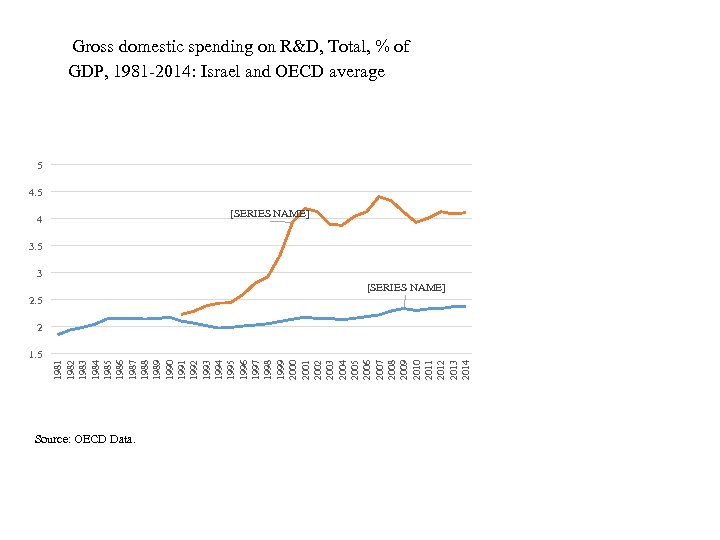
Gross domestic spending on R&D, Total, % of GDP, 1981 -2014: Israel and OECD average 5 4. 5 [SERIES NAME] 4 3. 5 3 [SERIES NAME] 2. 5 1981 1982 1983 1984 1985 1986 1987 1988 1989 1990 1991 1992 1993 1994 1995 1996 1997 1998 1999 2000 2001 2002 2003 2004 2005 2006 2007 2008 2009 2010 2011 2012 2013 2014 2 Source: OECD Data.
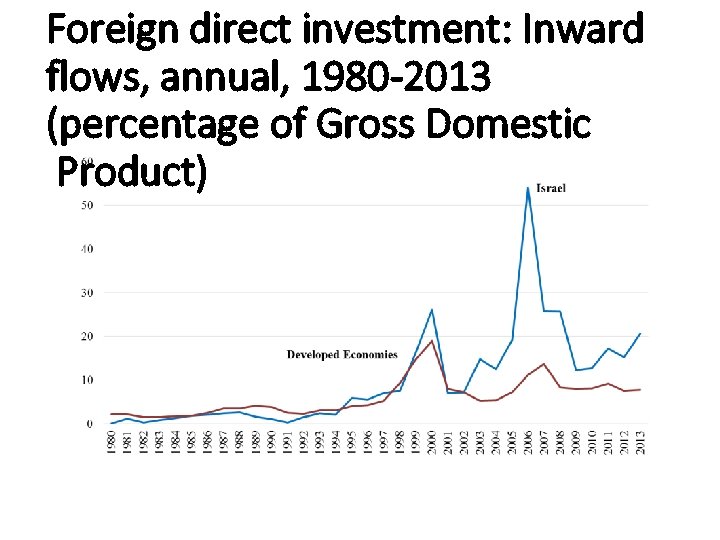
Foreign direct investment: Inward flows, annual, 1980 -2013 (percentage of Gross Domestic Product)
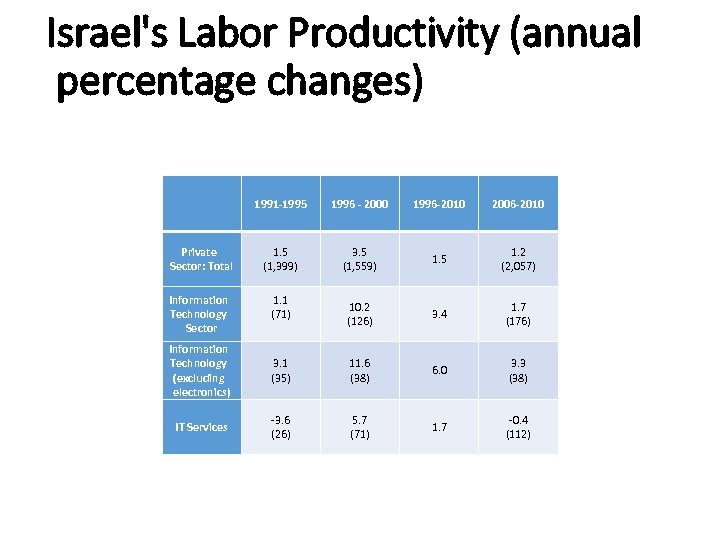
Israel's Labor Productivity (annual percentage changes) 1991 -1995 1996 - 2000 1996 -2010 2006 -2010 Private Sector: Total 1. 5 (1, 399) 3. 5 (1, 559) 1. 5 1. 2 (2, 057) Information Technology Sector 1. 1 (71) 10. 2 (126) 3. 4 1. 7 (176) Information Technology (excluding electronics) 3. 1 (35) 11. 6 (38) 6. 0 3. 3 (38) IT Services -3. 6 (26) 5. 7 (71) 1. 7 -0. 4 (112)

Thank You!
324a028fc358995e96dfaf701f477f2d.ppt