поиск данных 2014_А.pptx
- Количество слайдов: 58


. Exports and imports of services and financial assets included in the")
INVISIBLE EXPORTS (IMPORTS). Exports and imports of services and financial assets included in the balance of international payments of the country. Include the delivery of merchandises, banking services, royalties, insurance, income, rent, bank interest, dividends, tourist expenditures. INTERNATIONAL STATISTICS. The branch of statistics, which studies the level, structure and trends of socio-economic development of various countries. Is based on ensuring international comparability of socio-economic indicators. Specialized statistical bureaus of the UN play the leading role in international statistics. HOTEL BUSINESS - the activity of legal entities and individual entrepreneurs who have vested or possesses in the prescribed manner the property rights to any collective accommodation facilities for the direct disposal and management, for providing accommodation and services for citizens, as well as other activities of the organization and provision of hotel services including their implementation.

While counting income from international tourism, it is usually very difficult to single out individual travel costs, which are spent in the host country, especially if payments are made in cash. The possible solution can be a query of foreign visitors. In Europe, the hotel provides its customers the opportunity to complete a questionnaire in which, in addition to issues relating to the quality of service in a particular hotel, there are those questions, the answers to which (including costs) will then be treated by local statistical offices or consulting companies.

As a rule, the data required cannot be found in cases: • of unavailability to get access to real (physical) data banks • of supernormal specification of request • if the researcher applies for definitely new data • If the required information makes state or trade secret
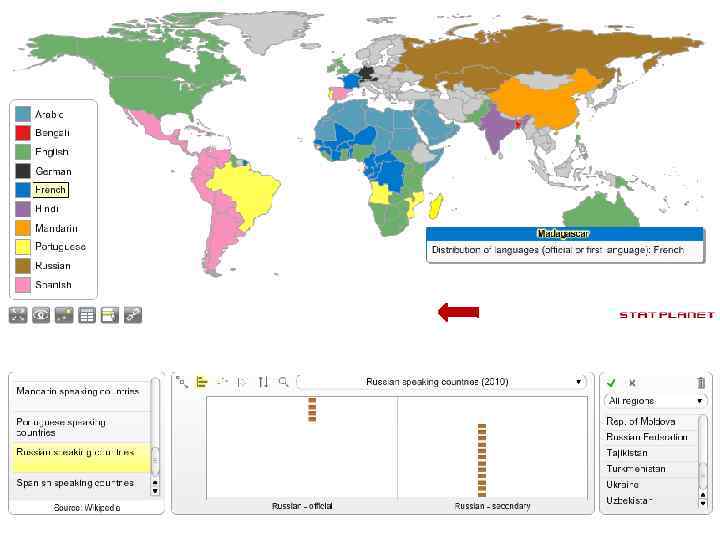
 http: //www. statsilk. com/maps/language-distribution-interactive-world-map")
Language distribution interactive world map (official or first language) http: //www. statsilk. com/maps/language-distribution-interactive-world-map

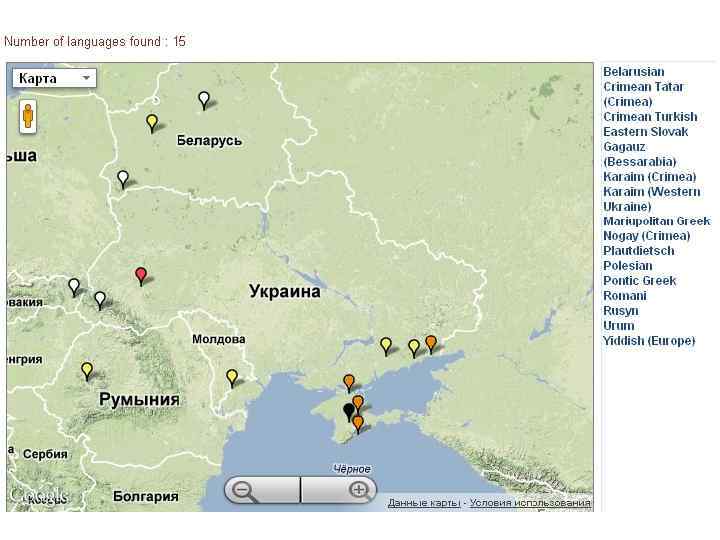
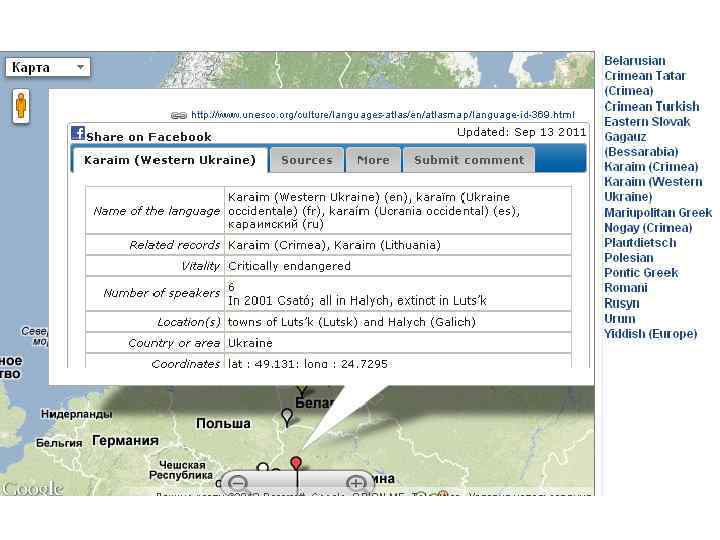
http: //www. unesco. org/culture/languages-atlas/
, French language expert.")
Antoine МЕILLЕT (1866– 1936), French language expert.

«Language-tree divergence times support the Anatolian theory of Indo-European origin R. Gray, Q. Atkinson Nature, 2003» The origin of the Indo-European language family is "the most intensively studied, yet still most recalcitrant, problem of historical linguistics”. Numerous genetic studies of Indo-European origins have also produced inconclusive results. Here we analyse linguistic data using computational methods derived from evolutionary biology. We test two theories of Indo-European origin: the 'Kurgan expansion' and the 'Anatolian farming' hypotheses. The Kurgan theory centres on possible archaeological evidence for an expansion into Europe and the Near East by Kurgan horsemen beginning in the sixth millennium BP. In contrast, the Anatolian theory claims that Indo-European languages expanded with the spread of agriculture from Anatolia around 8, 000– 9, 500 years bp. In striking agreement with the Anatolian hypothesis, our analysis of a matrix of 87 languages with 2, 449 lexical items produced an estimated age range for the initial Indo-European divergence of between 7, 800 and 9, 800 years bp. These results were robust to changes in coding procedures, calibration points, rooting of the trees and priors in the bayesian analysis. Language-tree divergence by R. Gray & Q. Atkinson
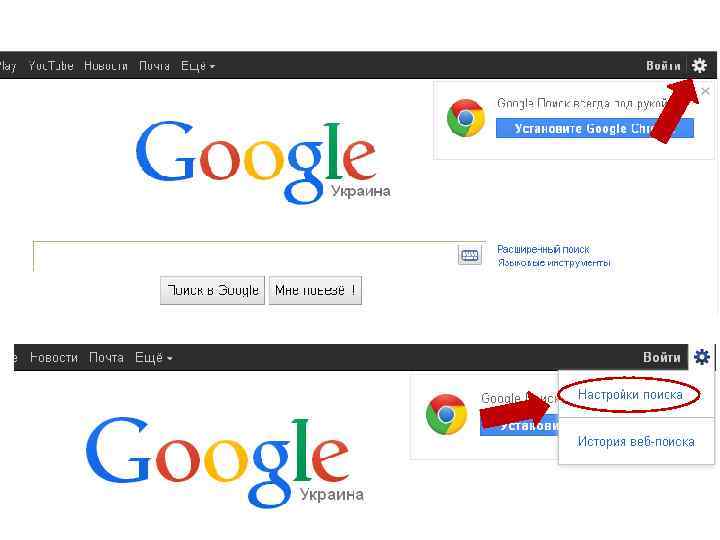
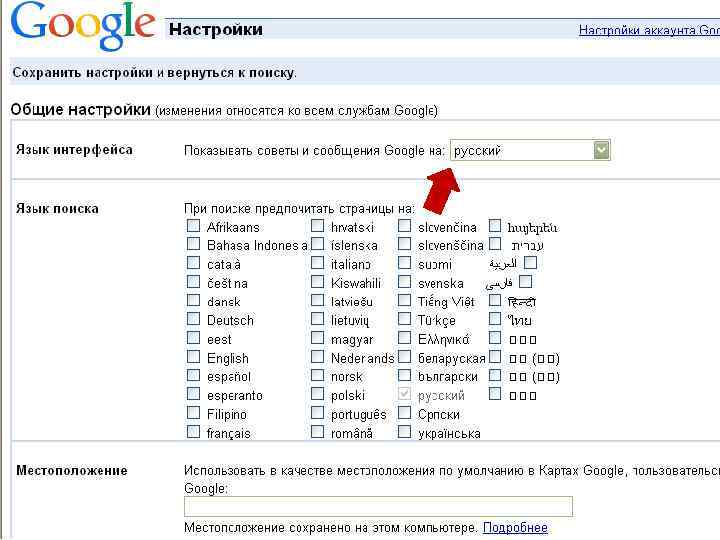

http: //www. google. ru/advanced_search http: //www. google. ru/preferences? hl=ru

Google domains for local search http: //en. wikipedia. org/wiki/List_of_Google_do mains Country domains http: //www. worldstandards. eu/other/tlds/

http: //www. google. ca/

For Ukrainian domain

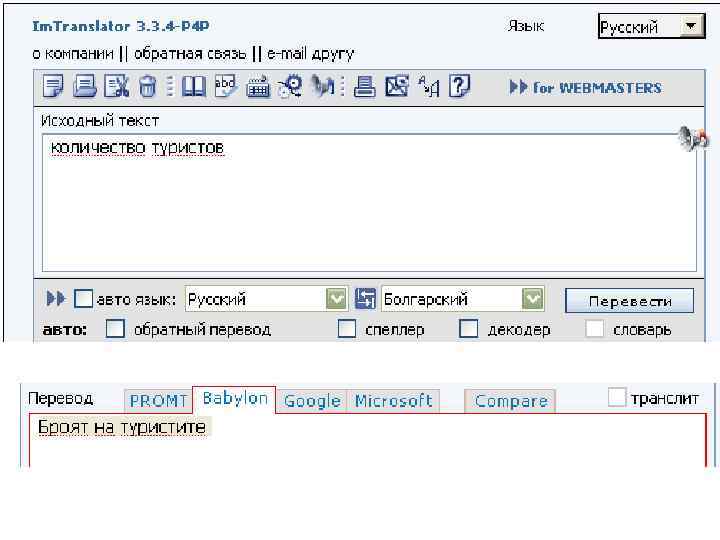
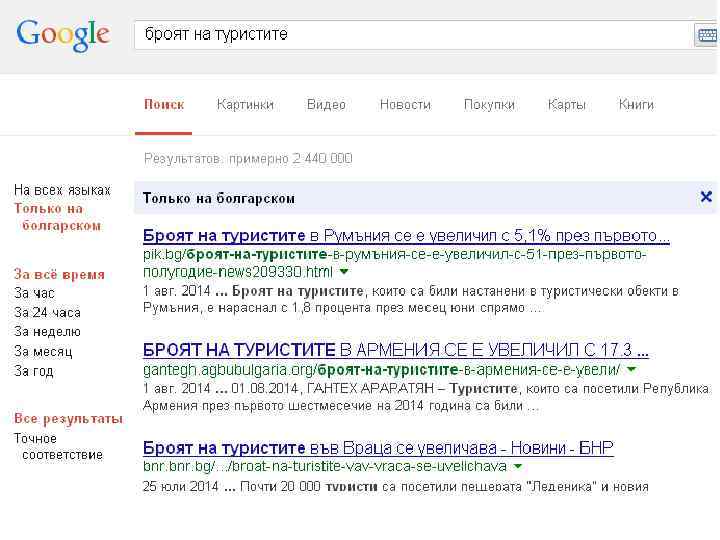
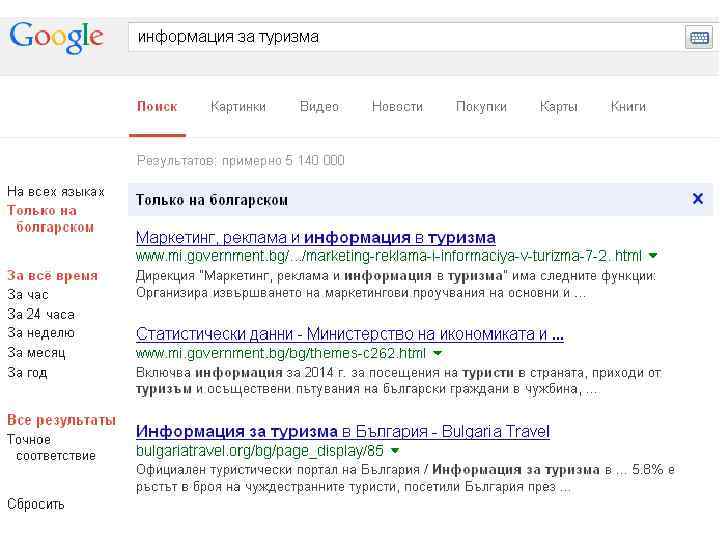
Term «International tourism» mednarodni turizem turystyka międzynarodowa міжнародны турызм mezinárodního cestovního ruchu международен туризъм Language Slovenian Polish Byelorussian Czech Bulgarian medzinárodného cestovného ruchu Slovak међународни туризам Serbian međunarodni turizam Croatian міжнародний туризм Ukrainian

http: //www. internetworldstats. com/top 20. htm
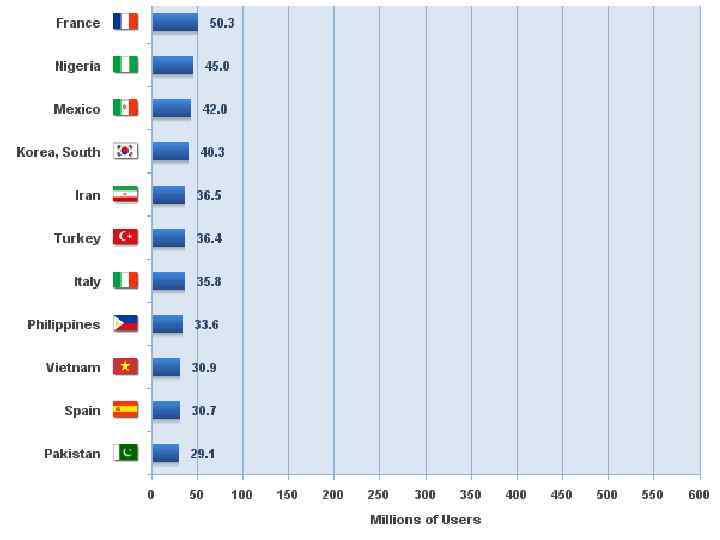
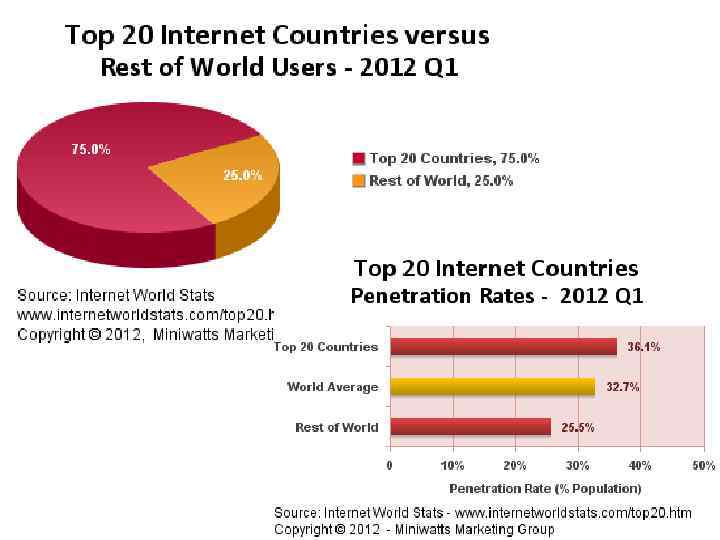
 1 China")
Population, Internet Users Penetration 2011 Est Year 2000 Latest Data (% Population) 1 China 1, 336, 718, 015 22, 500, 000 513, 100, 000 38. 4 % 2 United States 313, 232, 044 95, 354, 000 245, 203, 319 78. 3 % 3 India 1, 189, 172, 906 5, 000 121, 000 10. 2 % 4 Japan 126, 475, 664 47, 080, 000 101, 228, 736 80. 0 % 5 Brazil 194, 037, 075 5, 000 81, 798, 000 42. 2 % 6 Germany 81, 471, 834 24, 000 67, 364, 898 82. 7 % 7 Russia 138, 739, 892 3, 100, 000 61, 472, 011 44. 3 % 8 Indonesia 245, 613, 043 2, 000 55, 000 22. 4 % 9 United Kingdom 62, 698, 362 15, 400, 000 52, 731, 209 84. 1 % 10 France 65, 102, 719 8, 500, 000 50, 290, 226 77. 2 % 11 Nigeria 170, 123, 740 200, 000 45, 039, 711 26. 5 % 12 Mexico 115, 017, 631 2, 712, 400 42, 000 36. 5 % 13 Korea 48, 754, 657 19, 040, 000 40, 329, 660 82. 7 % 14 Iran 77, 891, 220 250, 000 36, 500, 000 46. 9 % 15 Turkey 78, 785, 548 2, 000 36, 455, 000 46. 3 % 16 Italy 61, 016, 804 13, 200, 000 35, 800, 000 58. 7 % 17 Philippines 101, 833, 938 2, 000 33, 600, 000 33. 0 % 18 Vietnam 90, 549, 390 200, 000 30, 858, 742 34. 1 % 19 Spain 46, 754, 784 5, 387, 800 30, 654, 678 65. 6 % 20 Pakistan 187, 342, 721 133, 900 29, 128, 970 15. 5 % TOP 20 Countries 4, 731, 331, 987 273, 058, 100 1, 709, 555, 160 36. 1 % Rest of the World 2, 235, 794, 808 87, 927, 392 570, 154, 469 25. 5 % Total World - Users 6, 967, 126, 795 360, 985, 492 2, 279, 709, 629 32. 7 % # Country or Region World % Users 22. 5 % 10. 8 % 5. 3 % 4. 4 % 3. 6 % 3. 0 % 2. 7 % 2. 4 % 2. 3 % 2. 2 % 2. 0 % 1. 8 % 1. 6 % 1. 5 % 1. 4 % 1. 3 % 75. 0 % 25. 0 % 100. 0 %
 World Internet User Statistics were updated for March 31, 2012. (2) Additional")
NOTES: (1) World Internet User Statistics were updated for March 31, 2012. (2) Additional data for individual countries and regions may be found by clicking each country name. (3) The most recent user information comes from data published by Nielsen Online, International Telecommunications Union, Official country reports, and other trustworthy research sources. (6) Data from this site may be cited, giving due credit and establishing an active link back to Internet World Stats. Copyright © 2012, Miniwatts Marketing Group. All rights reserved.

http: //www. internetworldstats. com/stats 7. htm

Top Ten Languages Used in the Web ( Number of Internet Users by Language ) Internet Growth Internet World Population TOP TEN LANGUAGES Internet Users Penetration in Internet Users for this Language IN THE INTERNET by Language (2000 - 2011) % of Total (2011 Estimate) English 565, 004, 126 43. 4 % 301. 4 % 26. 8 % 1, 302, 275, 670 Chinese 509, 965, 013 37. 2 % 1, 478. 7 % 24. 2 % 1, 372, 226, 042 Spanish 164, 968, 742 39. 0 % 807. 4 % 7. 8 % 423, 085, 806 Japanese 99, 182, 000 78. 4 % 110. 7 % 4. 7 % 126, 475, 664 Portuguese 82, 586, 600 32. 5 % 990. 1 % 3. 9 % 253, 947, 594 German 75, 422, 674 79. 5 % 174. 1 % 3. 6 % 94, 842, 656 Arabic 65, 365, 400 18. 8 % 2, 501. 2 % 3. 3 % 347, 002, 991 French 59, 779, 525 17. 2 % 398. 2 % 3. 0 % 347, 932, 305 Russian 59, 700, 000 42. 8 % 1, 825. 8 % 3. 0 % 139, 390, 205 Korean 39, 440, 000 55. 2 % 107. 1 % 2. 0 % 71, 393, 343 TOP 10 LANGUAGES 1, 615, 957, 333 36. 4 % 421. 2 % 82. 2 % 4, 442, 056, 069 Rest of the Languages 350, 557, 483 14. 6 % 588. 5 % 17. 8 % 2, 403, 553, 891 2, 099, 926, 965 30. 3 % 481. 7 % 100. 0 % 6, 930, 055, 154 WORLD TOTAL

The most widespread free resources Primary, ie requiring processing by a researcher Reports of international organizations Data from national statistical offices Issues of public institutions Recommendations of consulting companies Digital library resources Materials of specialized sites "Unscientific" materials (journalistic publications, opinions on the issue, drawn from alternative sources, tips and discussions on online forums, etc. ) • Annual reports of joint stock companies • •
 • Monographs (monographic issues) • Textbooks and teaching aids • Publications in")
Secondary (preprocessed) • Monographs (monographic issues) • Textbooks and teaching aids • Publications in scientific journals (articles, absrtacts) • Analyzes, "equivalent" to scientific publications

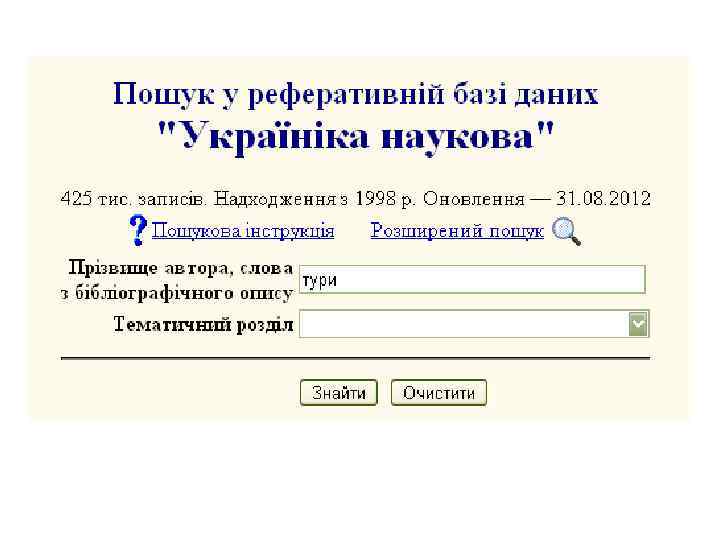
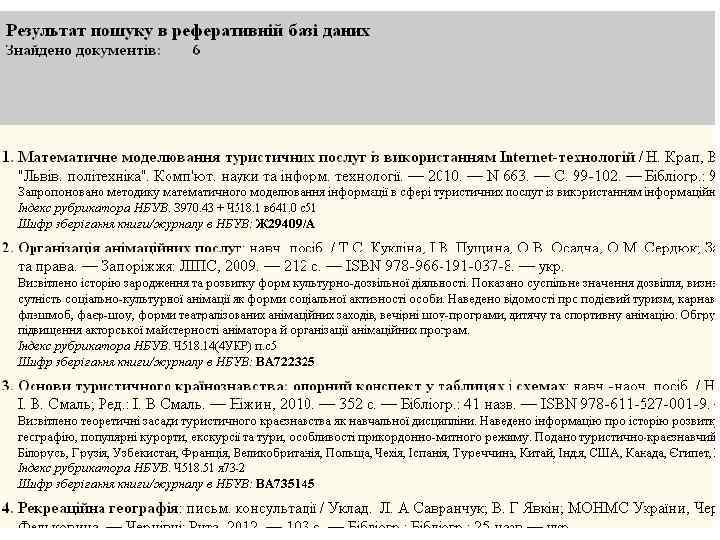
http: //www. nbuv. gov. ua/

http: //www. doaj. org/

http: //www. phocuswright. com/


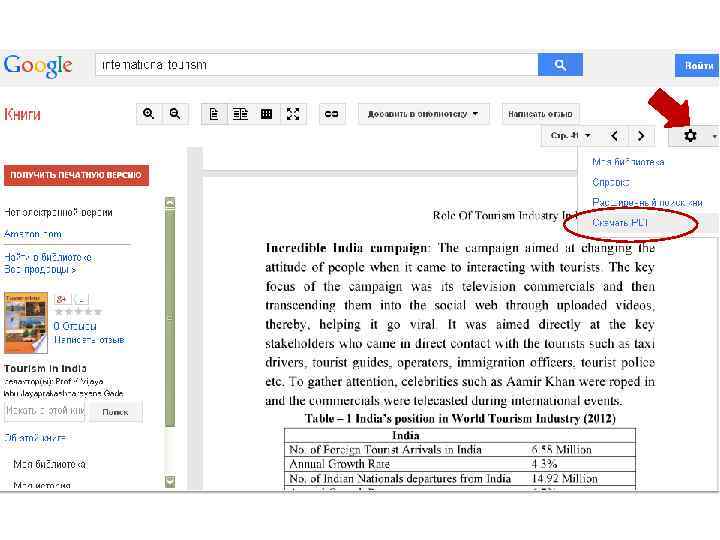
books. google. com

The number of references References by types Share, % The number of items Monographs 15 8 11 14 Textbooks 20 10 14 18 Periodicals 20 10 14 18 Legal documents including state and industry standards 20 10 14 18 15 8 11 14 10 100 4 50 6 70 8 90 Official reports of organizations, published statistics Others Total references

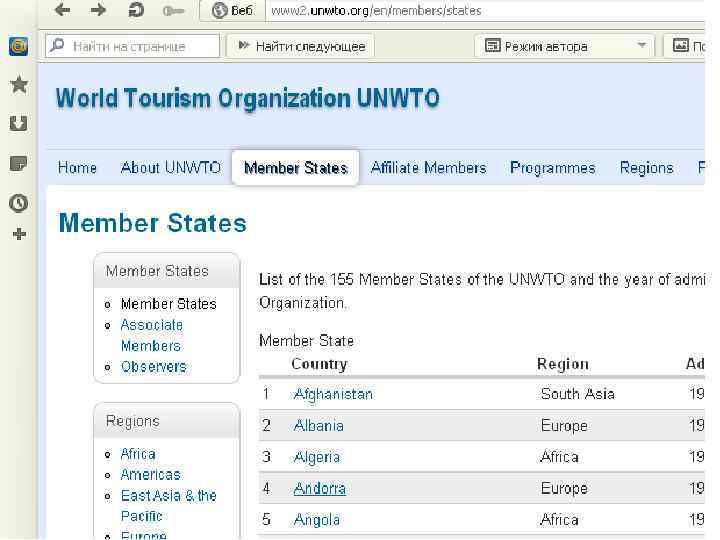
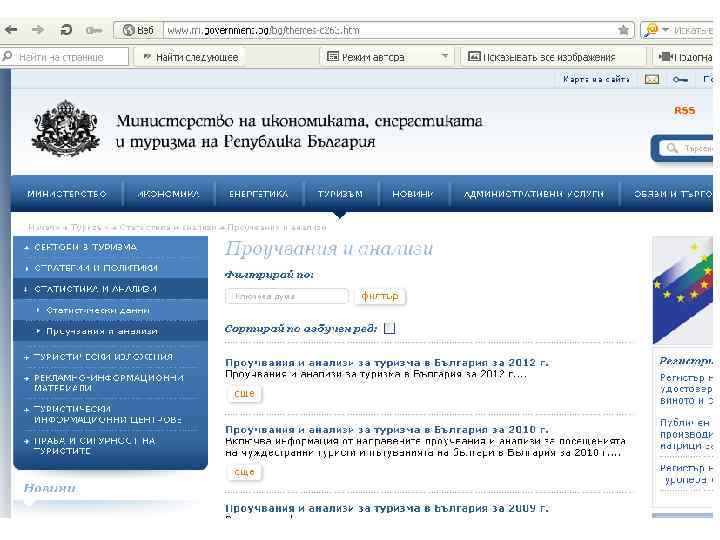
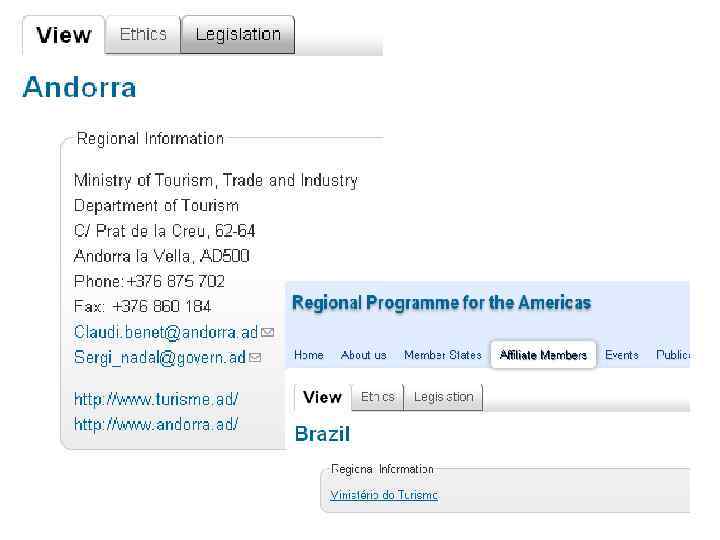
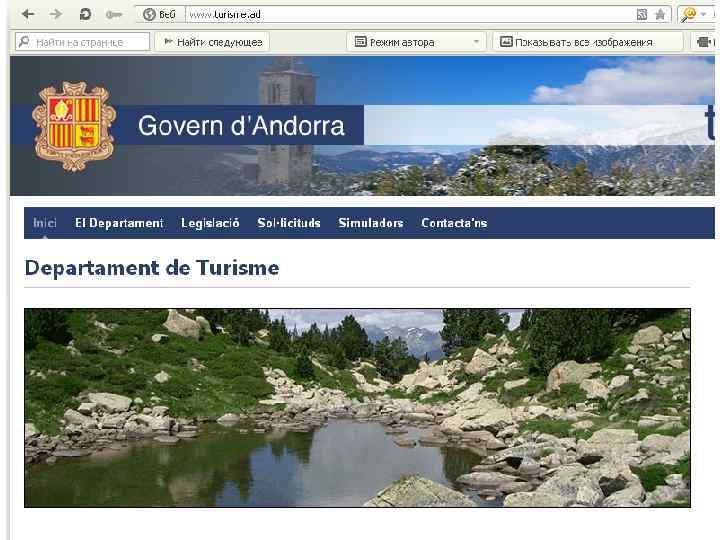
http: //www. ukrstat. gov. ua/ http: //www. wttc. org/ http: //www 2. unwto. org/en/ http: //data. un. org/ http: //data. worldbank. org/
поиск данных 2014_А.pptx