Errors and Uncertainties Lecture.pptx
- Количество слайдов: 20


Introduction to Laboratory Treatment of Uncertainties

Lecture Outline 1. Introduction to Physics Laboratory 2. Errors / Uncertainties in Measurements 3. Random and Systematic Errors 4. Estimating Random Experimental Errors 5. Combining Experimental Errors 2

1. Introduction to Labs § Your lab book must be submitted at the end of the lab session. § Your report must be structured • Introduction / Aim of the experiment • Apparatus • Experimental results (including tables and graphs) • Answers to the questions in the lab instructions • Uncertainty analysis • Conclusion 3

2. Error / Uncertainty in Measurements 4

Why are errors important? 5

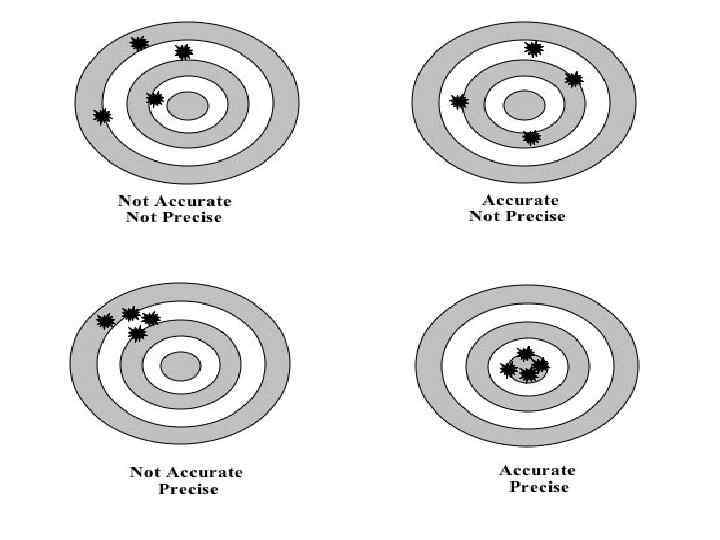
Accuracy and precision § Accuracy: The degree to which the result of a measurement, calculation conforms to the correct value or a standard => accuracy is the measure of exactness § Precision: Refinement in a measurement, calculation, as represented by the number of digits given => precision is the measure of reproducibility or consistency 6

3. Random and Systematic Errors Random Error § Varies between successive measurements of the same quantity § Is equally likely to be positive or negative § Can be reduced by measuring the same quantity several times and taking the average (or the mean) Systematic Error § § Affects each reading in the same way Can result from incorrectly calibrated equipment Cannot be reduced by repeating the same measurement Difficult to identify you can suggest a possible source 8

Random and systematic errors - example True value Random errors only Random + systematic § A result is said to be accurate if it is relatively free from systematic errors § A result is said to be precise if the random error is small 9
 § Digital meter: reading error is usually taken")
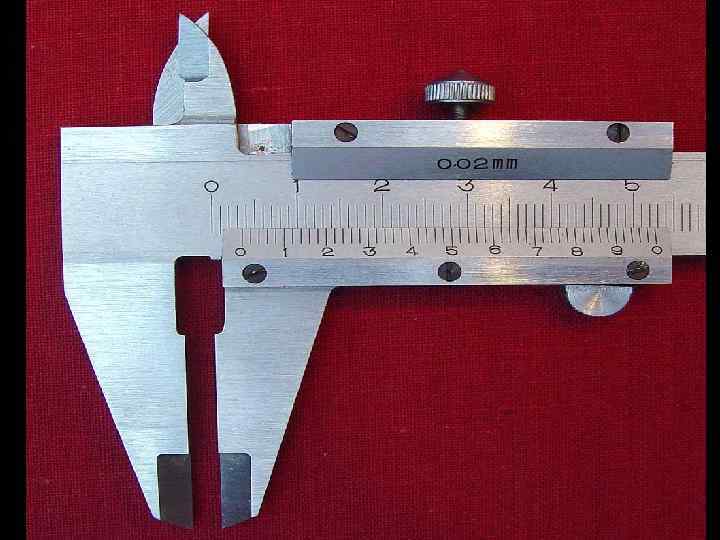
4. Estimating Random Errors (Single Reading) § Digital meter: reading error is usually taken as V = (3. 36± 0. 01) V § Linear / Vernier Scale: reading error is usually taken as the smallest scale division L = (16. 7 ± 0. 1) cm 16 17 10
 § When you have several measurements of the same")
Estimating random errors (multiple readings) § When you have several measurements of the same quantity, the best estimate is the average (mean) § The random error can be estimated from the minimum and maximum value 12
 T (s) 1. 853 1. 861 1. 831 Best")
Estimating random errors (multiple readings) T (s) 1. 853 1. 861 1. 831 Best estimate is the average of the 10 readings of T which gives T = 1. 848 s The uncertainty, ΔT, can be found from 1. 842 1. 854 1. 847 1. 859 1. 850 Hence, T = (1. 848 ± 0. 015) s 1. 852 13 1. 833

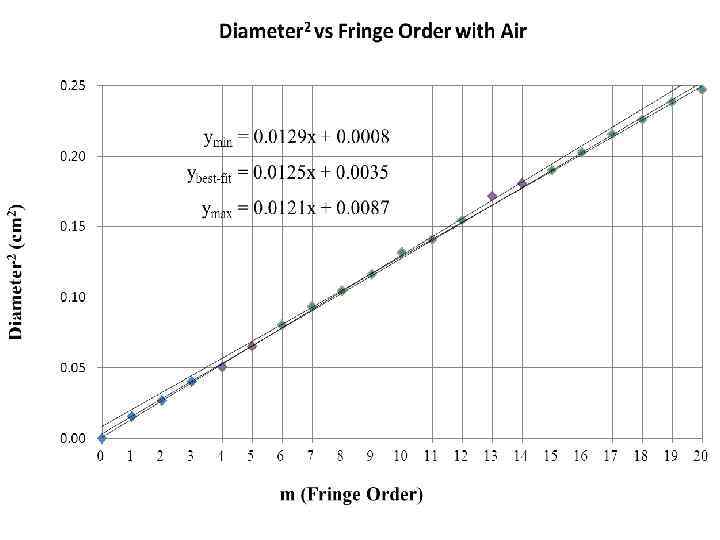
Estimating random errors from a graph § When two quantities are proportional, you can estimate (visually or using Excel) the random error of the gradient of the best-fit line as follows: § 1) Draw a best-fit line and calculate the gradient G § 2) Draw two lines of minimum (Gmin) and maximum (Gmax) gradients § 3) Estimate the uncertainty in the gradient ΔG as: § Note that gradients usually have a dimension (hence a 14 unit)
 § When variables are multiplied or divided, fractional uncertainties")
5. Combining Experimental Errors (1) § When variables are multiplied or divided, fractional uncertainties are added § is called the fractional uncertainty in A § It has no dimension 16
 § When variables are added or subtracted, absolute uncertainties are")
Combining Experimental Errors (2) § When variables are added or subtracted, absolute uncertainties are added § is called the absolute uncertainty in A § It has the same dimension as A 17
 § Suppose we want to estimate the acceleration due to")
Example 1 (Simple Pendulum) § Suppose we want to estimate the acceleration due to gravity, g, using a simple pendulum and we estimated: - the period T = (1. 848 ± 0. 015) s from multiple readings - the length L = (0. 95 ± 0. 05) m § Calculate the value of g and its estimated absolute random uncertainty 18

Example 1, cont. § Knowing the true value of g at the Earth’s surface, what can you conclude about random and systematic errors? 19

Example 1, cont. § You then realized that you did not use the ruler appropriately and that the length should be L = (0. 85 ± 0. 05) m § Recalculate g and conclude 20
Errors and Uncertainties Lecture.pptx