
Introduction to Business Management: Statistics Class 1.


topic_1_nature_of_the_data.ppt
- Размер: 302 Кб
- Количество слайдов: 25
Описание презентации Introduction to Business Management: Statistics Class 1. по слайдам
Introduction to Business Management: Statistics Class 1. Topic 1. Nature of the data. Data collection.
Planned 1. 1 Statistical process and its stages. 1. 2 Primary and secondary data. 1. 3 Data collection process. A census. 1. 4 Survey sampling. 1. 5 Designed experiment.
Statistics in business Descriptive Statistics Inferential Statistics. The branch of mathematics that transforms data into useful information for decision makers Collecting, summarizing, presenting and analyzing data Using data collected from a small group to draw conclusions about a larger group
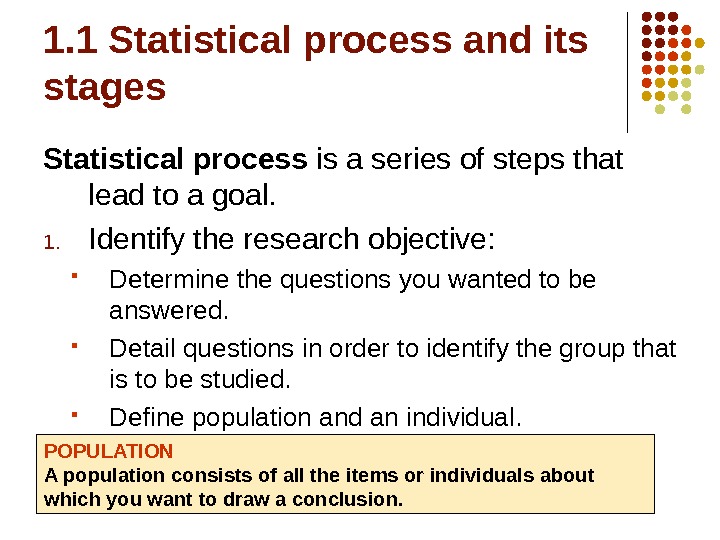
1. 1 Statistical process and its stages Statistical process is a series of steps that lead to a goal. 1. Identify the research objective: Determine the questions you wanted to be answered. Detail questions in order to identify the group that is to be studied. Define population and an individual. POPULATION A population consists of all the items or individuals about which you want to draw a conclusion.
1. 1 Statistical process and its stages Statistical process is a series of steps that lead to a goal. 1. Identify the research objective. 2. Collect the information needed to answer the question: Define population and a sample. Calculate the number of individuals included into the sample. Prepare a questionnaire. Ask individuals and fix answers. SAMPLE A sample is the portion of a population selected for analysis.
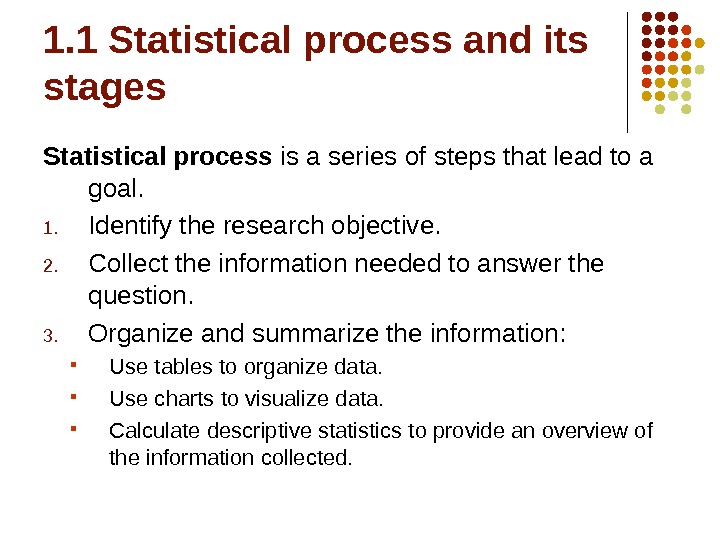
1. 1 Statistical process and its stages Statistical process is a series of steps that lead to a goal. 1. Identify the research objective. 2. Collect the information needed to answer the question. 3. Organize and summarize the information: Use tables to organize data. Use charts to visualize data. Calculate descriptive statistics to provide an overview of the information collected.
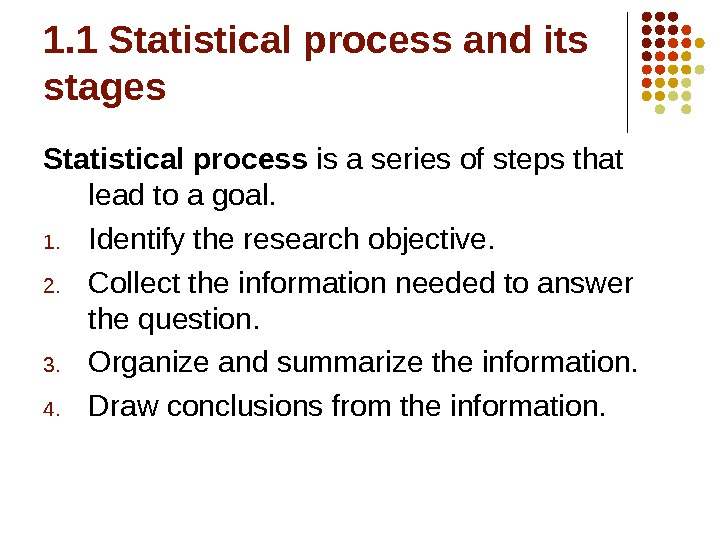
1. 1 Statistical process and its stages Statistical process is a series of steps that lead to a goal. 1. Identify the research objective. 2. Collect the information needed to answer the question. 3. Organize and summarize the information. 4. Draw conclusions from the information.
Practice Identify the population, sample, individual for each research objective: 1. A quality control manager randomly selects 50 bottles of Coca-Cola that were filled in September, 5 to assess the calibration of filling machine. 2. A farmer wanted to learn about the weight of his soybean crop. He randomly sampled 100 plants and weighted the soybeans on each plant.
Terms and Definitions Data represents information, usually numerical or categorical. A variable is a characteristic of an item or individual. So, a list of observed values for a variable is data.
Types of variables Variables Categorical (qualitative) Numerical (quantitative) Discrete Continuous. Examples: Marital Status Political Party Eye Color (Defined categories) Examples: Number of Children Defects per hour (Counted items) Examples: Weight Voltage (Measured characteristics)
Sources of data A census Survey sampling (observational study) Designed experiments
1. 2 Primary and secondary data Primary Sources : The data collector is the one using the data for analysis Data from a political survey Data collected from an experiment Observed data Secondary Sources : The person performing data analysis is not the data collector Analyzing census data Examining data from print journals or data published on the internet.
1. 3 Data collection process. A census A modern Population Census is a total process of collecting, compiling and publishing demographic, economic and social data pertaining to all persons in a country at a specified time. The Census is a complete count of the population and provides detailed bench-mark data on the size of the population, age structure, educational attainment, labour force and socio-economic characteristics.
1. 4 Survey sampling describes the process of selecting a sample of elements from a target population in order to conduct a survey. The purpose of sampling is to reduce the cost and/or the amount of work that it would take to survey the entire target population. A survey that measures the entire target population is called a census.
Examples of Survey Data Political polls of registered voters during political campaigns. People being surveyed to determine their satisfaction with a recent product or service experience.
Types of questions for the survey Single-select multiple choice Multi-select multiple choice Rating on a scale Ranking items numerically Open-ended text MORE EXAMPLES of QUESTIONS
Observational study Data obtained from a survey sample or census lead to an observational study , … which measures the characteristics of a population by studying individuals in a sample, but does not attempt to manipulate the variable of interest.
1. 5 Designed experiment A designed experiment applies a treatment to individuals (experimental units) and attempts to isolate the effects of the treatment on a response variable.
Examples of Data From A Designed Experiment Consumer testing of different versions of a product to help determine which product should be pursued further. Material testing to determine which supplier’s material should be used in a product. Market testing on alternative product promotions to determine which promotion to use more broadly.
Experiment or Observational study? Observational study To learn characteristics of a population To determine whethere is a relation between two variables Experiment To identify certain cause and effect relationship among variables of the study To isolate the cause of the relation between two variables
Assess your understanding Explain the difference between a population and a sample. Give 5 examples of qualitative and quantitative variables. True or false: Both discrete and continuous variables are quantitative variables? True or False: A population is the totality of items or things under consideration.
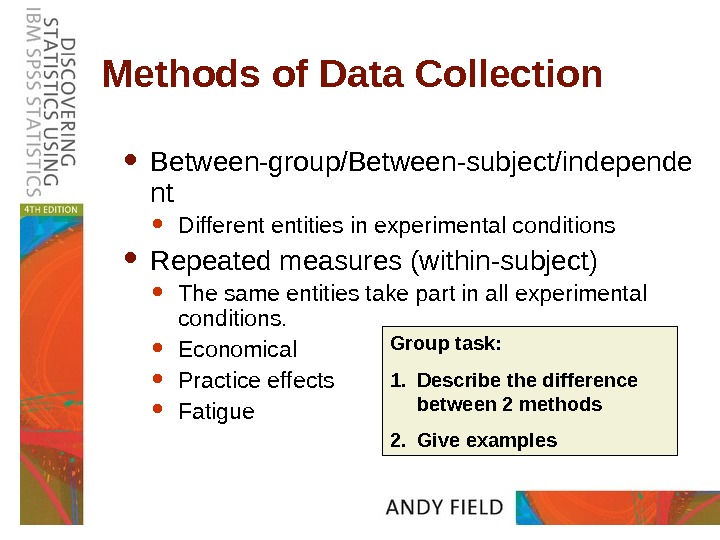
Methods of Data Collection Between-group/Between-subject/independe nt Different entities in experimental conditions Repeated measures (within-subject) The same entities take part in all experimental conditions. Economical Practice effects Fatigue Group task: 1. Describe the difference between 2 methods 2. Give examples
Class Assignment #1 Select your favorite brand / company (Ex. Pepsi-Cola or Pepsi. Co Inc. ) for survey organization. Select the goal of the survey (Ex. customer satisfaction, website satisfaction, product review etc. ) Write 10 questions for the survey (different types of questions should be presented) For each question indicate the level of measurement and whether the variable is qualitative / quantitative (discrete / continuous) 10 minutes / 10% to the total grade
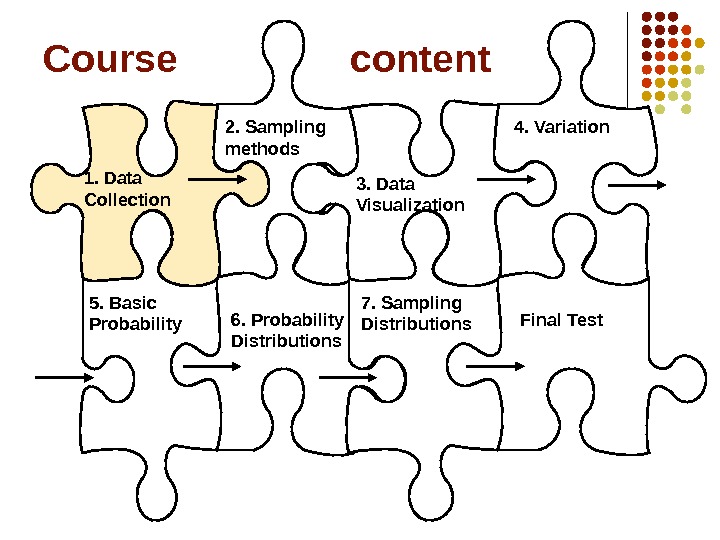
Course content 1. Data Collection 2. Sampling methods 3. Data Visualization 4. Variation 5. Basic Probability 6. Probability Distributions 7. Sampling Distributions Final Test
Home reading LSKB (six edition), pages 32 -48 Andy Field, ch. 1, from 1. 1 till 1. 5. 5. 1, pages 1 —