

3ccc424775ffcac5e668d52bc2591195.ppt
- Количество слайдов: 96
 Institute of Microbiology Chinese Academy of Sciences") Introduction to 2 D LCMS/MS (Yuanming Luo) Institute of Microbiology Chinese Academy of Sciences
Introduction to 2 D LCMS/MS (Yuanming Luo) Institute of Microbiology Chinese Academy of Sciences
 Fully integrated 2 D-LC/ion trap MS
 Hardware Improvement ---- New Orthogonal Ion Source New Endcap Electrodes Entrance Lens Square Quadrupole Attomole Sensitivity !!! New Inter-Octapole Lens
") 1 D-strong cation exchange column (Biobasic SCX)
1 D-strong cation exchange column (Biobasic SCX)
 Pressure cell
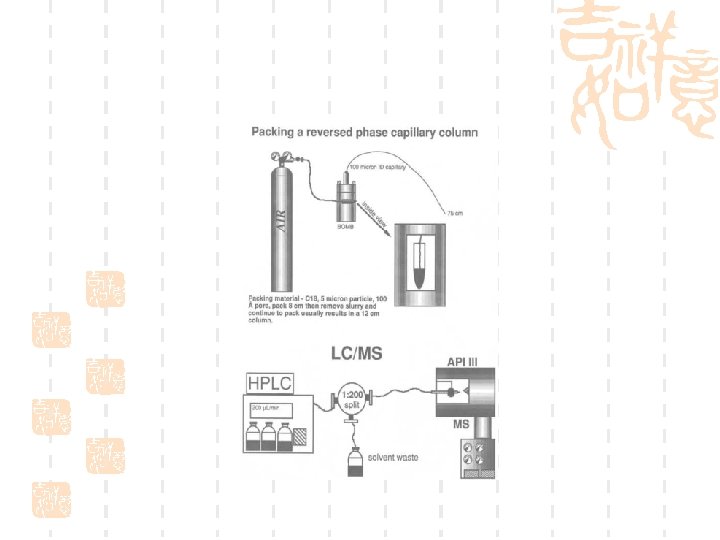
 Xcalibur-control the instrument
 Bioworks 3. 1 -database search software package containing SEQUEST
 Application of 2 D LC-MS/MS Ø Molecular weight determination Ø 2 D gel spots (especially the spots that can’t be identified by PMF analysis) Ø Protein complex (after primary factionation) Ø Proteome separation and identification Ø Multi-dimensional liquid chromatography MS-based differential proteomics Ø Quantitative proteomics (including ICAT or stable isotope labeling-based differential proteome analysis)
 Molecular weight determination of myoglobin by BIOMASS Calculation
 Mr: 16951. 38+ /-0. 33
 High throughput gel spot analysis
 Tandem RP Columns
 Automated Protein Identification of 2 -D gel spots Sensitivity and Throughput !!! ? Digest SEQUEST Cross-Correlation Comparison Protein identified
 High throughput gel spot analysis 1. Protein mixture is separated by 2 D gel electrophoresis 2. Excise target gel spot 3. Perform in-gel digestion with trypsin. 4. Extract peptides from gel spot. 5. Run peptide mixture with Proteome. X in 1 D High Throughput mode.
 Analysis of 2 D Gel Spots Using Proteome. X High Throughput Method RT: 0. 00 - 102. 10 Spot 1 100 50 Found t-PA 22. 49 13. 98 10. 92 28. 29 74. 38 51. 42 42. 27 66. 11 0 2 100 13. 77 50 0 100 3. 68 19. 53 17. 20 21. 95 28. 64 22. 68 45. 20 51. 90 65. 73 Found t-PA 51. 85 23. 16 22. 05 41. 22 35. 66 Relative Abundance 4 50 0. 48 8. 82 0 100 5 50 4. 34 15. 18 6 50 1. 26 12. 70 0 100 7 50 8. 54 82. 75 97. 56 11. 13 82. 59 83. 90 100. 31 79. 67 72. 35 82. 29 95. 10 21. 83 34. 16 20. 55 23. 06 29. 58 17. 44 36. 77 43. 07 51. 89 65. 77 51. 72 80. 86 82. 44 100. 61 63. 93 Found t-PA 39. 32 35. 12 42. 52 70. 29 59. 20 65. 88 79. 87 82. 27 97. 30 61. 60 21. 90 19. 62 27. 77 37. 34 22. 74 21. 28 48. 81 51. 85 70. 37 51. 83 29. 56 44. 47 6 8 48. 00 63. 79 54. 56 70. 37 72. 64 81. 26 79. 86 81. 19 85. 70 84. 87 98. 74 92. 89 0 0 2 4 10 Time (min) 12 14 16 18 NL: 9. 02 E 6 Base Peak F: + c Full ms [ 300. 00 -2000. 00] MS gelspot_tpa 2_c 2 NL: 1. 16 E 7 Base Peak F: + c Full ms [ 300. 00 -2000. 00] MS gelspot_tpa 3_c 1 61. 76 0 100 70. 49 70. 58 40. 14 0 100 75. 40 61. 66 3 50 NL: 2. 39 E 7 Base Peak F: + c Full ms [ 300. 00 -2000. 00] MS Gel. Spot_t. PA 1_C 1 69. 67 20 NL: 1. 41 E 7 Base Peak F: + c Full ms [ 300. 00 -2000. 00] MS gelspot_tpa 4_c 2 NL: 2. 11 E 7 Base Peak F: + c Full ms [ 300. 00 -2000. 00] MS gelspot_tpa 5_c 1 NL: 1. 15 E 7 Base Peak F: + c Full ms [ 300. 00 -2000. 00] MS gelspot_tpa 6_c 2 NL: 8. 00 E 6 Base Peak F: + c Full ms [ 300. 00 -2000. 00] MS gelspot_tpa 7_c 1
 Global Protein Identification
 Global Protein Identification SCX column fractionation Protein mixture Reverse column separation Protein digests Auto MS/MS detection Results Bio. Works data base search Tandem MS spectra
 Plumbing Diagrams for Proteome X. 2 D-RP 2 column 1 D-SCX column 2 D-RP 1 column
 Global Protein Identification 1. Extract proteins from cell lysates 2. Reduce proteins to peptide fragments by tryptic digestion. 3. Analyze peptide mixture by 2 D LCMS/MS with Proteome. X. 4. Peptide and proteins identified by Turbo. SEQUEST software.
 Protease Digestion of Proteins
 1 D LC-MS/MS of proteins from A 431 cell lysates RT: 0. 00 - 600. 00 33. 95 431. 84 100 0 26. 66 652. 24 42. 92 1138. 32 100 Relative Abundance 50 0 50 100 117. 86 563. 10 138. 63 703. 32 14. 27 344. 05 17. 79 388. 10 0 50 NL: 1. 49 E 9 Base Peak MS a 431_240 mi ng_1029 240 min 432. 24 675. 17 341. 64 362. 07 382. 40 465. 75 675. 16 675. 25 675. 26 171. 60 226. 50 268. 84 294. 93 488. 12 1154. 56 794. 78 1285. 77 576. 29 520. 91 1912. 57 480 min 12. 29 390. 90 0 NL: 1. 28 E 9 Base Peak MS a 431_120 mi ng_1029 120 min 84. 72 200. 37 1154. 55 563. 16 118. 32 258. 97 431. 94 140. 05 228. 84 776. 40 1839. 77 269. 22 619. 48 444. 83 8. 40 439. 73 100 NL: 2. 65 E 9 Base Peak MS a 431_60 min g_1029 60 min 148. 78 371. 00 50 0 76. 43 667. 61 68. 71 50. 66 1160. 53 486. 92 100 0 30 min gradient 35. 12 1163. 80 50 NL: 2. 28 E 9 Base Peak MS A 431_30 min G_1029 50 113. 04 123. 05 926. 00 897. 74 100 150 200 250 300 Time (min) 350 400 450 524. 05 1511. 36 575. 63 444. 75 500 550 NL: 4. 60 E 8 Base Peak MS a 431_1213_ 8 hrg 600
 2 D LC-MS/MS of proteins from A 431 cell lysates
 Analysis of proteins from A 431 cell lysates Gradient 1 D # of Proteins Identified 30 min 16 60 min 22 120 min 44 240 min 56 480 min 105 Total Run Time 2 D # of Proteins Identified 5 hr. 144 10 hr. 337 20 hr. 491
 Yeast Protein separation 20 m. M Ammonium chloride, 40 m. M Ammonium chloride, 70 m. M Ammonium chloride, 100 m. M Ammonium chloride,
 Yeast Protein Separation 140 m. M Ammonium chloride, 180 m. M Ammonium chloride, 220 m. M Ammonium chloride,
 Yeast proteins
 Yeast proteins Protein # 1708
 2 D LC-MS/MS of Yeast proteins • Time: 15 hours • Gradient: 5 – 65% Acetonitrile in 2 hrs in each step • Proteins searched by Bioworks 3. 1 • Proteins identified: 1708 • Throughput: 113. 8 proteins/hr
 Viewing Results
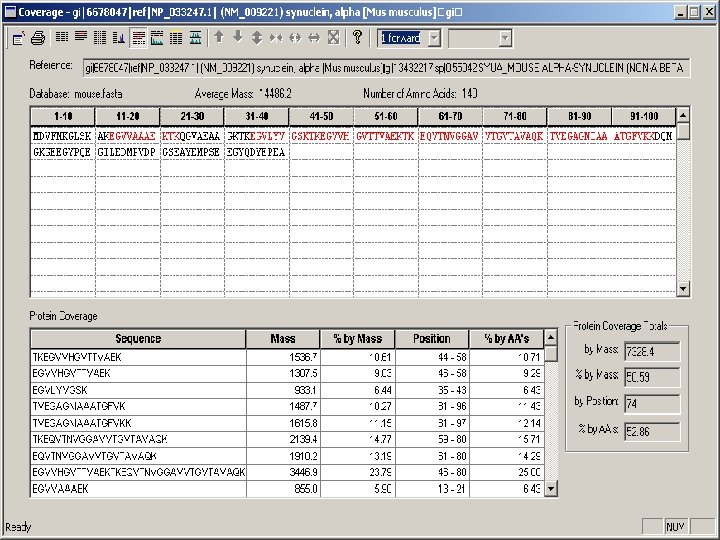
 TIC Synclein alpha
 Filters for SEQUEST Results Ø Ø Ø Xcorr:+1>1. 5, +2>2. 0, +3>2. 5 ∆CN: >0. 1 When three or fewer peptides for an individual protein passed the criteria (1) the spectrum quality (S/N, match rate) (2) some continuity must be present among the b or y fragments (3) if proline is predicted to be present, then the corresponding y fragment should give an intense peak. (4) unidentified intense peaks should be verified as being either doubly charged.
 Filters for SEQUEST Results
") On-Line Phosphopeptide Enrichment (IMAC capture)
On-Line Phosphopeptide Enrichment (IMAC capture)
-MS/MS System for the Analysis") Flow Path of an Automated 2 D (IMAC + RP)-MS/MS System for the Analysis of Phosphopeptides 1 D-IMAC Column 10 –port valve in mass spectrometer Pump 1 Sample valve injector 6 4 RP 2 1 3 RP 1 2 Column 1 SCX IMAC Injector Sample loop 5 Sample Pump To Waste Analytical Pump LCQ Deca XP Plus- mass spectrometer
Flow Path of an Automated 2 D (IMAC + RP)-MS/MS System for the Analysis of Phosphopeptides 1 D-IMAC Column 10 –port valve in mass spectrometer Pump 1 Sample valve injector 6 4 RP 2 1 3 RP 1 2 Column 1 SCX IMAC Injector Sample loop 5 Sample Pump To Waste Analytical Pump LCQ Deca XP Plus- mass spectrometer
MS/MS Analysis of Phosphopeptides Step 1: Load IMAC") Procedure Used for Automated 2 D LC(IMAC+RP)MS/MS Analysis of Phosphopeptides Step 1: Load IMAC column Step 2: Load peptides on IMAC column. Flow-through peptides captured by RP 2 column. Step 3: Wash IMAC column. The bound peptides are then eluted by phosphate buffer on to RP 1, while the flowthrough peptides trapped on RP 2 are being analyzed by LC/MS. Step 4: The bound phosphopeptides on RP 1 are analyzed by LC/MS/MS.
Procedure Used for Automated 2 D LC(IMAC+RP)MS/MS Analysis of Phosphopeptides Step 1: Load IMAC column Step 2: Load peptides on IMAC column. Flow-through peptides captured by RP 2 column. Step 3: Wash IMAC column. The bound peptides are then eluted by phosphate buffer on to RP 1, while the flowthrough peptides trapped on RP 2 are being analyzed by LC/MS. Step 4: The bound phosphopeptides on RP 1 are analyzed by LC/MS/MS.
-MS/MS System RP") Capture of FQ*SEEQQQTEDELQDK Phosphopeptide of -Casein Digest in the 2 D LC(IMAC+RP)-MS/MS System RP 2 column Non-phosphorylated peptides flow through IMAC column and captured by and eluted from RP 2 NL: 1. 34 E 9 position for m/z=1031. 7 on C 2 column RP 1 column Phosphorylated peptide (m/z=1031. 7, FQ*SEEQQQTEDELQDK) captured by IMAC column, bound to RP 1, and eluted. NL: 1. 80 E 8
Capture of FQ*SEEQQQTEDELQDK Phosphopeptide of -Casein Digest in the 2 D LC(IMAC+RP)-MS/MS System RP 2 column Non-phosphorylated peptides flow through IMAC column and captured by and eluted from RP 2 NL: 1. 34 E 9 position for m/z=1031. 7 on C 2 column RP 1 column Phosphorylated peptide (m/z=1031. 7, FQ*SEEQQQTEDELQDK) captured by IMAC column, bound to RP 1, and eluted. NL: 1. 80 E 8
 Neutral Loss Scanning Confirmed the Major Ion at m/z=1031. 6 as a P-peptide Neutral loss fragment (-49) MS/MS of 1031. 6 M+2 H+-49 Phosphorylated peptide (m/z=1031. 7, FQ*SEEQQQTEDELQDK)
 Bioworks 3. 1 Search Identified the P-peptide with m/z=1031. 6 as FQ*SEEQQQTEDELQDK 1+ (M+2 H)-49 2+ (M+2 H)-49
 ----Alternative method for differential") Proteins - Differential Expression (EGF treated and untreated cells) ----Alternative method for differential
Proteins - Differential Expression (EGF treated and untreated cells) ----Alternative method for differential
 Half stimulated") Protein differential expression 1. Divide A 431 cell sample in two: a) Half stimulated by EGF b) Half control 2. Lyse cells 3. Extract proteins from lysates 4. Digest with trypsin 5. Run 2 D LC-MS/MS of digests with Proteome. X 6. Proteins identified by Turbo. SEQUEST software 7. Compare “stimulated” vs. “control”
Protein differential expression 1. Divide A 431 cell sample in two: a) Half stimulated by EGF b) Half control 2. Lyse cells 3. Extract proteins from lysates 4. Digest with trypsin 5. Run 2 D LC-MS/MS of digests with Proteome. X 6. Proteins identified by Turbo. SEQUEST software 7. Compare “stimulated” vs. “control”
 Automated 2 D LC-MS/MS Analysis of Human A 431 Cell Proteins NH 4 Cl 0 m. M 60 m. M 10 m. M 80 m. M 20 m. M 120 m. M 40 m. M 160 m. M
 200 m. M") Automated 2 D-LC-LC/MS-MS Analysis of Human A 431 Cell Proteins (continued) 200 m. M 300 m. M 500 m. M 900 m. M Total Proteins Identified= 709, using Bioworks 3. 1 with Turbo. Sequest (Xcorr = 1. 5, 2. 0, and 3 for charge states +1, +2, and +3, respectively)
Automated 2 D-LC-LC/MS-MS Analysis of Human A 431 Cell Proteins (continued) 200 m. M 300 m. M 500 m. M 900 m. M Total Proteins Identified= 709, using Bioworks 3. 1 with Turbo. Sequest (Xcorr = 1. 5, 2. 0, and 3 for charge states +1, +2, and +3, respectively)
 Proteins Differentially Expressed in Control and EGFStimulated A 431 Cells
 *Only those proteins") Proteins Differentially Expressed in Control and EGF-Stimulated A 431 Cells (continued) *Only those proteins with two or more peptides identified were compared
Proteins Differentially Expressed in Control and EGF-Stimulated A 431 Cells (continued) *Only those proteins with two or more peptides identified were compared
 Proteins Identified in Both Control and EGF-Treated A 431 Cells
") Proteins Common to Control and EGF-treated A 431 Cells (continued)
Proteins Common to Control and EGF-treated A 431 Cells (continued)
") Proteins Common to Control and EGFtreated A 431 Cells (continued)
Proteins Common to Control and EGFtreated A 431 Cells (continued)
 Differential Protein quantitation -quantitative proteomics
 for quanlitative proteomics Ø Metabolic labeling (13 C, 15 N)") Stable isotope labeling (SIL) for quanlitative proteomics Ø Metabolic labeling (13 C, 15 N) Ø Post-biosynthetic labeling (ICAT reagent) Ø Post-digest isotope Labeling of tryptic peptides(18 O)
Stable isotope labeling (SIL) for quanlitative proteomics Ø Metabolic labeling (13 C, 15 N) Ø Post-biosynthetic labeling (ICAT reagent) Ø Post-digest isotope Labeling of tryptic peptides(18 O)
![Metabolic labeling with [13 C 6]Arg in the elucidation of EGF signaling Ø Cells](https://present5.com/presentation/3ccc424775ffcac5e668d52bc2591195/image-53.jpg "Metabolic labeling with [13 C 6]Arg in the elucidation of EGF signaling Ø Cells") Metabolic labeling with [13 C 6]Arg in the elucidation of EGF signaling Ø Cells were grown in medium containing either normal or [13 C 6] arginine. Ø 8 h of serum starvation, the labeled cells were stimulated with 150 ng/ml EGF for 10 min, whereas the unlabeled cells were left untreated. Ø Cells were lysed and combined in a 1: 1 ratio followed by incubating at 4°C with Grb 2 fusion protein bound to GSH-sepharose beads for 4 h. Ø Wash with lysis buffer, boiled in sample buffer, and resolved on a 4 -12% gel. Ø Bands of interest were excised and subjected to in gel digestion. Ø Mass spectrometric analysis
Metabolic labeling with [13 C 6]Arg in the elucidation of EGF signaling Ø Cells were grown in medium containing either normal or [13 C 6] arginine. Ø 8 h of serum starvation, the labeled cells were stimulated with 150 ng/ml EGF for 10 min, whereas the unlabeled cells were left untreated. Ø Cells were lysed and combined in a 1: 1 ratio followed by incubating at 4°C with Grb 2 fusion protein bound to GSH-sepharose beads for 4 h. Ø Wash with lysis buffer, boiled in sample buffer, and resolved on a 4 -12% gel. Ø Bands of interest were excised and subjected to in gel digestion. Ø Mass spectrometric analysis
 SH 2 domain of Gb 2 binds tyrosine-phosphorylated proteins including EGFR, Shc etc. , Strategy to study activated EGFR complex
 Quantification of protein ratios from peptide doublets. Top panels show mass spectra of peptides of different identified proteins, bottom panels show mass spectra of peptides from EGF-stimulated cells upon detection of
 all sample-to-sample variability induced by subsequent biochemical experiments can") Metabolic labeling Ø Advantages: (1) all sample-to-sample variability induced by subsequent biochemical experiments can be eliminated. (2) metabolism-related dynamic labeling involved in a specific physiological process.
Metabolic labeling Ø Advantages: (1) all sample-to-sample variability induced by subsequent biochemical experiments can be eliminated. (2) metabolism-related dynamic labeling involved in a specific physiological process.
only works in cell culture systems that tolerate isotope -substituted media (which") § Drawbacks: (1)only works in cell culture systems that tolerate isotope -substituted media (which is actually often not the case), which may not be compatible with a particular biological investigation. (2)Total isotope substitution is required for reliable for MS-based quantification, which renders the approach rather expensive. (3)Difficulty in establishing an enrichment method
§ Drawbacks: (1)only works in cell culture systems that tolerate isotope -substituted media (which is actually often not the case), which may not be compatible with a particular biological investigation. (2)Total isotope substitution is required for reliable for MS-based quantification, which renders the approach rather expensive. (3)Difficulty in establishing an enrichment method
 1. Divide the previous sample (h. GH") Differential Quantitation with isotope-coded affinity tags (ICAT) 1. Divide the previous sample (h. GH in plasma) into two identical pools. 2. Reduce and alkylate (D 0 ICAT for one plasma pool and D 8 ICAT for the other), separately. Mix the two pools and digest the whole mixture with trypsin. 3. Proteome. X (2 D) Sample clean-up a) ion exchange to remove excess ICAT reagent b) avidin affinity to capture the ICAT-labeled peptides Collect the flow through Frxn Proteome. X(2 D) 4. 5. Collect the ICAT-peptide fractions and run LC-MS/MS. Proteome. X (1 D) Data analysis by Bioworks 3. 1 a) Turbo. SEQUEST for protein identification b) XPRESS for relative quantitation
Differential Quantitation with isotope-coded affinity tags (ICAT) 1. Divide the previous sample (h. GH in plasma) into two identical pools. 2. Reduce and alkylate (D 0 ICAT for one plasma pool and D 8 ICAT for the other), separately. Mix the two pools and digest the whole mixture with trypsin. 3. Proteome. X (2 D) Sample clean-up a) ion exchange to remove excess ICAT reagent b) avidin affinity to capture the ICAT-labeled peptides Collect the flow through Frxn Proteome. X(2 D) 4. 5. Collect the ICAT-peptide fractions and run LC-MS/MS. Proteome. X (1 D) Data analysis by Bioworks 3. 1 a) Turbo. SEQUEST for protein identification b) XPRESS for relative quantitation
 The structure of ICAT reagent
 Data Dependent Mass Tag Setting for ICAT 1+ 2+ 3+
 Turbo. SEQUEST Search Parameters Turbosequest parameters are set as usual except the amino acid modification and differential mass need to be set as in above
 200 m. M NH 4 Cl Search Results") Bioworks 3. 1 (SEQUEST and XPRESS) 200 m. M NH 4 Cl Search Results
Bioworks 3. 1 (SEQUEST and XPRESS) 200 m. M NH 4 Cl Search Results
 Software * NYGLLYCFR (T 16 peptide of human growth") Differential Quantitation by Bioworks (XPRESS) Software * NYGLLYCFR (T 16 peptide of human growth hormone) After finishing the Turbo. SEQUEST search, click the XPRESS function to locate the correct cysteinecontaining peptide sequence (identified from its MS/MS spectrum) with the ratio of D 0 and D 8 ion intensities (integrated from its parent ion spectrum) as shown in above.
Differential Quantitation by Bioworks (XPRESS) Software * NYGLLYCFR (T 16 peptide of human growth hormone) After finishing the Turbo. SEQUEST search, click the XPRESS function to locate the correct cysteinecontaining peptide sequence (identified from its MS/MS spectrum) with the ratio of D 0 and D 8 ion intensities (integrated from its parent ion spectrum) as shown in above.
 Zoom In MS spectra RT: 35. 09 - 35. 37 NL: 9. 68 E 5 35. 29 100 (+2) Charge D 8 M/Z = 799. 1 Signal = 0. 986 m/z= 90 80 70 Relative Abundance MS 35. 25 Base Peak 35. 33 35. 20 798. 6 -799. 6 60 50 35. 16 40 30 20 35. 16 10 0 100 90 (+2) Charge D 0 80 50 70 40 60 30 M/Z = 794. 9 Signal =1. 09 NL: 1. 09 E 6 Base Peak 35. 33 D 0/D 8 = 1. 1 35. 20 794. 4 -795. 4 MS Using the highest MS intensity m/z= 20 10 35. 29 0 35. 15 35. 20 35. 25 Time (min) 35. 30 35. 35
Largely reduce the complexity of peptide mixture; (2)Easy to enrich. Ø Drawbacks:") Ø Advantage: (1)Largely reduce the complexity of peptide mixture; (2)Easy to enrich. Ø Drawbacks: (1) 14% protein sequences do not contain cysteine-containing tryptic peptides (800 -2500 Da), 19% contains just a single such peptide (alternatively, cleavable ICAT reagents). (2) requirement of protein over 100 mg.
Ø Advantage: (1)Largely reduce the complexity of peptide mixture; (2)Easy to enrich. Ø Drawbacks: (1) 14% protein sequences do not contain cysteine-containing tryptic peptides (800 -2500 Da), 19% contains just a single such peptide (alternatively, cleavable ICAT reagents). (2) requirement of protein over 100 mg.
 ( Ø Artifacts (i. e. side reactions) inherent to") Post-digestion isotope labeling 18 O) ( Ø Artifacts (i. e. side reactions) inherent to chemical labeling can be avoided. Ø All peptides can be used for identification and quantification Ø Available for gel-separated proteins
Post-digestion isotope labeling 18 O) ( Ø Artifacts (i. e. side reactions) inherent to chemical labeling can be avoided. Ø All peptides can be used for identification and quantification Ø Available for gel-separated proteins
 Ø Samples of interest are first digested with trypsin. Ø Aliquots are subsequently incubated with either 16 O water or 18 O water in the presence of trypsin. Labeling efficiencies of individual peptides of the H 218 O-treated sample are determined by MALDI-TOFMS of a small portion of the sample. Mixtures of 16 O- and 18 O-labeled samples are then applied on the MALDI plate, and relative abundances are derived from
 General scheme of post-digest procedure 18 O labeling
 Time course of trypsin-catalyzed post-digest labeling of 1 pmol BSA tryptic digest. The exchange rate of C-terminal oxygen atoms is dependent on the peptide sequence. Fast exchanging peptides show complete labeling after <10 min (a). However, for some peptides close to quantitative labeling could only be achieved after incubation for 2 h (c).
 Practical considerations for stable isotope labeling in quantitative proteomics ØPredictable mass difference between labeled and unlabeled samples ØEasy to enrich
") An example of Data dependent MS/MS modereject high abundant proteins(GDH-2)
An example of Data dependent MS/MS modereject high abundant proteins(GDH-2)
 Glutamate dehydrogenase 2 1193. 29 1759. 92
 Data dependent setup for rejecting high abundant GDH-2 Just ion of interest
 Post-Translational Modifications
 Modifications
") Modifications (continued)
Modifications (continued)
") Modifications (continued)
Modifications (continued)
 Phosphorylatio n
 Protein identification: Phosphorylation
 MS/MS spectrum of m/z 980 -982 Y” 12+1 Y”") Data Dependent (with Dynamic Exclusion) MS/MS spectrum of m/z 980 -982 Y” 12+1 Y” 10+1 Arg-Leu-Ser-Leu-Val-Pro-Asp-Ser-Glu-Gln-Gly-Glu-Ala-Ile-Leu-Pro-Arg % Relative Abundance 100 Serine Phosphorylated 90 80 70 Serine Not Phosphorylated 931. 8 (MH 2 - H 3 PO 4)2+ 60 50 Y’’ 12+1 40 30 Y’’ 20 10 0 922. 7 764. 6 452. 5551. 1 366. 4 665. 3 400 600 800 +1 1311. 5 10 1099. 5 1410. 6 1083. 1 1000 1200 1400 1591. 5 1689. 7 1786. 8 1600 1800
Data Dependent (with Dynamic Exclusion) MS/MS spectrum of m/z 980 -982 Y” 12+1 Y” 10+1 Arg-Leu-Ser-Leu-Val-Pro-Asp-Ser-Glu-Gln-Gly-Glu-Ala-Ile-Leu-Pro-Arg % Relative Abundance 100 Serine Phosphorylated 90 80 70 Serine Not Phosphorylated 931. 8 (MH 2 - H 3 PO 4)2+ 60 50 Y’’ 12+1 40 30 Y’’ 20 10 0 922. 7 764. 6 452. 5551. 1 366. 4 665. 3 400 600 800 +1 1311. 5 10 1099. 5 1410. 6 1083. 1 1000 1200 1400 1591. 5 1689. 7 1786. 8 1600 1800
 Glycosylations
 Glycosylation
 Glycosylation
 Glycosylation
 Identifying Glycosylation – MS full scan RT: 0. 00 - 140. 00 100 Glycopeptide region MS from 90 80 31. 08 Relative Abundance 70 1 2 5. 32 50 40 6. 06 30 8. 59 20 21. 55 13. 23 Other region perform only MS and MS/MS 34. 55 26. 55 29. 80 60 NL: 2. 79 E 10 TIC MS 46. 78 44. 66 56. 23 3 4 97. 61 49. 19 57. 42 61. 02 21. 91 96. 92 95. 93 64. 91 10 98. 25 88. 24 70. 50 75. 92 86. 75 110. 98 113. 39 121. 72 117. 35 122. 46 138. 88 0 0 10 20 30 40 #583 50 RT: 15. 57 60 70 Time (min) 80 90 100 110 120 130 AV: 1 NL: 7. 23 E 8 T: + c Full ms [ 200. 00 -2000. 00] 527. 5 Glycopeptide region Relative Abundance 20 MS scan glycopeptide ion 15 217. 0 Fu N As n (select to do MS/MS) 575. 8 10 +3 5 234. 1 286. 8 445. 0 1064. 0 634. 8 762. 3 807. 9 1060. 7 1095. 7 1267. 6 1514. 8 0 200 400 600 800 1000 1200 m/z 1400 +2 1595. 2 1600 1780. 2 1800 1987. 9 2000
 Identifying Glycosylation – MS/MS 584 RT: 15. 59 T: + c Full ms 2 1064. 00@65. 00 [ 280. 00 -2000. 00] +2 : 1267. 6 100 Fu Asn 95 90 85 (select to do MS to 3) 80 75 70 65 Relative Abundance 60 55 50 +2 45 Fu 40 35 1185. 8 30 25 20 +1 +1 15 10 5 +2 Fu N 366. 0 657. 0 739. 5 453. 8 923. 0 0 400 600 800 +2 Asn N Fu Asn 1413. 1 Fu 1449. 6 Fu +2 Asn 1369. 4 Asn 1003. 5 966. 8 1450. 3 1478. 9 1085. 1 1000 1200 m/z 1400 1845. 7 1600 1800 1933. 3 2000
 Identifying Glycosylation – MS 3 TPA_iontree_2_010524173638 #585 RT: 15. 61 AV: 1 NL: 4. 09 E 5 T: + c Full ms 3 1064. 00@65. 00 1267. 64@65. 00 [ 335. 00 -2000. 00] 1333. 2 100 Asn (select to do MS to 4) 95 90 85 Fu Fu 75 Asn 70 65 Relative Abundance oxidized +2 80 Asn Fu 1011. 3 666. 6 Asn 1478. 3 60 55 1479. 2 993. 5 Fu As n 50 45 +2 40 35 30 740. 3 25 1537. 6 1334. 6 1185. 7 Asn Fu Asn 1085. 2 Fu Fu 892. 4 1987. 5 528. 0 20 551. 2 15 586. 1 10 Fu 768. 6 1697. 2 930. 3 1315. 8 1460. 4 Asn 1859. 1 5 0 400 600 800 1000 1200 m/z 1400 1600 1800 2000
 Identifying Glycosylation – MS 4 # 586 RT: 15. 63 AV: 1 NL: 8. 63 E 4 TPA_iontree_2_010524173638 T: + c Full ms 4 1064. 00@65. 00 1267. 64@65. 00 1333. 22@65. 00 [ 355. 00 -2000. 00] 728. 4 100 1213. 4 Dehydro-alanine form Further CNH 2 loss on N-terminal B 6 95 (select to do MS to 5) 90 85 Peptide only C-T-S-Q-H-L-L-N-R 70 Relative Abundance 65 B 7 C-T-S-Q-H-L-L-N-R 80 75 B 6 B 5 SCH 2 COOH 1130. 7 y 2 Y 7 60 55 50 506. 2 45 40 35 30 25 20 B 5 636. 2 618. 3 Y 2 / Y 6(+2) 492. 2 B 7 833. 0 -H 2 O Y 7 Dehydro-alanine form C-T-S-Q-H-L-L-N-R -H 2 O 1053. 4 823. 4 798. 0 1240. 5 15 10 5 0 400 600 800 1000 1200 m/z 1400 1600 1800 2000
 Fu Fu Fu N MS") Summary of one glycopeptide fragmentation pathway (a biantennary glycopeptide) Fu Fu Fu N MS to 3 MS/MS MS Asn Asn (1267 +2) Fu 211 (1064. 4 +3) 210 (1450. 6 +2) LCQ-deca (nanospray) Asn (1186 +2) Fu Asn (1085 +2) Fu Asn (1105 +2) Fu LCQdeca. XP (microspray) MS to 4 or 5 CTSQHLLNR(1333 +1) Peptide only (1131 +1) Asn (1004 +2) Asn (1333 +1)
Summary of one glycopeptide fragmentation pathway (a biantennary glycopeptide) Fu Fu Fu N MS to 3 MS/MS MS Asn Asn (1267 +2) Fu 211 (1064. 4 +3) 210 (1450. 6 +2) LCQ-deca (nanospray) Asn (1186 +2) Fu Asn (1085 +2) Fu Asn (1105 +2) Fu LCQdeca. XP (microspray) MS to 4 or 5 CTSQHLLNR(1333 +1) Peptide only (1131 +1) Asn (1004 +2) Asn (1333 +1)
 De Novo Peptide Sequencing
 Why De Novo Peptide Sequencing ? Determination and/or confirmation of peptide sequences derived from proteins that are: Ønot in the databases (including DNA sequence) Øwith amino acid modifications
 Ref: Zhang ZQ, Mc. Elvain JS.") Ø Ø De novo sequencing software (PARSER II) Ref: Zhang ZQ, Mc. Elvain JS. De Novo peptide sequencing by two-dimensional fragment correlation mass spectrometry. Anal Chem, 2000, 72 (11): 2337 -2350
Ø Ø De novo sequencing software (PARSER II) Ref: Zhang ZQ, Mc. Elvain JS. De Novo peptide sequencing by two-dimensional fragment correlation mass spectrometry. Anal Chem, 2000, 72 (11): 2337 -2350
 MS, MS 2 and MS 3 spectra collected with peak parking 496. 1 100 Base Peak 80 60 Full Scan MS 40 20 0 16 18 20 22 Time (min) 24 80 990. 6 400 Full Scan MS 2 800 m/z 300 m/z 1000 Full Scan MS 3 @261. 1 599. 3 354. 1 261. 2 226. 1 Full Scan MS 3 @389. 2 200 300 m/z 400 500 1200 Full Scan MS 3 @616. 4 581. 2 129. 1 234. 1 800 m/z 372. 2 243. 0 0 100 389. 2 714. 5 502. 3 400 233. 1 1200 Full Scan MS 3 @730. 4 121. 2 200 1000 713. 4 389. 2 261. 1 * 40 616. 4 233. 1 * * 502. 4 * 20 732. 4 0 200 400 600 800 m/z Full Scan MS 3 @233. 1 100 60 120. 2 86. 1 730. 4 * 100 200 400 m/z 600 200 400 600 800 1000 m/z
 Determination of Peptide Sequence by MS 3 De Novo Sequencing Software --- Biowork 3. 1 Peptide = FINNIGANK
 by MS 3 De Novo Sequencing Software Peptide") Sequencing Tryptic Peptide (m/z 585. 1) by MS 3 De Novo Sequencing Software Peptide = TGPNLHGLFGR
Sequencing Tryptic Peptide (m/z 585. 1) by MS 3 De Novo Sequencing Software Peptide = TGPNLHGLFGR
 Thank You!