b1a501fb035806986670a22769f64644.ppt
- Количество слайдов: 57


")
Introduction of Fukuchi Laboratory TMU Hajime FUKUCHI (2012/04/12)

Research Fields of FUKUCHI Lab. Space-borne Next Generation Earth Observation Space & Interpretation Communication EM Wave Application

Recent Research Themes 1. Space-borne POLSAR l Multi-frequency Urban Observation l Radiometric Calibration and σ statistics l Interferometric urban observation 2.Next Generation Space Communication l Optical Satellite Communication l Attenuation Mitigation Technologies l Space-&-Terrestrial Fused Wireless

Full-Polarimetric SAR PALSAR / Terra. SAR-X

Space-borne SAR
 AVNIR-2 ALOS PRISM PALSAR・・・Full polarimetric radar ©JAXA Space Analysis of urban")
Research background (1) AVNIR-2 ALOS PRISM PALSAR・・・Full polarimetric radar ©JAXA Space Analysis of urban area environment, …e. t. c Polarization channels launch, …e. t. c HH ©JAXA HV VH VV©JAXA Interferometry image of Deforestation and Faraday Rotation Calibrate : Antenna distortion in Brazil’s Amazon earthquake disaster in China TOKYO METROPOLITAN UNIVERSITY Remote Sensing Laboratory
 Ionosphere Ω ・Orbital altitude over 500")
Faraday Rotation Affected conditions ・Below L-band(1. 27 GHz) Ionosphere Ω ・Orbital altitude over 500 km ・Solar active period Trihedral or Plate Polarization plane Faraday rotation FR angle = 10° PALSAR 2007 Minimum period 2011 Maximum period Prediction of solar activity TOKYO METROPOLITAN UNIVERSITY Remote Sensing Laboratory Time

Calibration method Observation model Scattering matrix of point targets preserving :channel imbalance : cross-talk factor Polarization preserving TOKYO Polarization rotating METROPOLITAN UNIVERSITY :FR angle Remote Sensing Laboratory
 SCENE : ALPSRP 021220710(Higashimurayama) OBS FREQUENCY")
PALSAR Observation False Color Figure( HH=Red, HV=Green, VV=Blue) SCENE : ALPSRP 021220710(Higashimurayama) OBS FREQUENCY : 1. 27 GHz OBS TIME : 2006/06/18 21: 58: 41~ 21: 58: 50 (JST) OBS MODE : 4 ch(Full-Polarimetry) FLIGHT ALTITUDE : 691. 65 km FLIGHT VELOCITY : 7. 48 km/sec Tachikawa INCIDENCE ANGLE : 24. 05° SCENE SIZE [PIXEL] : 36. 25 km(Az)× 36. 25 km(Rg) [2900(Az)× 2900(Rg)] PIXEL SPACING : 12. 5 m(Az)× 12. 5 m(Rg) Flight(Az) Illumination(Rg) TMU(Hino. Camp)
 ~Musahimurayama, Tokyo~ Location ⇒ Musahimurayama, Tokyo Date ⇒ October 21. 2006")
Calibration experiment (1) ~Musahimurayama, Tokyo~ Location ⇒ Musahimurayama, Tokyo Date ⇒ October 21. 2006 Targets ⇒ 8 (for calibration and evaluation) Ascending Trihedral Experimental place PARC Plate Twisted Musashimurayama SAR image Descending Musashimurayama Observation site TOKYO METROPOLITAN UNIVERSITY Remote Sensing Laboratory

Polarization signature of Plate ~Musahimurayama, Tokyo~ π 4 0 π 2 π Ideal π 4 0 0 π 4 0 π 2 π Un-cal π π 4 0 0 0 π 2 METROPOLITAN UNIVERSITY π 4 π Case A (Trihedral - PARC) / FR angle 5. 79° TOKYO π 2 JAXA π 4 0 0 π 2 π Case B (Trihedral - Twisted) / FR angle 5. 71° Remote Sensing Laboratory

Extraction of Urban Parameters Using Air-borne and Spaceborne. POLSAR

Background -1➣ It is very useful to grasp Ground spatial aspects and its Temporal change. 1. Regardless of weather, time-of-day, smoke, volcanic ash, obstacles in some applications and so on 2. Periodically basis but Cost-effective 3. Wide area but Quickly with enough spatial Resolution TOKYO METROPOLITAN UNIVERSITY Remote Sensing Laboratory

Background -2 - ➣Only satellite borne POLSAR such as PALSAR meets those demands, by fully making use of received radio wave properties. ➣In highly urbanized area such demands become high. TOKYO METROPOLITAN UNIVERSITY Remote Sensing Laboratory
 [ Spatial Aspects [ Temporal Change")
Examples of Parameters in Urban Area How useful? (Application Examples) [ Spatial Aspects [ Temporal Change ] ] ・Classification of Land Usage (Artificial or Natural, % of Road, Houses, Farm, Garden, ・・・) ・Urbanization history and Development Planning ・Disaster Recovery Strategy ・Classification of Area ・ Urbanization history and Development Planning Average Alignment Angle ・Access Simulation ・Living Environment ( Duration of Sun-shine, ・ ・) ・Urbanization or road Development history and Planning ・Disaster Recovery Strategy Density of Structures ・Access Simulation ・Living Environment ・Development Planning ・Urbanization history and planning ・Disaster Recovery Strategy Degree of Structural Order Average Size Usage (Factory, House・ of Structures ・) TOKYO METROPOLITAN UNIVERSITY Remote Sensing Laboratory

Correlation of Circular Pol. Basis Correlation Coefficient : γ Phase of Correlation Coefficient : φ 〈 〉:average over pixels,*:complex conjugate TOKYO METROPOLITAN UNIVERSITY Remote Sensing Laboratory
 TOKYO METROPOLITAN UNIVERSITY Remote ©JAXASensing Laboratory")
PALSAR on ALOS ©JAXA ALOS PALSAR (L-band) TOKYO METROPOLITAN UNIVERSITY Remote ©JAXASensing Laboratory
 Pi-SAR X-band Quick. Bird HH:red HV:green VV:blue ©")
Data Samples (Western Part of Tokyo) Pi-SAR X-band Quick. Bird HH:red HV:green VV:blue © NICT PALSAR TOKYO METROPOLITAN UNIVERSITY Remote Sensing Laboratory © METI/JAXA

5 Dec 2008 45 st Annual Meeting of the Remote Sensing Society of Japan Extraction of Buildings Alignment 71° 90° 60° 30° 5° 0° Extracted Alignment of Buildings(Pi-SAR L-band) Quick. Bird TOKYO METROPOLITAN UNIVERSITY Remote Sensing Laboratory

5 Dec 2008 45 st Annual Meeting of the Remote Sensing Society of Japan Extraction of Buildings Alignment HH:red, HV:green, VV:blue 90° 60° 30° 0° Pi-SAR L-band False Color Map TOKYO METROPOLITAN Extracted Alignment of Buildings(Pi-SAR L-band) UNIVERSITY Remote Sensing Laboratory

Attenuation Mitigation Technologies for Future Sat. Com system
")
CONTENTS Propagation Effects Mitigation Technologies for Attenuation Phased Array Antenna for Adaptive Mitigation (NHK) Future Study Items

Ka-band Satellite Network Wide Band Global Channel Small, Light weight & Mobile Inter-Connection among Broadband Infrastructure Novel Rain Countermeasure Resume Propagation Studies with World Collaboration

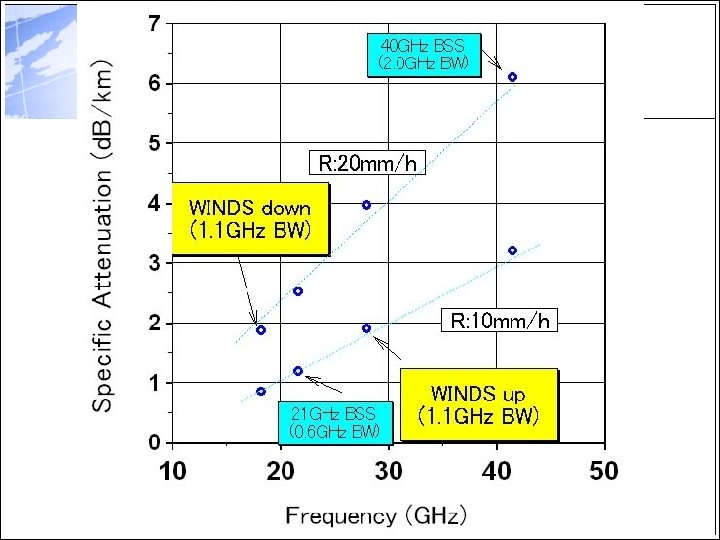
Japanese Ka-Band Sat. Com Projects Parameters WINDS 21 GHz BSS Frequency Up: 27. 5 -28. 6 Up: TBD (GHz) Dn: 17. 7 -18. 8 Dn: 21. 4 -22. 0 Band Width 1. 1 0. 6 (GHz) Polarization Fixed: Linear(V, H) TBD APAA: Linear (V) Orbit GEO 143 deg. E TBD (or 144. 5 deg. E)

WINDS JAXA

Propagation Effect on Wireless Link Performance Rain TX H-Pol Attenuation Noise Increase RX H V h V-Pol Depolarization V Gaseous Attenuation Interference from other systems

Attenuation Statistics of WINDS Link Rec. 618 -6

Mitigation Technologies Principle and Feature Examples Static -Margin addition -Hierarchical channel -Waste of Resource -EIRP, G/T increase -Hierarchical coding & modulation Adaptive (Dynami c) Diversity -Adaptive distribution of link Resources -Good for point-to-point -Power control -Bandwidth control -Coding rate control -Prepare channels with low attenuation correlation -Good for large attenuation -Site or/and Time diversity -Frequency diversity -Orbit diversity

31
")
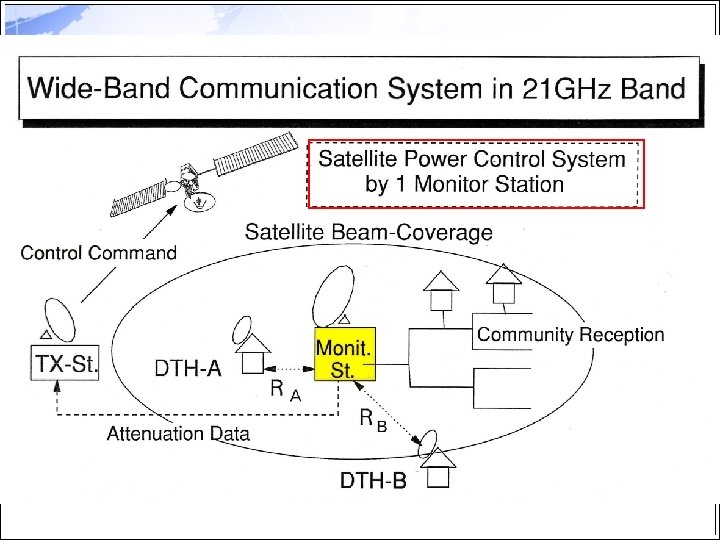
TWT Array Adaptive Satellite Power Control Method (Saito 2001)

Related Study done by NHK “ A Study on the Transponder System in the 21 GHz-band Broadcasting Satellites using Phased-Array Antenna” M. Kamei, et al. , The 23 rd AIAA International Communications Satellite Conference(ICSSC 2005), Sept. 2005.
 üRainfall rate")
Data Analysed Ø Data in Japan üAttenuation at 19. 5 GHz (Kashima) üRainfall rate over Japan (AMe. DAS) integration time : 1 minimum Ø Data in Tropical Asia üThailand: Attenuation at Ku-band (Thaicom 2, 3) üMalaysia: Attenuation at Ku-band(Mesat) üIndonesia: Rainfall rate integration time: 1 minimum 36

Used Data and Analysis 37

SPACE Correlation 38

Example of Space Correlation 39

Regional Dependence 40
 Dependence IT : 1 min 41")
Integration Time (IT) Dependence IT : 1 min 41
 42")
Direction Dependence (Tokyo) 42
 43")
Direction Dependence (Owase) 43

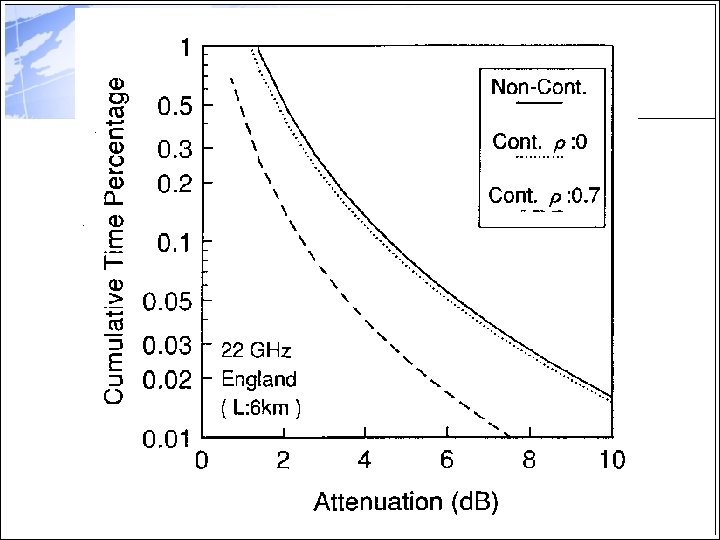
Time Correlation 44

45

Time Series of Received Level 46

Time-Diversity Effect at Ku-band 47
")
(Fukuchi 2000)

Time-Diversity Effect at Ka-band 49

Time-Diversity Gain at Ku-band 50

Time-Diversity Gain at Ka-band 19. 5 GHz 51

Regional and Integration Time Dependence of Time Correlation 52

Auto-Correlation of Rainfall Rate 53
")
(Fukuchi 2004)
 • time-diversity • multi-dimensional diversity (combination of site-")
Correlation Property Applications • site-diversity(long-distance, multi-site) • time-diversity • multi-dimensional diversity (combination of site- and time-diversity) • proper power allocation or beam design for multi-beam satellite communication system • satellite power control in the above system

Evaluation of Mitigation Effect • n-Dimensional Joint PDF of Attenuation: p (A 1, ---, An ) , where A ( space , time ). • Effective Attenuation Cumulative Distribution: P (ae > X ) = (A 1 , --, An) d A 1 —d. An , Integration region is a function of threshold, X
 0 A 1 Adaptive")
Examples of Analysis A 2 0 A 1 Diversity(Space, Time) 0 A 1 Adaptive Control
b1a501fb035806986670a22769f64644.ppt