

13a866a913595ea7a547b89d7df07176.ppt
- Количество слайдов: 45
 International trade and the inequality of nations. Tony Venables, London School of Economics & UK Department for International Development
 • Is international trade a force – for the convergence of real incomes across countries? – for the divergence of real incomes? • What is the historical record? • What does economic analysis suggest? • Is there a tension between the evidence and theory? • Should international economics be reformulated to capture massive and persistent international inequalities?
 Argue that: • In different time periods and different contexts the effects of trade have been quite different. • To understand this need a theory which recognises that the productivity of labour – and hence comparative advantage – depends on inputs that are complementary with labour. • Supply of these complementary inputs is endogenous: Some are supplied publicly, some privately. They may be internationally mobile. They are often associated with cumulative causation processes.
 Plan of lecture • Review of evidence. • Development of simple analytical frameworks to think about the role of complementary inputs: – Capital – Institutions, infrastructure and investment climate – Intermediate goods
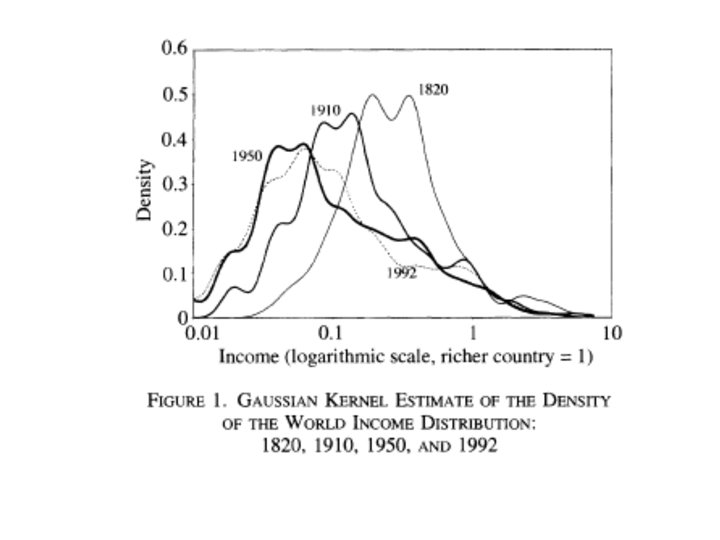
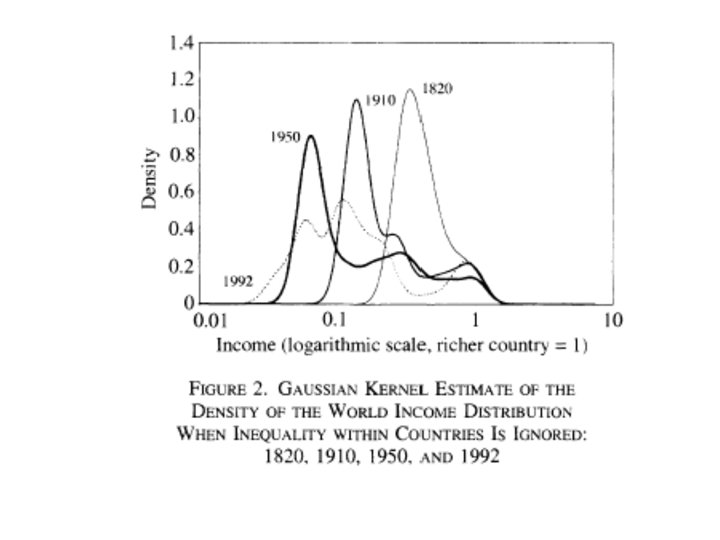
 1: Historical record – the great divergence: • Ratio of per capita incomes of richest to poorest nations increased from around 8 in 1870 to 50 in 2000 • Decline in shipping costs and increasing role of trade Real cost of ocean shipping World merchandise exports % GDP 1790 376 1820 1% 1830 287 1870 4. 6% 1870 196 1913 7. 9% 1930 107 1929 9. 0% 1960 47 1950 5. 5% 1990 51 1973 10. 5% 1998 17. 2%
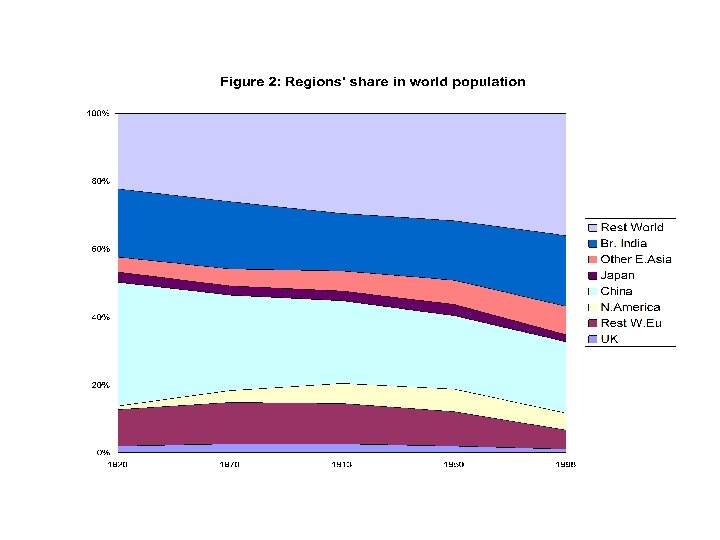
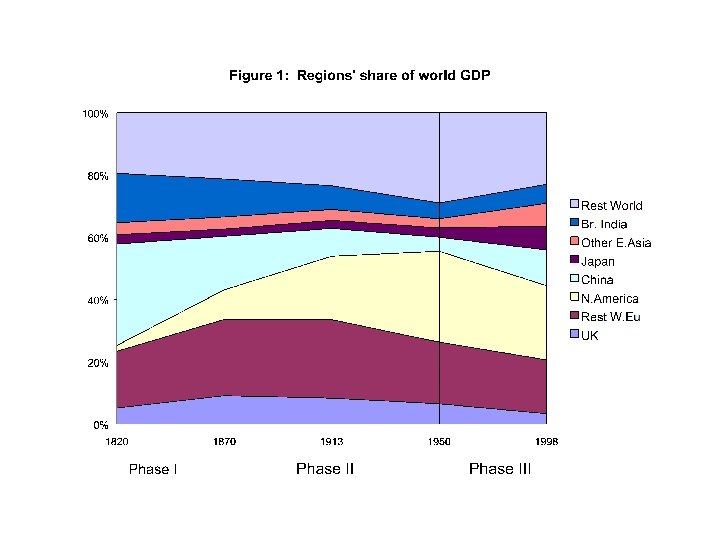
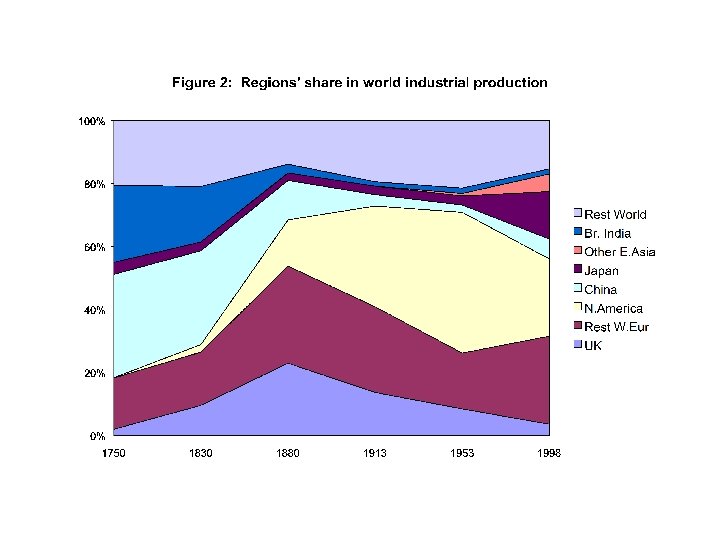
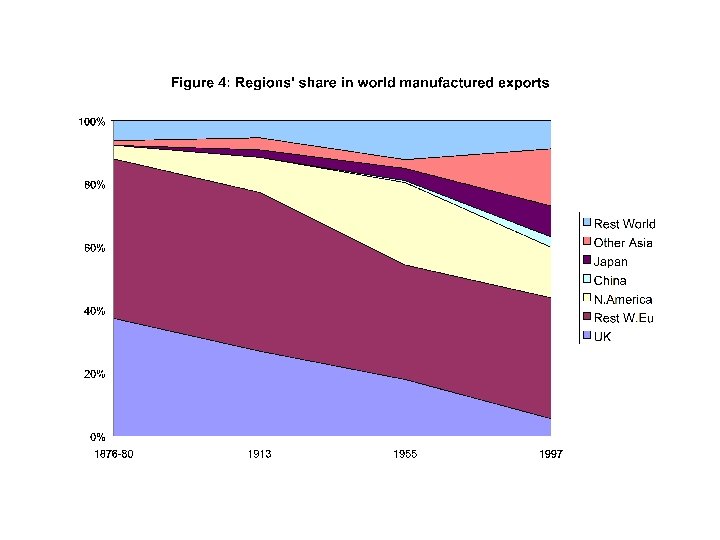
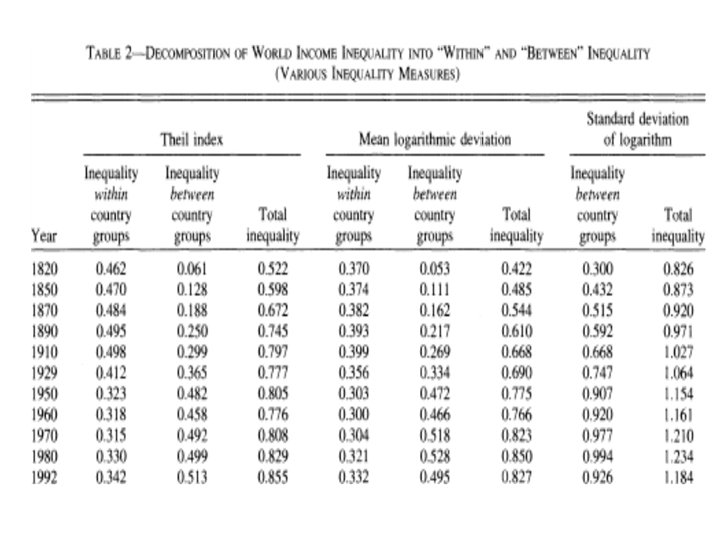
 An interpretation of the evidence: • Rich club/ poor club – ‘convergence clubs’ • Rich club has captured most of the benefits of trade. • Coexistence of these clubs for extremely long periods of time. • Economic development in sequence not in parallel NB: • Not seeking to argue that all changes in international inequality due to trade. • But, need analysis that recognises: (a) ambiguous effects of trade and (b) trade is consistent with persistent inequalities.
, numeraire Manufactures: XM = M(LM, KM),") Benchmark model: Goods: Agriculture: XA = A(LA, KA), numeraire Manufactures: XM = M(LM, KM), price p. Inputs: KA ‘Complementary input’ in agric; return r. A KM ‘Complementary input’ in manuf; return r. M L = LA + LM Fixed endowment of labour; wage w. Equilibrium: w = a(LA/KA) = pm(LM/KM) Also: r. A = [A(LA/KA) - w. LA)]/ KA r. M = [p. M(LM/KM) - w. LM]/ KM
Benchmark model: Goods: Agriculture: XA = A(LA, KA), numeraire Manufactures: XM = M(LM, KM), price p. Inputs: KA ‘Complementary input’ in agric; return r. A KM ‘Complementary input’ in manuf; return r. M L = LA + LM Fixed endowment of labour; wage w. Equilibrium: w = a(LA/KA) = pm(LM/KM) Also: r. A = [A(LA/KA) - w. LA)]/ KA r. M = [p. M(LM/KM) - w. LM]/ KM
 Model I: Trade and factor flight: Capital as the complementary input. Consider a small open economy that has a comparative disadvantage in manufactures. Source of comparative disadvantage? Land abundance Technical inefficiency Complementary factor in manufactures may be internationally mobile: eg, human or physical capital. Question: What is effect of opening to trade?
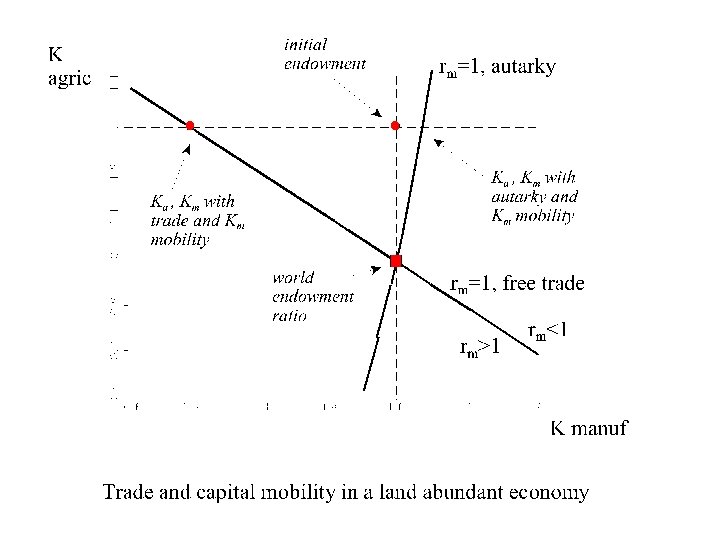
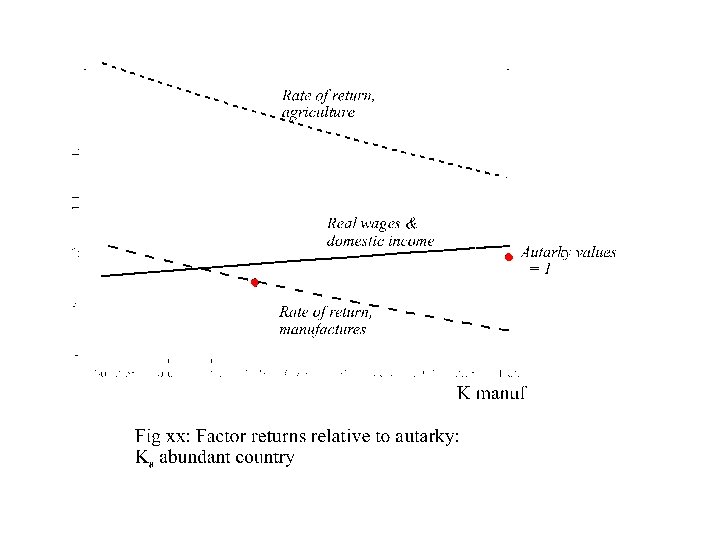
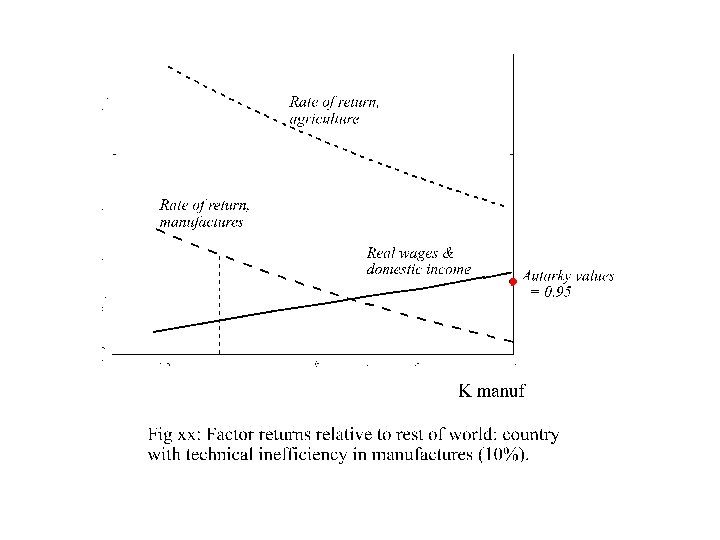
 Key points: • Under autarky, the cost of a technical inefficiency or comparative disadvantage is spread across the entire population, via goods prices. • With trade, this cost is concentrated on owners of specific factors in the sector with disadvantage. • If this factor is internationally mobile, then this will cause capital flight and a fall in the wage. • Gain to initial residents – ‘national’ real income Loss to ‘domestic’ real income.
: • Trade lets a country move factors out of sector with") Key points (continued): • Trade lets a country move factors out of sector with comparative disadvantage – but how are they absorbed elsewhere? Can ‘capital’ be employed elsewhere? Heckscher-Ohlin versus specific factors model. Can labour be redeployed without running into diminishing returns? • The more things are tradable the easier it is to redeploy factors from contracting sectors without running into diminishing returns.
Key points (continued): • Trade lets a country move factors out of sector with comparative disadvantage – but how are they absorbed elsewhere? Can ‘capital’ be employed elsewhere? Heckscher-Ohlin versus specific factors model. Can labour be redeployed without running into diminishing returns? • The more things are tradable the easier it is to redeploy factors from contracting sectors without running into diminishing returns.
 Application and policy • Lagging regions? Increased trade denudes regions of skills/ capital. • Mono-crop agriculture and import competing manufacture? • Export diversification a necessary accompaniment to import liberalization.
 Model II: Infrastructure and institutions: publicly provided complementary inputs. • Institutions matter – Acemoglu et al. • Institutions are a ‘complementary input’ to production. • Institutions are more important for some activities than others. ‘Countries with better contract enforcement specialise in industries that rely heavily on relationship specific investments’, (Nunn, 2005) • Investment in institutions a public good, and usually cannot be made sector specific
 What are these ‘institutions’? • • • Rule of law, property rights, limits to corruption Infrastructure Investment climate NB: Matter particularly for modern manufacturing exports: • Importance of reliability and quality control • Just-in-time delivery. • O-rings and supermodularity – value of a product is determined by its weakest link.
 Public") • Public investments in institutions/ infrastructure/ investment climate, have properties that: i) Public goods, not easily targeted to particular sector. ii) Productivity effect varies across sectors – high in modern manufacturing? • How does the provision of these services shape trade, and how does trade shape the provision of these services? • Show that two economies that are ex ante identical can be different ex post – just one of them captures all the gains from trade.
• Public investments in institutions/ infrastructure/ investment climate, have properties that: i) Public goods, not easily targeted to particular sector. ii) Productivity effect varies across sectors – high in modern manufacturing? • How does the provision of these services shape trade, and how does trade shape the provision of these services? • Show that two economies that are ex ante identical can be different ex post – just one of them captures all the gains from trade.
 Model II: • Two sectors, A and M, as before, using labour and a public service, s. • Marginal (and average) products of labour in each sector, a(si), pm(si) • One unit of labour produces one unit of public service. In country i, if both sectors active: Labour market clearing: Real income of country i: wi = a(si) = pm(si) 1 - si = L A + L M. ui = (1 - si)wi p-μ Autarky: ui = (1 - si) a(si)1 -μ m(si)μ Optimal choice of s: si /(1 - si) = (1 - μ)ηA + μηM
 Can there be an asymmetric equilibrium? Suppose so: in equilibrium, country 1 has only manufactures; L 1 M = 1 – s 1, w 1 = pm(s 1) > a(s 1) country 2 has agriculture and manufactures; L 2 M + L 2 A = 1 – s 1, w 2 = pm(s 2) = a(s 2) This means that world price is, p = a(s 2) /m(s 2) Real income levels, u 1, u 2: u 1 = (1–s 1)w 1 p-μ = (1–s 1) m(s 1)[a(s 2) /m(s 2) ]1 -μ optimal choice of s 1: s 1 /(1 – s 1) = ηM u 2 = (1–s 2)w 2 p-μ = (1–s 2)a(s 2)1 -μ m(s 2)μ optimal choice of s 2: s 2 /(1 – s 2) = (1 - μ)ηA + μηM
 Optimal choice of s 1 : Optimal choice of s 2 : s 1 /(1 – s 1) = ηM s 2 /(1 – s 2) = (1 - μ)ηA + μηM This is an equilibrium if ηM > ηA: In this case country choices imply, s 1 > s 2, and therefore productivity levels such that country 1 specialised in manufactures. Country 2 has no incentive to deviate. Real income levels? Country 2: No gains from trade (same choice of s 2, and same prices as under autarky). Country 1: Gains from trade (higher level of s 1, same prices as under autarky).
 The game between countries: Remove discontinuities by adding a specific factor in agriculture: a(si , Li. A/KA) Compute best response functions. Multiple equilibria. Gains/ losses from trade.
 Key points: • Economies may be identical ex ante, but asymmetric ex post, with one taking all the gains from trade. • If one country has already made the investments that give it comparative advantage in manufacturing, then it is not worthwhile for the other country to investment. • I. e. , for a country with a small modern sector it is rational to invest little in the public goods that raise productivity in this sector (…. . and therefore it will turn out to have a small modern sector). • Target provision of infrastructure/ institutional investments?
 Model III: Intermediate goods: linkages and clustering. • Third sort of complementary input: intermediate goods. • Draw on ‘new economic geography’, Fujita, Krugman & Venables. • Productivity depends on local supply of intermediates • Intermediate goods create the possibility of forward and backward linkages -- old idea from the development literature (Hirshman, Myrdal). • Forward (cost) linkages: downstream firms gain from proximity to their suppliers (eg, save transport costs). • Backward (demand) linkages: upstream firms gain from proximity to their customers (transport costs).
 • Can produce outcomes where activity ‘clusters’ in one country. Key assumptions to get clustering? • Many types of intermediate goods, and each type only produced in one place – presumably because of increasing returns to scale. (Without this assumption, have ‘backyard capitalism’). • Proximity advantage – eg transport costs.
 • Manufactures: Each country produces its") The model: • Agriculture: labour productivity: a(Li. A) • Manufactures: Each country produces its own variety of final good, output prices = unit cost, p 1, p 2 (perfect competition) • Inputs to manufacturing: • Labour, with share in costs 1 – v. • Continuum of intermediate goods, share v, elasticity of substitution between intermediate varieties = 1 (Cobb. Douglas). • Intermediate goods can be produced in one country or the other, using just labour. Let θ denote the fraction of the types produced in country 1. • Intermediates’ prices, w + ε, transport costs t. • Final goods prices, p 1 = w 11 -vw 1 vθ (w 2 t)v(1 - θ) , p 2 = w 2(1 -v)w 2 v(1 - θ) (w 1 t)vθ
The model: • Agriculture: labour productivity: a(Li. A) • Manufactures: Each country produces its own variety of final good, output prices = unit cost, p 1, p 2 (perfect competition) • Inputs to manufacturing: • Labour, with share in costs 1 – v. • Continuum of intermediate goods, share v, elasticity of substitution between intermediate varieties = 1 (Cobb. Douglas). • Intermediate goods can be produced in one country or the other, using just labour. Let θ denote the fraction of the types produced in country 1. • Intermediates’ prices, w + ε, transport costs t. • Final goods prices, p 1 = w 11 -vw 1 vθ (w 2 t)v(1 - θ) , p 2 = w 2(1 -v)w 2 v(1 - θ) (w 1 t)vθ
 Price of final goods produced in country 1, country 2; p 1 = w 1[1 -v(1 -θ)] (w 2 t) v(1 -θ), p 2 = w 2[1 -vθ] (w 1 t)vθ Demand for final goods from both countries, exports have transport cost ; X 1= D(p 1, p 2+ ) + D(p 1+ , p 2), X 2 = D(p 2, p 1+ ) + D(p 2+ , p 1) yi is quantity of each variety of intermediate produced in country i. Derived demand for intermediate goods (in value terms); w 1 y 1θ = θv(p 1 X 1+p 2 X 2/t), w 2 y 2(1 - θ) = (1 - θ)v(p 2 X 2+p 1 X 1/t). Each variety of produced in country from which it makes largest total sales, i. e. θ adjusts until y 1 = y 2. How does varying the location of intermediate good production change profitability, y 1, y 2? Increase θ implies ↓p 1 and ↑p 2. • Crowding effect: Given X, if more locally supplied then each sold in smaller quantity. Depends on value of t. • Cost/ sales effect: Reduction in p 1 expands sales, X 1, and hence increases y 1. Depends on values of t and . • Will get clustering of activity if cost/ sale effect dominates crowding.
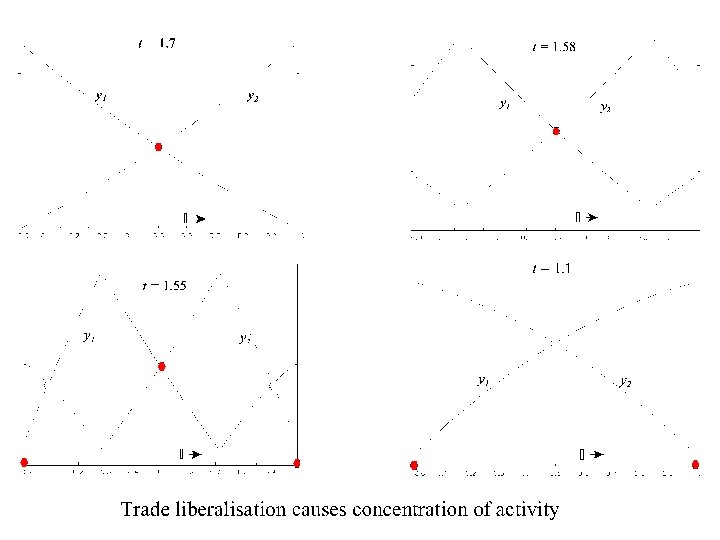
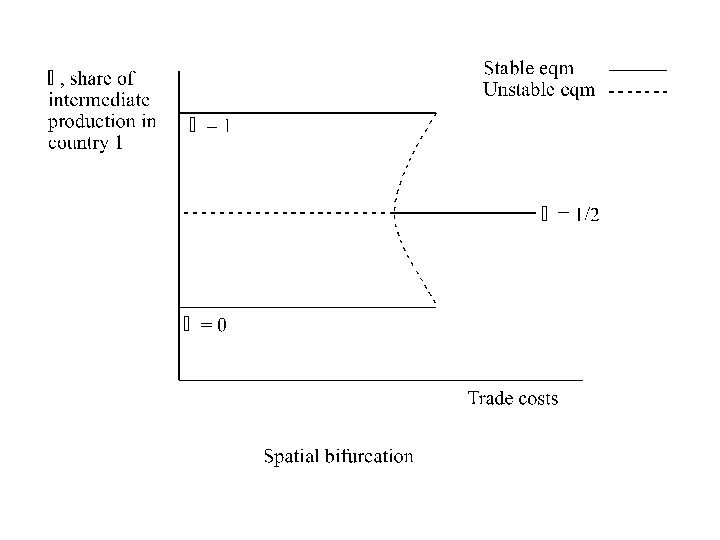
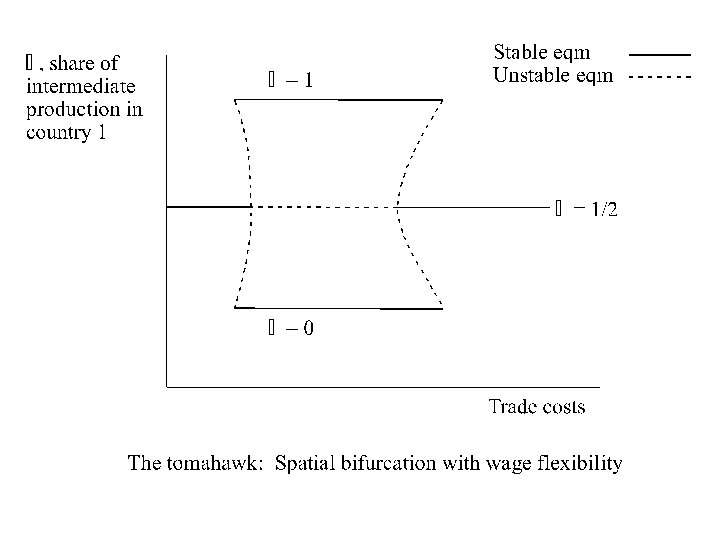
 Summary: • At high trade costs, each country has industry to supply local consumers – crowding effect dominates cost/sales expansion effect. Symmetry, θ = ½. • At intermediate trade costs, sales more responsive to cost differences – cost/ sales effect dominates. Agglomeration, θ = 1 or θ = 0. So far, assumed wages fixed: what if they respond to employment levels (upward sloping labour supply curve from other sectors)?
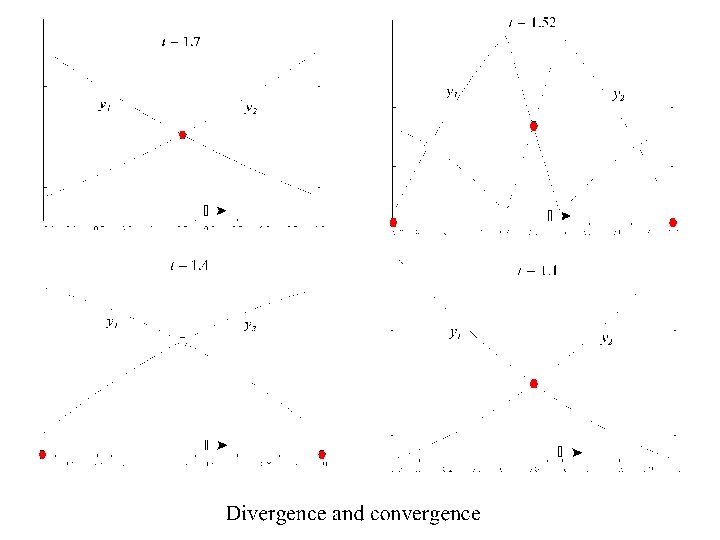
 Cut trade costs: – deindustrialises 2 & cuts its real wage – globalization phase, rapid catch up by 2, possible fall real wage in 1.
 Summary – the general theory of location: • At high trade costs: location determined by demand: θ = ½. Equal real wages. • At intermediate trade costs: location determined by clustering forces: θ = 1 or θ = 0. Real wages unequal. • At low trade costs: location determined by factor costs θ = ½. Equal real wages. • Implications for real wages and the distribution of the gains from trade. • In multi-country setting, have ‘rich club’ / ‘poor club’.
") Extensions – other clustering mechanisms: • ‘Timeliness’ as a trade cost: (Harrigan & Venables) • One assembly plant in each country. • Range of intermediate goods, each type produced in just one country. • Probability of remotely produced int. arriving on time, q < 1. • Probability of all ints. arriving on time for plant in country 1 is q 1 -θ, where θ is no. of intermediates prod. in 1. • This probability is increasing and convex in θ. • If delaying production is costly, then it is efficient to put all intermediate production next to one assembly plant – ie. , clustering.
Extensions – other clustering mechanisms: • ‘Timeliness’ as a trade cost: (Harrigan & Venables) • One assembly plant in each country. • Range of intermediate goods, each type produced in just one country. • Probability of remotely produced int. arriving on time, q < 1. • Probability of all ints. arriving on time for plant in country 1 is q 1 -θ, where θ is no. of intermediates prod. in 1. • This probability is increasing and convex in θ. • If delaying production is costly, then it is efficient to put all intermediate production next to one assembly plant – ie. , clustering.
 Timeliness: • Intermediate producers cluster, because it is better to have one assembly plant working well and the other badly, than both ‘ 1/2 well’ • Intuition – if one part is delayed, matters less that second is also delayed.
 Extensions: • Other clustering mechanisms? • Thick labour markets -- matching -- skill acquisition • Knowledge spillovers. • What is their interaction with trade? Trade liberalization facilitates clustering – all the way to free trade (i. e. , not tomahawk case)? • What is their spatial scale? Urban rather than international economics?
 Conclusions: • Need to recognise that trade has not always brought a balanced distribution of benefits. • Have offered some reasons why this is so – organised around theme of the supply and/or location of complementary inputs to production. • Absolutely NOT a rejection of the case for trade liberalization; many of these models yield much larger world gains from trade liberalisation than do standard models.
 BUT: Recognise that opening to trade can create problems. • Alternative employment of resources displaced from import competing sector may mean lower income. Even in a ‘perfect’ economy, trade can increase incentives for factor flight and redeployed labour may run into diminishing returns and lower wages. Need more tradable goods – diversification (Model I) • Incentives to improve institutions and the investment climate may be low. Need cost effective ways to target these expenditures. Aid for trade. (Model II) • Small trade frictions combined with ‘linkages’ mean that large wage differences are not enough to attract industry. But optimistic message – globalization reduces the value of proximity and facilitates relocation of stages of the production process. (Model III)