

68fbdb13336d21dfc64a40212863b000.ppt
- Количество слайдов: 30
") Integration of Wildfire Emissions into Models-3/CMAQ with the Prototypes: Community Smoke Emissions Modeling (CSEM) System and Blue. Sky Mike Sestak & Doug Fox CIRA Susan O’Neill & Sue Ferguson USDA Forest Service, Seattle Jason Ching NOAA/EPA
Integration of Wildfire Emissions into Models-3/CMAQ with the Prototypes: Community Smoke Emissions Modeling (CSEM) System and Blue. Sky Mike Sestak & Doug Fox CIRA Susan O’Neill & Sue Ferguson USDA Forest Service, Seattle Jason Ching NOAA/EPA
 What is the problem? • Increased use of fire • Agriculture, forestry, military, and rangeland • Competition for air shed
 Fire Effects - Visibility • IMPROVE program measures visibility & speciated aerosol data representing Class I areas & relates them to each other for the regional haze rule. • Majority of fine particle species emitted from fires are organic and elemental carbon. • Carbonaceous gas to particle conversion is poorly understood. • Wildland fire contributes to the 20% worst visibility days, especially in the west. • Monthly OC contribution to total fine mass reaches 80% in some western US locations, longer term 10 -30%. • IMPROVE monitoring suggests a range of 10%-40% of OC (organic carbon contribution to PM 2. 5) on the high mass days (20% worst visibility) may be from wild fires.
 On-going research is attempting to quantify fire’s contribution to organic aerosols Organic Carbon % contribution to total extinction Elemental Carbon % contribution to total extinction
 • Two efforts are underway") Blue. Sky and The Community Smoke Emission Model (CSEM) • Two efforts are underway to Develop Emissions Models for Wildland Burning – Blue. Sky • Designed to provide real-time estimation of fire emissions for use in a variety of modeling systems: CALPUFF, Hy-Split, CMAQ – CSEM • Designed to provide historical fire emissions estimates for use in CMAQ and REMSAD • Both systems rely upon the Emission Production Model (EPM) and Fuel Consumption Model (CONSUME) used throughout the fire community.
Blue. Sky and The Community Smoke Emission Model (CSEM) • Two efforts are underway to Develop Emissions Models for Wildland Burning – Blue. Sky • Designed to provide real-time estimation of fire emissions for use in a variety of modeling systems: CALPUFF, Hy-Split, CMAQ – CSEM • Designed to provide historical fire emissions estimates for use in CMAQ and REMSAD • Both systems rely upon the Emission Production Model (EPM) and Fuel Consumption Model (CONSUME) used throughout the fire community.
 System Synergy • The Blue. Sky and CSEM Systems Complement Eachother – Blue. Sky: • is an example of where the Fire Community wants to BE. • but we can only be there in the Pacific Northwest because of the unique combination of Agencies, and Reporting and Modeling tools. – CSEM: • is necessary for integrating Fire into CMAQ. • is necessary for historical/scenario simulations. • will be invaluable to getting Blue. Sky operational in other parts of the country where resources similar to the Pacific Northwest do not exist.
 Steps Common to Smoke Emission Modeling • • • Read Fire Description Information Determine the Fuel Loading Obtain Local Meteorological Data Calculate Fuel Consumption (CONSUME) Calculate CO, CO 2, CH 4, PM 2. 5, PM 10, and Heat Released (EPM) • Calculate Plume Rise for each Fire. • Integrate Fire Emissions into the Modeling System.
 What we CSEM is trying to do… • Goal: to build a tool to generate emissions from forest burning for use in regional air quality modeling with the following characteristics: – Scale is regional to national with resolution ranging from 1 km to 36 km; – Temporal resolution from hourly to multi-year; – Chemical species including all NAAQS & visibility components & their precursors; – Accuracy equivalent to other emissions estimates.
 Fire Generator Read") FIRES Identify vegetation cover & fuel loadings CSEM (1 km resolution) Fire Generator Read from NFDR fuel model coverage Modify with National FCC coverage (hourly, 1 km resolution) Identify Fire Boundaries (daily, 1 km resolution) Read from National Fire Occurrence database MM 5 Meteorology 2 pm local time Temperature; Relative humidity; Cloud cover; Wind speed Daily Temperature range; Relative humidity range Past 7 days Precipitation; Same as above Generate species Emissions & Plume Rise (hourly, regional model resolution) Calculate Fuel Moisture Content (daily, weekly, regional model resolution) NFDR calculations based on MM 5 input for range of variables at 36 km resolution Develop emissions profiles to scale species from EPM generated emissions & to generate hourly emissions distributions. Calculate Fuel Consumption Estimate plume rise based on Briggs at appropriate resolution for the spatial scale of emissions. Utilize CONSUME to generate fuel consumption and EPM to estimate emissions & heat release rate for each fire. (daily, regional model resolution)
FIRES Identify vegetation cover & fuel loadings CSEM (1 km resolution) Fire Generator Read from NFDR fuel model coverage Modify with National FCC coverage (hourly, 1 km resolution) Identify Fire Boundaries (daily, 1 km resolution) Read from National Fire Occurrence database MM 5 Meteorology 2 pm local time Temperature; Relative humidity; Cloud cover; Wind speed Daily Temperature range; Relative humidity range Past 7 days Precipitation; Same as above Generate species Emissions & Plume Rise (hourly, regional model resolution) Calculate Fuel Moisture Content (daily, weekly, regional model resolution) NFDR calculations based on MM 5 input for range of variables at 36 km resolution Develop emissions profiles to scale species from EPM generated emissions & to generate hourly emissions distributions. Calculate Fuel Consumption Estimate plume rise based on Briggs at appropriate resolution for the spatial scale of emissions. Utilize CONSUME to generate fuel consumption and EPM to estimate emissions & heat release rate for each fire. (daily, regional model resolution)
 CSEM Approach 1. Identify fire boundaries; 2. Identify vegetation & fuels involved; 3. Calculate fuel moisture content; 4. Calculate fuel consumption; 5. Calculate fire emissions; 6. Speciate fire emissions & calculate plume rise.
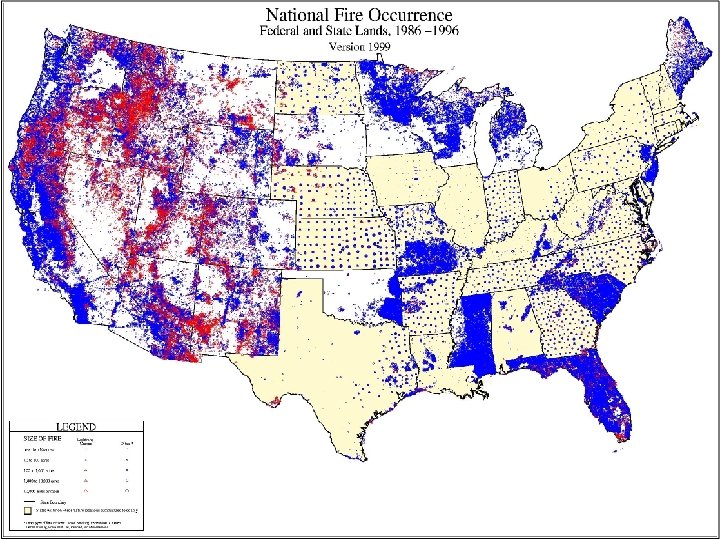
 Identify Fire Boundaries (daily,") Identify fire boundaries FIRES Fire Generator (hourly, 1 km resolution) Identify Fire Boundaries (daily, 1 km resolution) Read from National Fire Occurrence database • Time, location, & size of fires determined from National Fire Occurrence Database (Hardy, et. al. Missoula Fire Lab. ) • Federal & most State fires, from 1986 -1996, at 1 km resolution in a daily GIS database.
Identify fire boundaries FIRES Fire Generator (hourly, 1 km resolution) Identify Fire Boundaries (daily, 1 km resolution) Read from National Fire Occurrence database • Time, location, & size of fires determined from National Fire Occurrence Database (Hardy, et. al. Missoula Fire Lab. ) • Federal & most State fires, from 1986 -1996, at 1 km resolution in a daily GIS database.
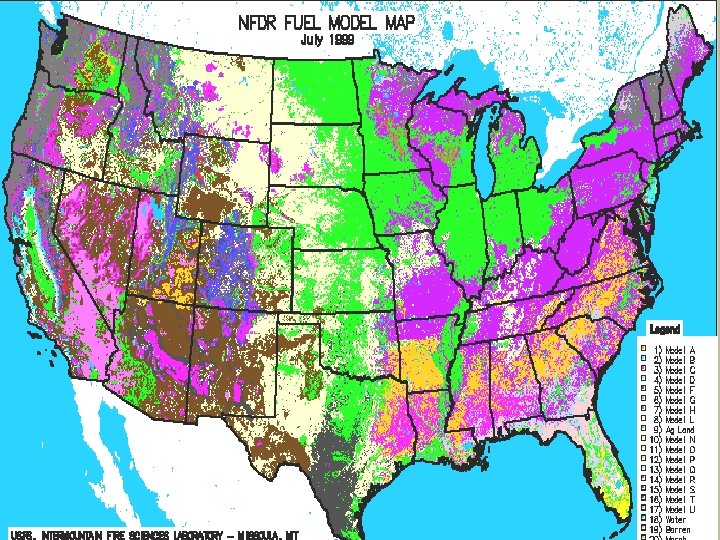
 Read") Identify vegetation & fuels Identify vegetation cover & fuel loadings (1 km resolution) Read from NFDR fuel model coverage Modify with National FCC coverage • Identify NFDR fuel model at 1 km resolution from Bergen, et. al. , 1998 • Modify fuel loading, if necessary, using fuel National Current Condition Class coverage (Hardy, et. al. Missoula Fire Lab. )
Identify vegetation & fuels Identify vegetation cover & fuel loadings (1 km resolution) Read from NFDR fuel model coverage Modify with National FCC coverage • Identify NFDR fuel model at 1 km resolution from Bergen, et. al. , 1998 • Modify fuel loading, if necessary, using fuel National Current Condition Class coverage (Hardy, et. al. Missoula Fire Lab. )
 NFDR calculations based on MM") Calculate Fuel Moisture Content (daily, weekly, regional model resolution) NFDR calculations based on MM 5 input for range of variables at 36 km resolution • Use NFDR equations based on data from MM 5 including daily temperature & RH range, wind speed, cloud cover, precip. • Drought indices from MM 5 • Resolution from MM 5
Calculate Fuel Moisture Content (daily, weekly, regional model resolution) NFDR calculations based on MM 5 input for range of variables at 36 km resolution • Use NFDR equations based on data from MM 5 including daily temperature & RH range, wind speed, cloud cover, precip. • Drought indices from MM 5 • Resolution from MM 5
 Utilize CONSUME to") Calculate Fuel and Emissions Calculate Fuel Consumption (daily, regional model resolution) Utilize CONSUME to generate fuel consumption and EPM to estimate emissions & heat release rate for each fire. • Use CONSUME with NFDR model estimates of fuel loading & moisture content. • Use EPM to generate PM 10, PM 2. 5, CO & heat release rate.
Calculate Fuel and Emissions Calculate Fuel Consumption (daily, regional model resolution) Utilize CONSUME to generate fuel consumption and EPM to estimate emissions & heat release rate for each fire. • Use CONSUME with NFDR model estimates of fuel loading & moisture content. • Use EPM to generate PM 10, PM 2. 5, CO & heat release rate.
 Speciate Emissions and Calculate Plume Rise Generate species Emissions & Plume Rise (hourly, regional model resolution) Develop emissions profiles to scale species from EPM generated emissions & to generate hourly emissions distributions. Estimate plume rise based on Briggs at appropriate resolution for the spatial scale of emissions. • Develop emissions profiles from ratios of species to calculated CO emissions from current research results. • Calculate plume rise using Briggs per SASEM
 CH") Emissions Speciation CO 2 1521 g/Kg 1833*CE g/Kg CO 144 961 - (984*CE) CH 4 6. 8 42. 7 – (43. 2*CE) PM 2. 5 12 67. 4 – (66. 8*CE) PM 10 14 1. 18*PM 2. 5 EC 0. 7 (0. 7) 0. 072*PM 2. 5 OC 5. 8 (5. 8) 0. 54*PM 2. 5 NOx 3. 1 (2. 0) 16. 8*MCE-13. 1 NH 4 0. 6 0. 012*CE VOC 6. 8 (5. 3) 0. 085*CE SO 2 0. 8 (0. 8) CE = CO 2 / {CO+CO 2+CH 4+Cother} MCE = 0. 15+. 86*CE
Emissions Speciation CO 2 1521 g/Kg 1833*CE g/Kg CO 144 961 - (984*CE) CH 4 6. 8 42. 7 – (43. 2*CE) PM 2. 5 12 67. 4 – (66. 8*CE) PM 10 14 1. 18*PM 2. 5 EC 0. 7 (0. 7) 0. 072*PM 2. 5 OC 5. 8 (5. 8) 0. 54*PM 2. 5 NOx 3. 1 (2. 0) 16. 8*MCE-13. 1 NH 4 0. 6 0. 012*CE VOC 6. 8 (5. 3) 0. 085*CE SO 2 0. 8 (0. 8) CE = CO 2 / {CO+CO 2+CH 4+Cother} MCE = 0. 15+. 86*CE
 Blue. Sky Smoke Modeling Framework • Local and Regional applications • Real-time predictions • Automated, centralized processing • Emission tracking • Predicted of surface concentrations • Quantitative verification • Community model development • Web-access control and output products
 Blue. Sky: Basic Elements Source Characteristics Variable rate of heat, gas, & particles 1. Burn Plan Data 2. Burn Accomplishments 3. Fuel moisture 4. Ignition pattern Weather Emissions 1. Regulatory approval 2. NAAQS output 3. Visibility 4. Chemistry Dispersion Output Products Full physical, 3 -D, with detailed PBL Interactive Web Mapping
 • Overlay Data –") Blue. Sky. RAINS • EPA Rapid Access INformation System (RAINS) • Overlay Data – Static Data - Sensitive Receptors, Geo-Political Boundaries – Transitory Data - Meteorological Data, Trajectories, Smoke Dispersion • Orthogonality of Design - Time, Space, Data • Ability to “Drill-In” to the Data - Burn Reports, Time Series • Turn Fires on and off • Obtain Fire Contribution Information at Receptors
Blue. Sky. RAINS • EPA Rapid Access INformation System (RAINS) • Overlay Data – Static Data - Sensitive Receptors, Geo-Political Boundaries – Transitory Data - Meteorological Data, Trajectories, Smoke Dispersion • Orthogonality of Design - Time, Space, Data • Ability to “Drill-In” to the Data - Burn Reports, Time Series • Turn Fires on and off • Obtain Fire Contribution Information at Receptors
 The Blue. Sky. RAINS System MM 5 FASTRACS CALMM 5/CALMET EPM/CONSUME v 1. 02 MM 52 ARL CALMET 2 net. CDF EPM 2 BAEM CALPUFF 2 net. CDF HYSPLIT PAVE Animations Blue. Sky Linux System Burn Report Display Blue. Sky. RAINS Windows System Preliminary Blue. Sky web page Time Series Display CALPUFF/Arc. IMS Linkage (net. CDF 2 SHP (? )) Arc. IMS (SDE, SQLserver) TRAJREAD
 http: //www. Blue. Sky. RAINS. org
 Blue. Sky. RAINS: Hysplit forward trajectories
 Blue. Sky: Predicted Surface Concentrations
 Blue. Sky: Predicted Surface Concentrations
") USFS/Fire Consortia for Advanced Modeling of Smoke and Meteorology (Fire. CAMMS)
USFS/Fire Consortia for Advanced Modeling of Smoke and Meteorology (Fire. CAMMS)
 Comparison of CSEM and Blue. Sky Preliminary Results • Comparative data inputs from 2002 Oregon fire (actual vs. 1996 met) • Blue. Sky CSEM • • • Area of Burnsite [acre] 500 0 - 0. 25 inch fuel [tons/acre] 1. 0 2. 9 0. 25 - 1 inch fuel [tons/acre] 2. 2 2. 3 1 - 3 inch fuel [tons/acre] 1. 6 5. 6 3 - 9 inch fuel [tons/acre] 5. 4 13. 2 9 - 20 inch fuel [tons/acre] 24. 6 0 20+ inch fuel [tons/acre] 0. 1 0 Duff 8. 0 2. 5 Burn-site slope [percent] 50 50 Ignition time [HHMM] 1400 10 -hr fuel moisture 9 13. 5 • Surface wind speed (mph) 6 5. 5
 Comparison of CSEM and Blue. Sky Preliminary Results Heat Released PM 10
 Summary • Two efforts are underway to Develop Emissions Models for Wildland Burning – Blue. Sky - Uses available Burn Reporting Systems – CSEM - Fire Occurrence Database, NFDRS • Both systems rely upon the Emission Production Model (EPM) and Fuel Consumption Model (CONSUME) and produce similar results. • The Blue. Sky and CSEM Systems Complement Eachother – Blue. Sky is an example of where the Fire Community wants to BE. – CSEM is necessary for integrating Fire into CMAQ.