

61628fe4a96d473d71dd78c9b67d30bb.ppt
- Количество слайдов: 78
 Insurance markets under different macroeconomic scenarios Presentation for Aspen Re Oxford Economics, December 2009 aslater@oxfordeconomics. com
 Executive summary l In this analysis, we assess the implications of different global macroeconomic environments on prospects for asset prices, insurance premiums, and insurance pricing. The alternative economic scenarios considered are: ■ Our baseline forecast, GDP drops 3 -5% in the major economies in 2009. Weak growth of domestic demand means growth remains well below trend in 2010 but gathers pace in 2011 as the effects of fiscal and monetary stimulus come through. Interest rates remain close to zero for most of 2010. In emerging markets, the rebound is stronger thanks to solid internal growth dynamics in key countries. Probability 50% ■ W-shaped recovery. Growth is faster than expected in the short-term thanks to a turn in the stock cycle, but final demand remains weak as banks and households continue to deleverage. A further rise in commodity prices also saps consumer purchasing power, and financial and credit market conditions are slow to thaw thanks to the weight of bad debts. Growth stronger in 2010 than in the baseline but much weaker in 2011. Probability 20% ■ Deflation. Very weak growth persists through 2010 and in some countries even 2011, and deflationary conditions emerge. The negative feedback effect from high unemployment and falling corporate profits undermines the banking sector and raises savings ratios, weighing heavily on economic activity. Monetary policy is unable to overcome weak credit supply and fiscal policy is constrained by large budget deficits. Interest rates remain very low for an extended period. Probability 10%.
 Baseline scenario • World GDP to fall 2. 1% in 2009, worst year since 1945. No full recovery until 2011 • Emerging market growth under 1% in 2009 but solid recovery in 2010 -2011. Major industrialised countries more sluggish. • Headline inflation to stay low in major economies but prolonged deflation avoided
 W-Shaped scenario • Stronger initial growth due to turn of the stock cycle • Final demand remains weak due to private sector deleveraging • Further rise in commodity prices saps consumer demand • Stronger growth in 2010 gives way to renewed weak growth in 2011
 Deflation scenario • Slide into deflation as monetary policy proves ineffective – consumers and businesses delay purchases. • Banking sector remains hobbled by bad loans, falling collateral values. • Extended recession with interest rates remaining very low for a lengthy period. Similar to Japan in the 1990 s.
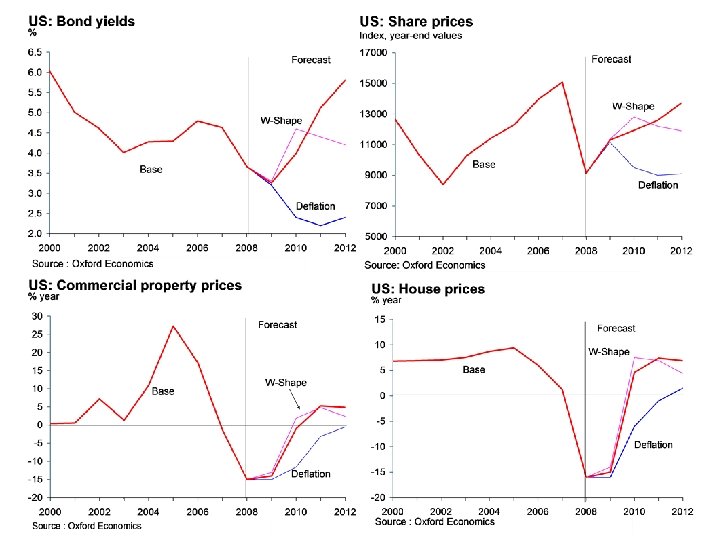
 Asset prices under different scenarios l The investment environment varies significantly depending on the economic background l Baseline forecast ■ Equity markets the recovery seen from 2009 Q 2 continues into 20102012 on the back of low interest rates, attractive valuations and the return of global growth to trend. The equity rally is relatively synchronised across countries but share prices still remains below 2007 levels even in 2012. ■ Bonds perform relatively poorly, losing ground from 2010 as the global recovery starts to become established and monetary tightening is anticipated, and then materialises. ■ Property: Recovery in real income growth, easing credit conditions and relatively low interest rates rekindle demand for commercial property and housing. The recovery is however held back by high valuations in some countries (e. g. the UK) and from 2010 -2012 real house prices rise significantly only in the US.
 Asset prices under different scenarios l W-Shaped scenario: ■ Share prices recover faster in 2010 than in the baseline on hopes of a sustained recovery but the rally runs out of steam in 2011 as final demand remains weak and growth falters. ■ Bonds: significant losses in 2010 as the world economy appears to be staging a stronger-than-expected recovery, but yields edge down again thereafter as growth disappoints. ■ Property a stronger recovery in property prices in 2010 than in the base case, but property price growth falls back below that seen in the base case in the latter part of the forecast period as growth slips back below trend in the major economies.
 Asset prices under different scenarios l Deflation: ■ Share prices fall back again in 2010 on weak growth, depressed corporate profitability and a badly impaired financial sector. The recovery from 2011 is slow across countries as the world remains mired in a low-growth trap, profitability is weak, and monetary growth is anaemic. ■ Bonds: yields keep on falling into 2011 as deflation takes hold, short rates remain at very low levels, and investors prefer to hold ‘safe’ assets in their portfolios. ■ Property returns are very poor, especially in the UK. Commercial property weakens markedly as economic growth slows sharply. An elongated disruption of credit markets stifles the supply of mortgage credit and delays the recovery of housing markets despite very low interest rates.
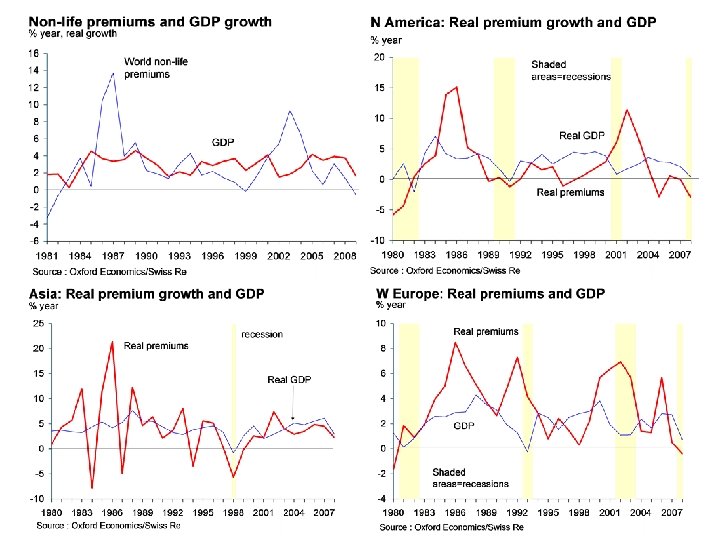
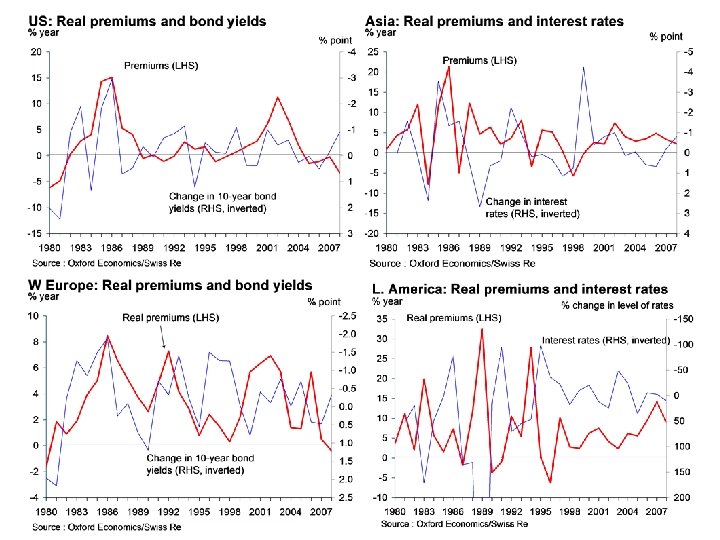
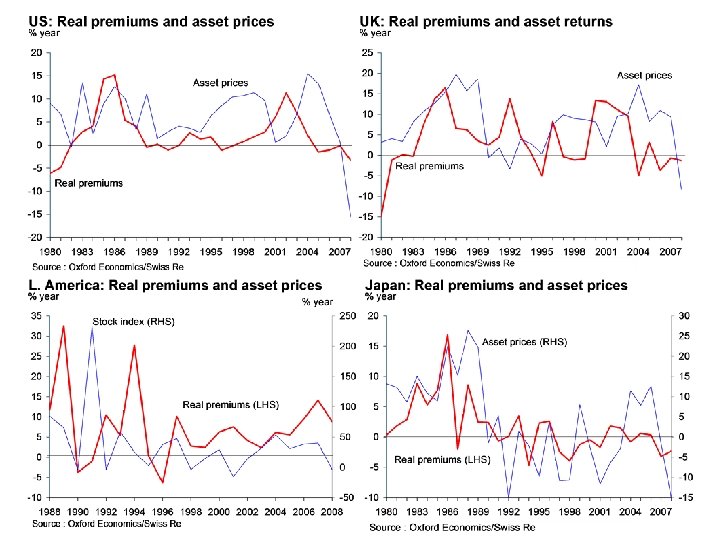
 Insurance premiums and macroeconomic factors l A number of macroeconomic factors influence the growth of insurance premiums ■ Economic growth – world real premiums have grown broadly in line with real GDP growth since the early 1980 s. There are considerable differences between regions, however. Premium growth is generally slower in the advanced industrialised countries and more in line with economic growth. In emerging markets, premium growth has generally been faster than average GDP growth, reflecting the ‘catch up’ of these more immature insurance markets. Rapid growth in emerging Europe and Latin America has contributed to faster overall growth in world premiums since the late 1990 s. In recessions, premium growth normally dips, but there can be exceptions, such as 2001. ■ Interest rates – the interest rate cycle is an important influence on real premium growth. Rising bond yields tend to depress premium growth, especially in the mature industrialised countries, whereas periods of rapidly falling rates have been associated with faster premium growth. ■ Asset prices – the rate of growth of asset prices can also be an influence on premium growth, as it impacts the growth of important submarkets such as housing markets. In the industrialised countries, premium growth tends to be more closely correlated with interest rates than asset prices. But Japan in the 1990 s showed that a prolonged period of weak asset prices can have a marked depressive effect on real premium growth.
 Insurance premiums and economic growth
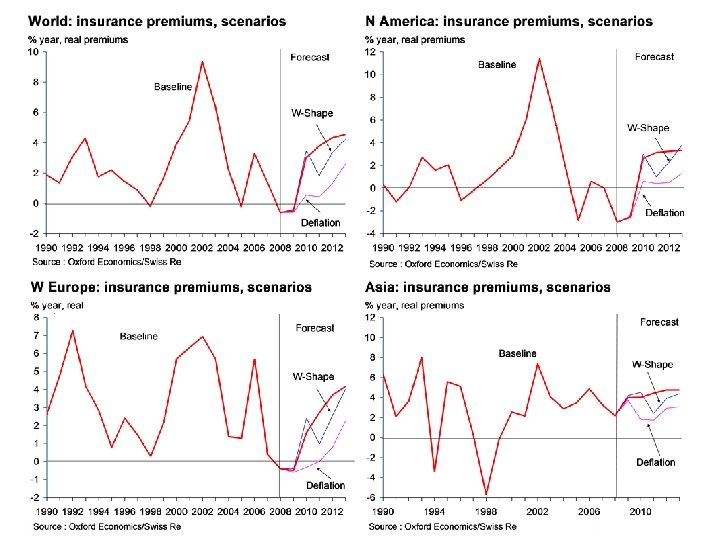
 Insurance premiums under different scenarios l The development of premium growth varies under the different scenarios as follows ■ The baseline forecast sees real world premium growth at -0. 5% in 2009 in the wake of the global recession and the accompanying fall in asset prices. This is supported by preliminary data which suggests premium growth was negative in the US, several major western European countries, and eastern Europe (especially Russia). By contrast, premium growth appears to have held up well in much of Asia (especially China) and parts of Latin America (e. g. Brazil). ■ In 2010, a rebound to 3% real premium growth is expected as economic recovery becomes established in the major industrialised countries and emerging market growth also strengthens. Latin America and Asia build on their resilient performances of 2009 while eastern Europe recovers from the sharp drop it suffered in 2009. World premium growth broadly returns to recent average rates from 2011 onwards.
 Insurance premiums under different scenarios l Other scenarios ■ In the W-shaped case, real premium growth initially recovers a little faster than in the baseline scenario on stronger growth and a better asset market performance. But as the recovery falters in 2011 -2012 and asset markets sag again, real premium growth drops back below that seen in the baseline. ■ In the case of deflation real premium growth is very low in 2010 and 2011 as consumers suffer from mounting unemployment, a rising real debt burden and weak house and stock prices. Weak economic growth drags on into 2011 -2012, and asset prices are very slow to recover, continuing to depress real premium growth. Even at the end of the forecast period, real premium growth remains well below long-term average rates.
 Insurance premiums - pricing l Insurance pricing is subject to an ‘underwriting cycle’. In this cycle, increasing competition drives down premiums to low levels, followed by a significant exit of insurers, often triggered by catastrophic losses. This creates a shortage of underwriters, leading to rising premiums. A fresh round of new entrants are then attracted to the industry, driving premiums down once again. l Economic factors can also have an impact on pricing, however. An important influence is the global interest rate cycle. Insurers tend to invest mostly in fixed income instruments, so that sharp drops in interest rates reduce their investment returns, and sharp rises increase them. Falling investment returns can lead to insurers increasing their prices, while rising returns see prices falling.
 Insurance premiums - pricing l Bull markets in equities or other assets can also lead to lower insurance pricing, as insurers compete to raise funds to invest in the assets concerned. l Conversely, falling asset prices can lead to rising prices as investment returns prove insufficient to meet expected claims and other outgoings, and industry equity is eroded. Upward pressure on pricing was evident in early 2009 in line with the above arguments. l More recently, the recovery in capital markets has started to remove the pressure for higher prices. l Industry capital was eroded by as much as 15 -20% in 2008 and early 2009 but a large part of these capital losses has been regained thanks to the recovery in fixed income and equity markets. l Going forward, a low interest rate environment will keep current income on insurers’ asset portfolios subdued and there will also be further asset writedowns due to credit defaults. But asset values should rally further, offsetting these effects.
 Insurance premiums - pricing l In our baseline scenario prices fall back in 2010 as asset markets recover, further improving investment returns and reducing the incentive for firms to exit the industry - thus maintaining strong competitive pressures. Further downward pressure is visible in 2011 -2012. l In a W-Shaped scenario, prices initially fall faster than in the baseline, as interest rates rise faster and equity markets recover more quickly, but as equity markets stagnate and interest rates fall again later in the forecast period, upward pressure on prices re-emerges. l In a deflation scenario, featuring low interest rates and depressed asset prices, we would expect insurance premiums to come under upward pressure in 2010 -2011 with a significant reduction in industry capacity and competitive pressures. There might also be sector-specific upward pressures, e. g. concerning sectors especially at risk of insolvency/default.
 World rate online index and interest rates
 World rate online index and stock prices
 World ROL index – different scenarios
 Credit default outlook l Default rates have continued to rise through the year on most classes of debt. In the US, loan charge-off rates on consumer, business, residential and commercial real estate are all above previous cyclical peaks. l The depth of the recession and the steep fall in asset prices points to overall loan loss rates among banks being likely to peak at levels close to those seen during the Great Depression. l Overall eventual losses for global banks on securities and loans are estimated by OE at US$3. 5 trillion in our base case, around US$300 billion lower than the July estimate. l In a deflation scenario (weaker growth and asset prices), the scale of losses is expected to be significantly higher, while in the W-Shaped scenario (faster initial growth and recovery in asset prices) losses are expected to be more modest.
 Loan losses rising across sectors…
 …with loss rate forecast close to that of 1933
 Estimated global losses on loans & securities 2007 -2010 Source: IMF, Bank of England Oxford Economics
 Corporate credit default outlook l The volume of defaults has been massive over the last 18 months. The value of defaulted corporate debt in 2008 was over US$430 billion, with a further US$573 billion of defaults in the first eleven months of 2009. l The default rate continues to rise. The global speculative grade default rate rose above 12% in the third quarter of 2009, to the highest rate seen since the 1930 s. l Defaults remain most serious in the US. The speculative grade default rate is running at around 13. 5% in the US. But Europe is catching up, with the default rate having reached 9. 5% from just 0. 7% in 2008. l Defaults may have peaked. Although the 12 -month trailing default rates have continued to rise in recent months, the flow of new defaults has slowed. Moody’s and S&P now expect the default rate to peak in 2009 Q 4 and fall back to 7 -9% on average in 2010. l Risks remain. High levels of debt remain at risk – debt owed by the riskiest issuers, with ratings below B- and negative outlook, totals US$270 billion. And US$160 billion of speculative-grade debt is coming due in 2010 -2011.
 Corporate credit default outlook l Forecasts for the development of corporate defaults in 2010 have improved since mid-2009, but current forecasts still point to a default rate well above the long-term average next year, on top of the massive defaults seen in 2008 -2009. l As default/loss rates are highly sensitive to cyclical economic factors, they can be expected to vary somewhat in different macroeconomic scenarios■ In our base case we expect the speculative default rate to decline from 10. 5% in 2009 to 8% in 2010 and 4. 5% in 2011, dropping below 2% by 2013. ■ In the deflation scenario we see a renewed rise in the default rate to 11. 5% in 2010 and a much slower drop thereafter than in the base case, with defaults above long-term averages until 2013. ■ In the W-shaped scenario, the default rate drops faster than in the baseline in 2010 but then declines more slowly than in the baseline as global growth weakens again.
 2009 corporate defaults exceed even 2008 levels…
 …with default rate headed for post-depression record
 …but likely to decline in 2010
 Default outlook – mortgages l Mortgage loans. Distress levels in the US mortgage market have continued to rise, albeit at a reduced pace. In 2009 Q 3 the delinquency rate rose to 9. 6%, with a further 4. 5% of loans in the process of foreclosure. l Among subprime mortgages the arrears level is 26%, with a further 15% of loans in foreclosure. But even among prime loans, arrears are at 7% and foreclosures 3. 2% - very high levels both historically and in international comparison. l Based on IMF and Bank of England work we estimate ultimate losses on residential mortgage loans in the US, Eurozone and UK could total US$620 bn or 6. 4% of the total. This is our base case. l Scenarios – ■ In the deflation scenario we see the loss rate reaching 8. 9% of the total. ■ In the W-shaped scenario, mortgage loan losses are expected to be lower than in the base case, at 5. 4% of the total.
 Default outlook – mortgage backed securities l Mortgage-backed securities. Loss estimates on RMBS and related securities based on current market prices have tended to be biased upwards due to the effects of illiquidity. l Our latest estimates follow the new IMF methodology which attempts to correct for this, and this largely explains the lower losses presented this time. l However, delinquency rates on underlying pools of securitised mortgages have continued to grow, with rates of up to 50% on subprime RMBS issued in 2006 and 2007 and 30 -35% on Alt-A RMBS issued in the same period. So final losses still look likely to be very high. l Scenarios – ■ In the deflation scenario, ultimate RMBS losses could reach 15% of the total. ■ In the W-shaped scenario, losses are forecast to be lower, at around 9% of the total.
 Mortgage defaults still rising
 Default outlook – commercial property l Commercial property loans – We estimate global losses on commercial property loans at around US$290 billion. This implies a loss rate around 7%. Commercial property prices have started to stabilise in some countries, but with values still as much as 40 -50% below peak, a high rate of losses looks inevitable. The US delinquency rate reached almost 9% in 2009 Q 3 compared to less than 5% a year before, and is unlikely to have peaked. l Commercial mortgage backed securities – delinquency rates on CMBS have also continued to rise, especially in the US. As a result we also forecast US$230 billion of losses on CMBS, a loss rate of 13%. l Scenarios ■ In the deflation scenario we forecast the loss rate on commercial property loans at 12% and on CMBS at 21%. ■ In the W-shaped scenario we forecast loss rates of 6. 1% on commercial property loans and 11% on CMBS.
 Default outlook – consumer lending l Consumer loans – default rates have continued to rise, with a particularly steep increase in the US consumer loan charge-off rate, which reached 5. 9% in 2009 Q 3. This is much higher than in previous recessions. l We estimate ultimate global losses on consumer loans of US$440 billion, or around 6% of the total. On consumer securities, we estimate losses of US$70 billion, around 8% of the total. These estimates form our base case. l Scenarios ■ In the deflation scenario we forecast consumer loan loss rates of 9. 6%, and on consumer securities loss rates of 12. 5%. ■ In the W-shaped scenario we forecast consumer loan loss rates of 4. 6% and consumer securities loss rates of 6%.
 Estimated losses on global loans and securities, different scenarios Source: IMF, Bank of England Oxford Economics
 Securitisation outlook l Securitisation volumes appeared to pick up in the first half of 2009, especially in the US, and spreads on asset-backed securities have narrowed considerably. But primary markets remained largely closed. The great bulk of new issuance has been retained rather than being sold to end investors. l European securitisation volume totalled € 81 billion in 2009 Q 2, comparable to issuance levels in 2007 H 2. But almost all of this issuance was retained for the purpose of repo transactions with the ECB, with only a few placements to investors. l US securitisation markets saw issuance of US$460 billion in 2009 Q 2, but this was almost entirely the result of agency MBS issuance of US$420 billion. Private label issuance remains very low despite funding from the TALF programme, and a portion of it represents so-called ‘Re-remic’ transactions – the re-securitisation of existing downgraded securities. l Financial market stress levels have dropped, but remain relatively high – still above the level seen in the wake of the Russian crisis in 1998.
 Securitisation outlook l Our base case still looks for no early recovery of underlying securitisation volumes. Historical examples e. g. from the LBO market in the 1990 s and emerging market debt in the 1980 s suggest markets exposed to the kind of shock suffered by securitisation markets can take many years to recover. Bank off-balance sheet vehicles, which formed much of the investor base, have in many cases been wound up – and regulatory changes may intensify this trend. l A gradual pickup of the market for high quality securitised assets will occur over 2 -3 years as uncertainties over credit quality ease and with some help from government guarantees, but securitisation of poorer quality assets will likely remain minimal for several years. l In a deflation scenario, the recovery period for high grade securitisation markets will be even longer, perhaps 3 -5 years. l In the W-Shaped scenario, the recovery in securitisation volumes would begin earlier than in the base case but volumes would still remain at low levels for an extended period.
 Securitisation volumes recovering…
 …but primary issuance still very weak
 Financial market stress has fallen…
 …but risk of a long-term hiatus for securitisation * 2008 & 2009 data exclude retained volumes
 Securitisation volumes, different scenarios
 Freight Outlook l Baseline: . The BDI reached a fresh 2009 high of 4, 000 in November as iron ore and coal imports into China surged. However, market fundamentals suggest that this rally is unsustainable. In particular, stockpiles of commodities in China are being built with little end-user demand, suggesting that imports could fall back sharply. And despite shipping orders being delayed, shipping capacity is set to increase sharply in 2010. This will place downward pressure on the BDI which is expected to average 3, 900 in 2010. The shipping industry will continue to be plagued by excess capacity for most of the forecast period, but the extent of this will narrow as global demand rises and old ships are scrapped. As a result, we expect the BDI to steadily trend upwards after 2010, averaging 4, 500 in 2011 and around 5, 000 and 6, 000 in 2012 and 2013 respectively. l W-Shaped: A faster rate of restocking, and the lagged impact of policy stimulus initially boosts global growth more than currently expected in the baseline. This curtails the cancellation of orders and planned scrapping as the BDI quickly surpasses its five-year average of over 5, 000. However, as growth starts to weaken again from 2011, demand for dry bulk commodities softens. The increase in excess capacity causes the BDI to fall to a low of around 3, 000 in 2011. The balance between demand shipping capacity is gradually narrowed over the remainder of the forecast period but even in 2013 freight rates remain below the baseline. l Deflation: Weaker global demand is forecast over the entire forecast period. Shipping orders placed in 2008 -2009 are cancelled and new shipping orders plunge in 2010. Furthermore, given the weaker economic outlook new orders remain low over the forecast period. The BDI remains below the baseline case for the entire forecast period albeit the gap is closing due to rebalancing between world trade and shipping by the end of the forecast period.
 World trade volumes
 Freight rates in different scenarios
 Carrier fleet, different scenarios
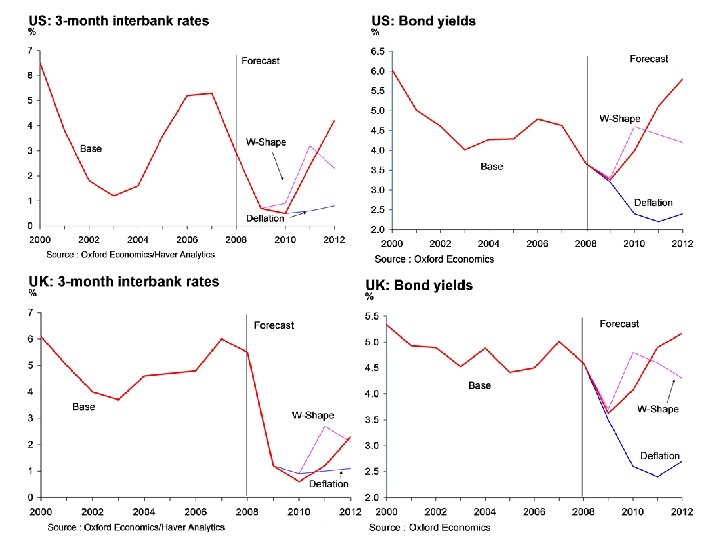
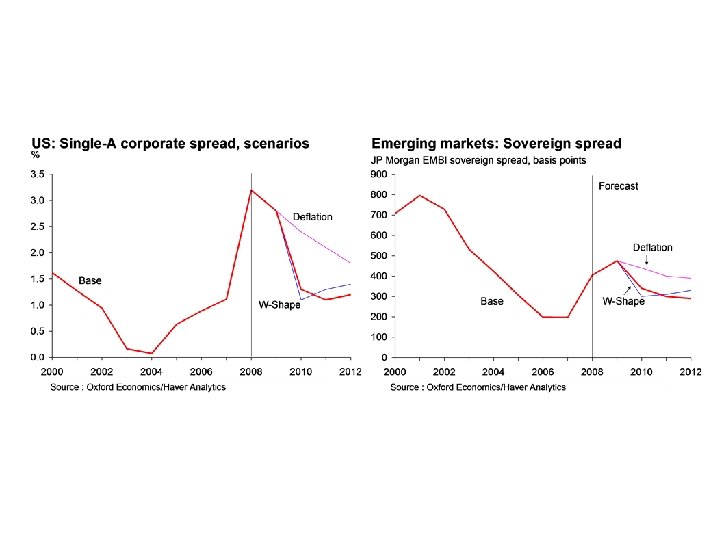
 Global interest rates l Central banks have maintained short term rates at very low levels for most of 2009. An easing of financial stress and heavy provision of liquidity by central banks has also led to the spread between interbank and central bank rates dropping significantly, to close to ‘normal’ levels. l Corporate bond spreads have narrowed sharply from the extreme levels seen earlier this year, but remain well above pre-crisis levels. l Government bond yields initially dropped after the announcement of large asset purchase schemes by central banks, but have subsequently rebounded thanks to improved risk appetite linked to the world economy bottoming out. Going forward, the tailing off of asset purchase schemes and large fiscal deficits is likely to push bond yields up further. l Emerging market bond yields have dropped sharply from their late 2008 peaks as capital outflows have eased in line with lower global financial stress and resilient growth in a number of key emergers. l Scenarios – in the deflation scenario, short term rates remain low and credit spreads wide for an extended period. In the ‘W-Shape’ scenario rates initially rise faster than in the base and spreads narrow faster, but rates are falling/spreads widening again by the end of the forecast period.
 World interbank rates
 US single-A corporate bond spreads
 Sovereign bond yields – major countries
 Sovereign bond yields – emerging countries
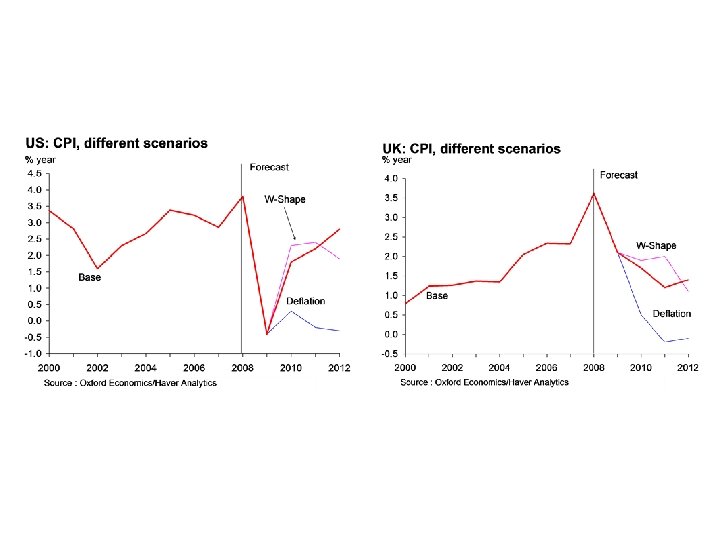
 Global Inflation Risks l Central banks have engaged in significant expansion of their balance sheets over the last year. So-called ‘quantitative easing’ in the US and UK has amounted to 2. 5 -3 times the initial level of base money. l But broad money supply measures, which are the important measures in terms of gauging future inflation risks, are growing at only a modest pace, with credit growth negative. l Inflation expectations have risen in recent months, but remain contained at levels consistent with central bank medium-term inflation targets. l Wage growth, another measure of inflation expectations, still looks to be trending downwards l All the major economies also face large output gaps – inflation is unlikely to take off while massive spare capacity exists in the economy l So while the risk of a slide into prolonged deflation has receded, thanks to central bank actions, the risk of high inflation looks small – less than 10%.
 Big expansion of central bank money…
 …but broad money growth modest
 Inflation expectations still contained…
 …and wage growth under downward pressure
 Massive spare capacity in the major economies
 Global Energy Investment l Renewable energy investment has risen strongly over recent years. In 2008, the UN estimates it totaled US$140 billion, more than double the level of 2004. l This constituted 56% of the total estimated dollar value of energy investment – the first year renewables had accounted for a majority of energy capex. l Investment dropped off sharply as a result of the global financial crisis, falling more than 50% year-on-year in 2009 Q 1. This appears to have been the result of the general disruption of capital markets and the flight by investors from sectors perceived as ‘risky’. l The latest data show a renewed rise in investment, with investment at US$29 billion in Q 2 and US$26 billion in Q 3, more than double the low point of 2009 Q 1. Investment remains 20% down on the year, however. l The reduction in financial stress levels appears to have eased financing constraints on renewables investment, with share issues, venture capital and private equity fundraising all recovering from their lows.
 Renewable energy investment
 Conclusions l Our baseline forecast sees the recovery in financial markets that began in 2009 Q 2 continuing into 2010 as strong policy stimulus leads to an economic upturn, which gathers traction from 2011. Bonds lose ground as recovery begins, while property performance slowly improves as fundamentals become more supportive. l In the W-Shape scenario equity and property markets initially perform better than in the baseline, but the rally runs out of steam by the end of the forecast period as growth disappoints. In the deflation scenario stock and property prices are much weaker than in the base case and bonds perform relatively well. l Insurance premium growth is broadly correlated with economic growth, interest rates and asset prices. Global premium growth was negative in 2009 thanks to the recession, although some emerging markets in Asia and Latin America proved resilient. We forecast a pickup in real premium growth to 3% in 2010 and stronger growth from 2011, led by emerging markets. l In the two variant scenarios, premium growth is lower than in the base case. The W-shape scenario produces stronger premium growth in the early part of the forecast period but thereafter, growth is weaker than in the base. The deflation scenario sees a long period of weak premium growth due to an extended period of very low GDP growth and weak asset values. l Insurance pricing has a loose and negative relationship with interest rates and asset returns. Upward pressure on pricing was visible in early 2009 but started to dissipate later in the year as financial markets recovered. Our baseline forecast sees downward pressure on prices in 20102012. In the W-Shape scenario prices initially fall faster but then harden later on while in the deflation scenario there is upward pressure on prices in 2010 -2011.
 Conclusions l Default rates have risen sharply across sectors over the last year, especially for corporate, mortgage and consumer debt. The value of corporate defaults alone was US$430 billion in 2008 and US$573 billion in the first eleven months of 2009. l Overall loan loss rates are likely to peak close to the record levels seen in the 1930 s, although the pace of corporate defaults seems to be slowing. OE estimates financial institutions will suffer ultimate losses of US$3. 5 trillion on loans and securities. l In a W-Shaped growth scenario, losses would be more modest than this, but in a deflation scenario they would be substantially higher. l Securitisation volumes have been held up by official intervention, especially in Europe but primary markets essentially remain closed and a recovery still looks some way off, despite an easing of financial stress levels. l We continue to see inflation risks as low, due to weak money growth and large output gaps and thus expect short-term rates to rise only slowly. Bond yields are set to rise further as recovery becomes established and fiscal deficits weigh. l Medium-term freight rates are generally weaker than our baseline forecasts in the two alternative macroeconomic scenarios, especially in the deflation case. l Investment in renewables was hit hard by the financial crisis but has recently shown signs of recovering as financing conditions have improved.
 Annex: scenario results
 Baseline forecast summary
 W-shape forecast summary
 Deflation forecast summary
 Asset price summary, base case All changes annual average changes
 Asset price summary, W-Shape All changes annual average changes
 Asset price summary, deflation All changes annual average changes
 Insurance premiums in different scenarios
 Insurance premiums in different scenarios
 Insurance premiums in different scenarios
 World insurance pricing – different scenarios