

Thurber_on_2016_Election_for_Russia.pptx
- Количество слайдов: 33
 Insights on the 2016 U. S. Election The Schedule, the Candidates, the Issues, the Voters, and Polarization James A. Thurber American University Center for Congressional and Presidential Studies www. american. edu/ccps
 • Phase 2:") Phases in the Campaign • Phase 1: Nominations (February to June) • Phase 2: The Conventions (July)(Contested? ) • Phase 3: The Debates • Phase 4: The Final Stretch (September. October) Center for Congressional and Presidential Studies www. american. edu/ccps
Phases in the Campaign • Phase 1: Nominations (February to June) • Phase 2: The Conventions (July)(Contested? ) • Phase 3: The Debates • Phase 4: The Final Stretch (September. October) Center for Congressional and Presidential Studies www. american. edu/ccps
 Number of Candidates Seeking the Presidential Nomination by Year 17 14 Republicans Democrats 8 7 7 7 6 6 5 5 4 3 2 2 1 1976 1980 1984 2 1 1988 1992 1996 1 2000 2004 1 2008 2012 2016
 Voters and Campaign Strategy in 2016 • Party Identification of Voters – 38% Independent, 34% Democrats 27% Republicans – Tea Party Groups, Independents, Minorities (Latinos) – Presidential Voter Turnout Center for Congressional and Presidential Studies www. american. edu/ccps
 Recent Presidential Voter Turnout Eligible Voter Turnout 70 65 60. 4 60 62. 3 57. 5 55 54. 2 50 2000 Source: Center for the Study of the American Electorate 2004 2008 2012
 Early Voting Percentage of votes that cast early in 2012: 31. 6% Source: United States Elections Project: Available: http: //elections. gmu. edu/early_vote_2010. html
 Historic Youth Turnout Estimate of 2012 youth turnout: 49. 3% Source: CIRCLE. Available: http: //www. civicyouth. org/quick-facts/youth-voting/#5
 Campaign Finance and Strategy • The Money Race: 6% Party, 38% PAC, & 56% Individual Campaign Funds • Obama ($745 m. 2008) • 2012: (Obama $1 b. +) (Romney $1 b. +) • Total: $4 b. in 2008 /$6 b. in 2012/$8 b. in 2016? • Citizens United vs. FEC/Super PAC Spending • Ground Wars (Micro Targeting-Base, Independents, Latinos, Retirees) • Use of New Social Media • Air Wars and increased Spending Center for Congressional and Presidential Studies www. american. edu/ccps
 Causes: Campaign Expenditure Increases Source: FEC, 1998 -2014 All dollars spent by presidential candidates, senate and house candidates, political parties and independent interest groups • • 1998 2000 2002 2004 $1. 62 b. $3. 08 b. $2. 18 b. $4. 15 b. • • • 2006 2008 2010 2012 2014 2016? $2. 85 b. $5. 29 b. $3. 65 b. $6 b. $3. 67 b. $8 b. ? Super PACs? Center for Congressional and Presidential Studies www. american. edu/ccps
 Party Conventions Republicans: July 18 -21, Cleveland, Ohio Democrats: July 25 -28, Philadelphia, Pennsylvania
 Conventions: Contested? • 2, 383 Democratic Delegates Needed for nomination • 1, 237 Republican Delegates Needed for nomination •
 The American Voter: Angry, Distrustful, Partisan, Sorted and Polarized
 •") Root Causes of Polarization and Gridlock • Voters (angry, distrustful, and politically polarized) • Sorting (race, gender, cultural, geographic and ideological) • Redistricting to Safe • Regional Realignment/State Legislatures • Polarized Media Center for Congressional and Presidential Studies www. american. edu/ccps
Root Causes of Polarization and Gridlock • Voters (angry, distrustful, and politically polarized) • Sorting (race, gender, cultural, geographic and ideological) • Redistricting to Safe • Regional Realignment/State Legislatures • Polarized Media Center for Congressional and Presidential Studies www. american. edu/ccps
 Partisan Divide Reflects Deeper Divisions in American Society for 2016 • The Racial Divide: As the nation has grown more diverse, the parties have diverged along racial lines (non-white 30% in 2016) • The Cultural Divide: A deep divide over lifestyles, values and morality (religion, gay marriage, prochoice/pro-life, guns) • The Ideological Divide: Democrats and Republicans differ sharply on a wide range of issues, especially the proper role and size of government (size of government, ACA-Obama care) • Gender Divide: White Males-Republican Party/Women -Democratic Party
 The Racial Divide • Nonwhites make up 30% in 2016, 28% of the electorate in 2012, up from 13% in 1992 • Romney (Republican) won the white vote by a margin of 20 points— 59 percent to 39 percent • Obama (Democrat) won the nonwhite vote by a margin of 62 points— 80 percent to 18 percent • Nonwhites made up 45 percent of Obama voters vs. 11 percent of Romney voters Source: Various National Exit Polls
 Electoral College Vote in 2012 Source: Washington Post. Available: http: ///www. washingtonpost. com/wp-srv/special/politics/election-map-2012/president
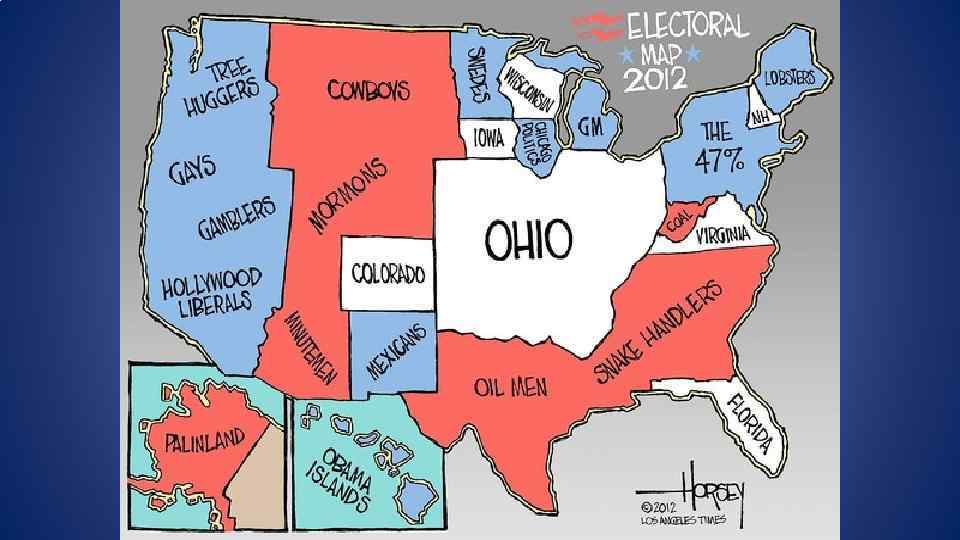
 The Electoral College Map Problem for the GOP: 1992 -2012 (271 Votes needed to win) • 18 States + DC: Democrats have had 242 Electoral Votes consistently since 1992 • 13 States: Republicans have had 102 Electoral votes consistently since 1992 • Hillary starts with a lead of 140 votes if she can hold the base of the party
 The Electoral College Map Problem for the GOP: 1992 -2012 • Hillary only needs to find 28 votes, if the base is held • Thus Base plus Florida (29 votes), she wins. • Or Base plus Virginia (13 votes) and Ohio (18 votes) • Or Base plus Nevada (6), Colorado (9), and North Carolina (15) she wins.
 Florida (29) Iowa (6)") 2016 – 9 Battleground States • • • Colorado (9) Florida (29) Iowa (6) Nevada (6) New Hampshire (4) Ohio (18) Pennsylvania (20) Virginia (13) Wisconsin (10) Center for Congressional and Presidential Studies www. american. edu/ccps
2016 – 9 Battleground States • • • Colorado (9) Florida (29) Iowa (6) Nevada (6) New Hampshire (4) Ohio (18) Pennsylvania (20) Virginia (13) Wisconsin (10) Center for Congressional and Presidential Studies www. american. edu/ccps
 What about 2016 congressional elections? • 34 Senate seats up for re-election – 24 Republicans…almost half the Caucus (6 competitive at this point) – 10 Democrats (one competitive at this point) – Net 3 need by Ds • 435 House Seats: 4 Dem. & 19 Rep. Toss Ups (net 30 needed by Ds to control the House) • Impact of presidential race? Disrupted Conventions? Does Trump hurt the Republicans? Do Sanders voters say home?
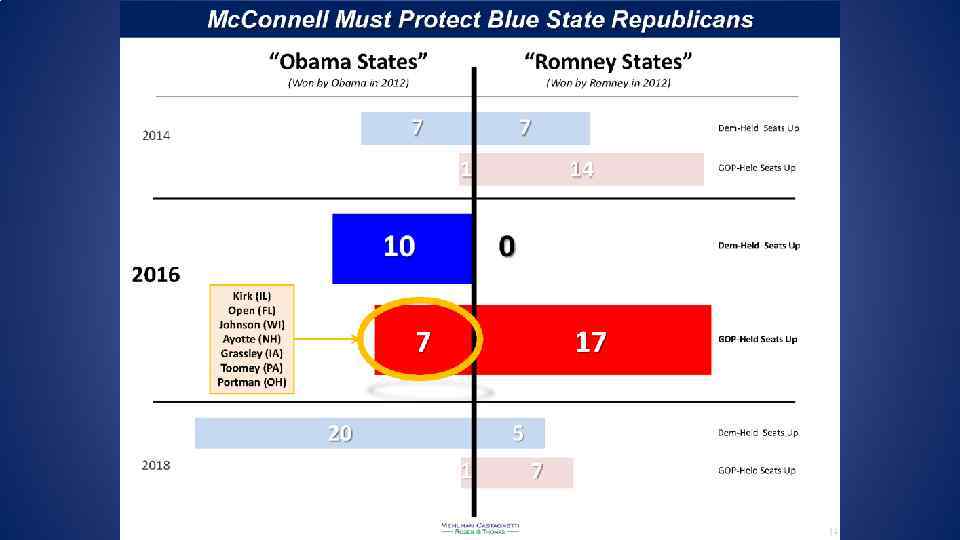
 • • Republicans: FL (Rubio) Kirk") Senate Toss Ups • Democrats: • NV (Reid) • • Republicans: FL (Rubio) Kirk (IL) Ayotte (NH) Portman (OH) Toomey (PA) Johnson (WI)
Senate Toss Ups • Democrats: • NV (Reid) • • Republicans: FL (Rubio) Kirk (IL) Ayotte (NH) Portman (OH) Toomey (PA) Johnson (WI)
 2016 House Races • Solid Seats: 206 Rep, 170 Dem • Likely/Lean Seats: 25 Rep, 13 Dem • Toss Up or Worse: 19 Rep, 4 Dem • Only 23 Competitive seats! Center for Congressional and Presidential Studies www. american. edu/ccps
 Both Trump and Clinton have very high negatives in the polls in the 60%s. Lesser of “two evils”? Trump Question: Do “establishment” Republicans vote for TRUMP? Hillary Question: Do Sander’s voters (especially 18 -29 year olds) vote for HILLARY?
 What are the consequences of the election for governing? Divided Party Government Partisan Polarization? Gridlock?
 Partisan Gridlock: Ideological Distribution of House Members 1982 Source: Bell, P. 2013. The Chasm in the Center of Congress. National Journal. 2/6/14 2015
 Partisan Gridlock: Ideological Distribution of Senate Members 1982 Source: Bell, P. 2013. The Chasm in the Center of Congress. National Journal. 2/6/14 2015
 Post Election Governance? • Little consensus about most important problems and threats • Little consensus about solutions to problems • Parties polarized and strong interest groups disagree about problems and solutions • Limits on resources, deficits/debt • Gridlock? Divided Party Government/Low Trust in Government Center for Congressional and Presidential Studies www. american. edu/ccps
 Questions? Comments? Center for Congressional and Presidential Studies www. american. edu/ccps