dc1928b92fd862fe3398d7352ed14801.ppt
- Количество слайдов: 64


 The following is intended to outline our general product direction. It is intended for information purposes only, and may not be incorporated into any contract. It is not a commitment to deliver any material, code, or functionality, and should not be relied upon in making purchasing decisions. The development, release, and timing of any features or functionality described for Oracle’s products remains at the sole discretion of Oracle.
 Agenda SQL Tuning Challenges Oracle Database 11 g Solutions • • • Automatic SQL Tuning 1. Improvements to SQL Tuning Advisor 2. Fully automating SQL tuning Real-time SQL Monitoring 1. Track high response-time SQL 2. Find the most expensive plan operation Q&A
 SQL Tuning Challenges • Oracle Database 10 g introduced SQL advisors to simplify application and SQL tuning • Remaining challenges • SQL Tuning still reactive • Painful to find and investigate long-running SQL • Oracle Database 11 g solutions • Automatic SQL Tuning • Real-time SQL Monitoring
 Automatic SQL Tuning
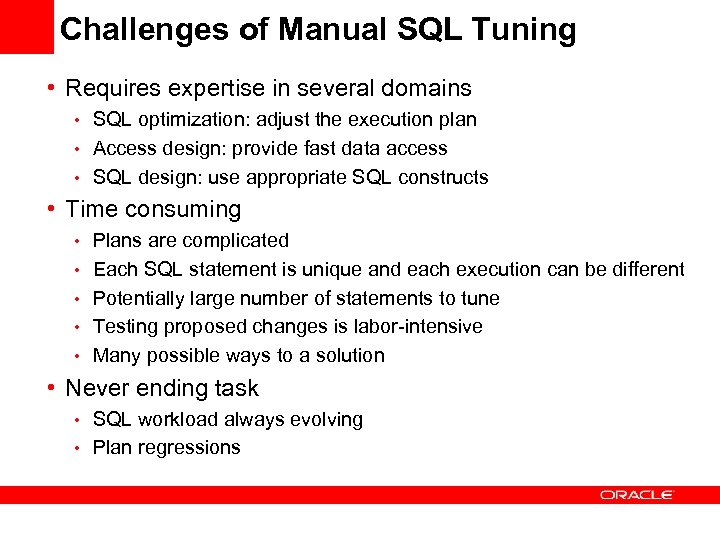 Challenges of Manual SQL Tuning • Requires expertise in several domains • SQL optimization: adjust the execution plan • Access design: provide fast data access • SQL design: use appropriate SQL constructs • Time consuming • Plans are complicated • Each SQL statement is unique and each execution can be different • Potentially large number of statements to tune • Testing proposed changes is labor-intensive • Many possible ways to a solution • Never ending task • SQL workload always evolving • Plan regressions
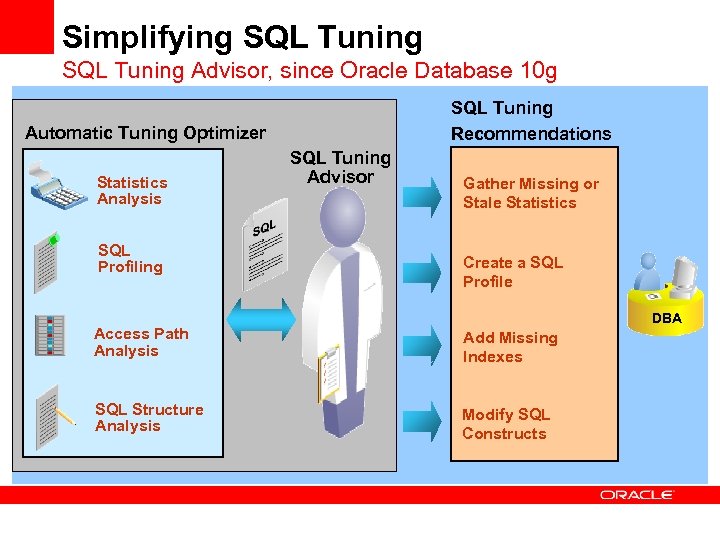 Simplifying SQL Tuning Advisor, since Oracle Database 10 g SQL Tuning Recommendations Automatic Tuning Optimizer Statistics Analysis SQL Profiling SQL Tuning Advisor Gather Missing or Stale Statistics Create a SQL Profile DBA Access Path Analysis Add Missing Indexes SQL Structure Analysis Modify SQL Constructs
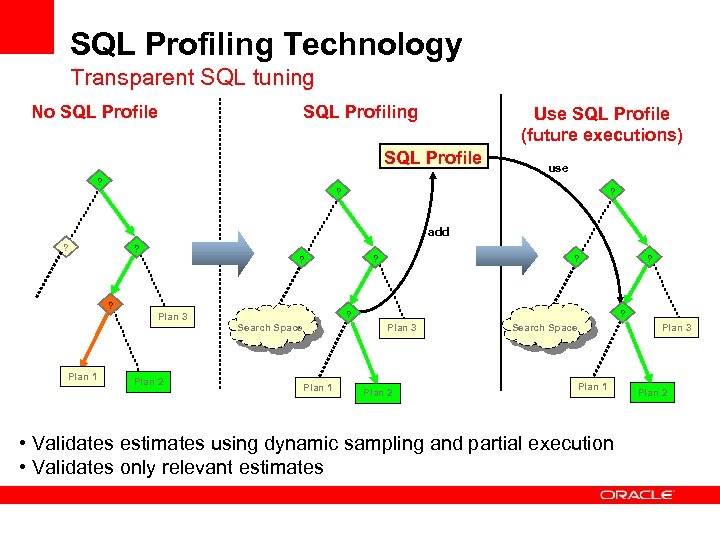 SQL Profiling Technology Transparent SQL tuning No SQL Profile SQL Profiling Use SQL Profile (future executions) SQL Profile ? use ? ? add ? ? ? Search Space Plan 1 Plan 2 ? ? Plan 3 Plan 1 ? ? Plan 2 Search Space Plan 3 Plan 1 • Validates estimates using dynamic sampling and partial execution • Validates only relevant estimates Plan 2
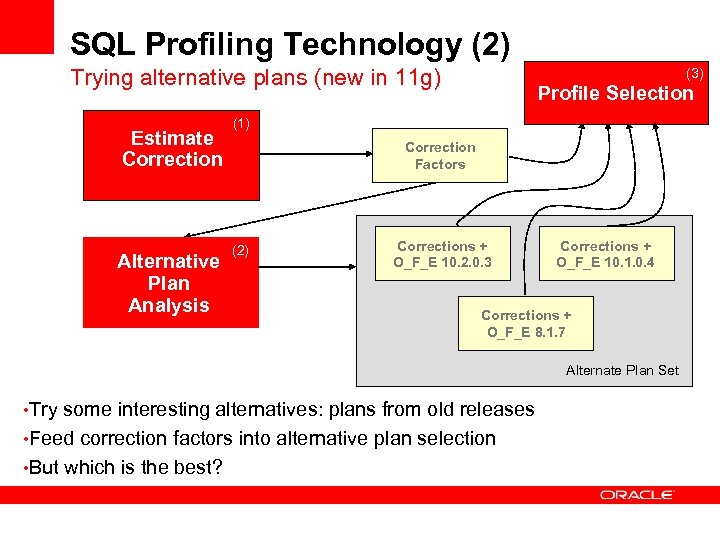 SQL Profiling Technology (2) Trying alternative plans (new in 11 g) Estimate Correction Alternative Plan Analysis (3) Profile Selection (1) Correction Factors (2) Corrections + O_F_E 10. 2. 0. 3 Corrections + O_F_E 10. 1. 0. 4 Corrections + O_F_E 8. 1. 7 Alternate Plan Set • Try some interesting alternatives: plans from old releases • Feed correction factors into alternative plan selection • But which is the best?
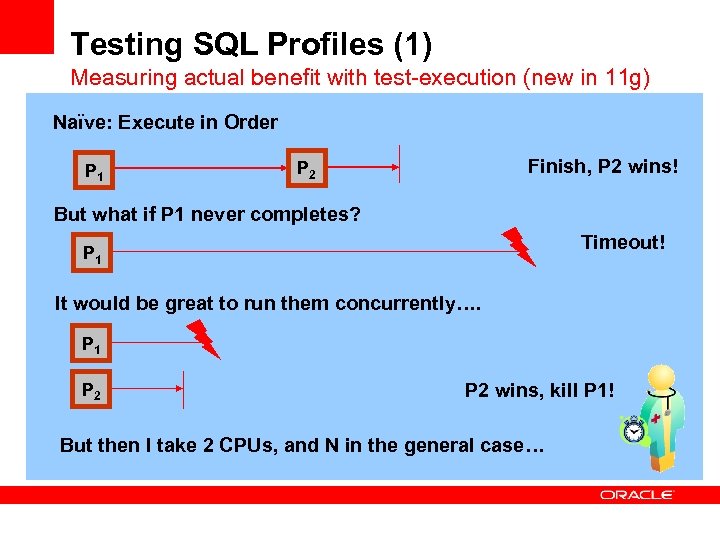 Testing SQL Profiles (1) Measuring actual benefit with test-execution (new in 11 g) Naïve: Execute in Order P 1 Finish, P 2 wins! P 2 But what if P 1 never completes? Timeout! P 1 It would be great to run them concurrently…. P 1 P 2 wins, kill P 1! But then I take 2 CPUs, and N in the general case…
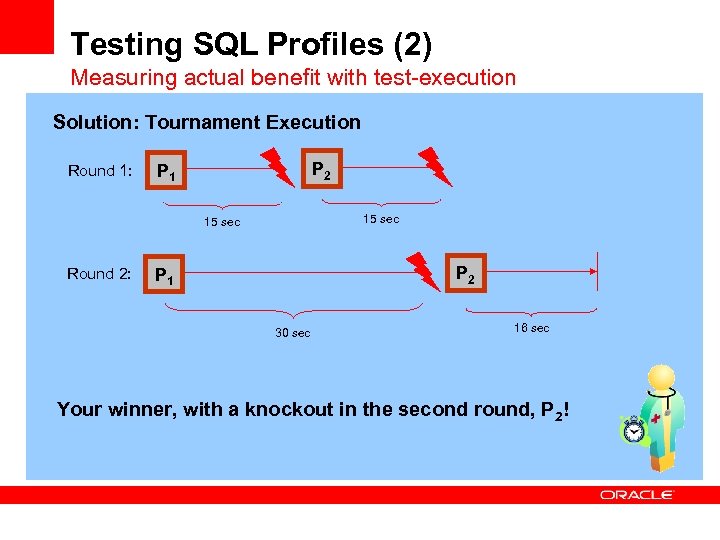 Testing SQL Profiles (2) Measuring actual benefit with test-execution Solution: Tournament Execution Round 1: P 2 P 1 15 sec Round 2: P 2 P 1 30 sec 16 sec Your winner, with a knockout in the second round, P 2!
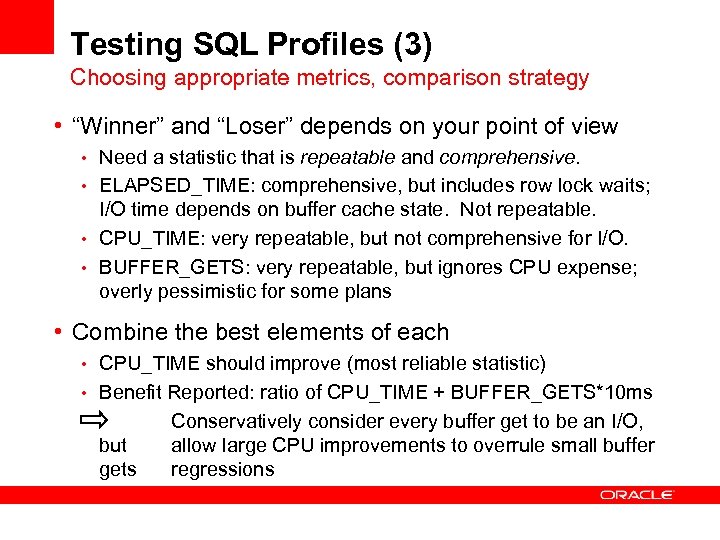 Testing SQL Profiles (3) Choosing appropriate metrics, comparison strategy • “Winner” and “Loser” depends on your point of view • Need a statistic that is repeatable and comprehensive. • ELAPSED_TIME: comprehensive, but includes row lock waits; I/O time depends on buffer cache state. Not repeatable. • CPU_TIME: very repeatable, but not comprehensive for I/O. • BUFFER_GETS: very repeatable, but ignores CPU expense; overly pessimistic for some plans • Combine the best elements of each • CPU_TIME should improve (most reliable statistic) • Benefit Reported: ratio of CPU_TIME + BUFFER_GETS*10 ms but gets Conservatively consider every buffer get to be an I/O, allow large CPU improvements to overrule small buffer regressions
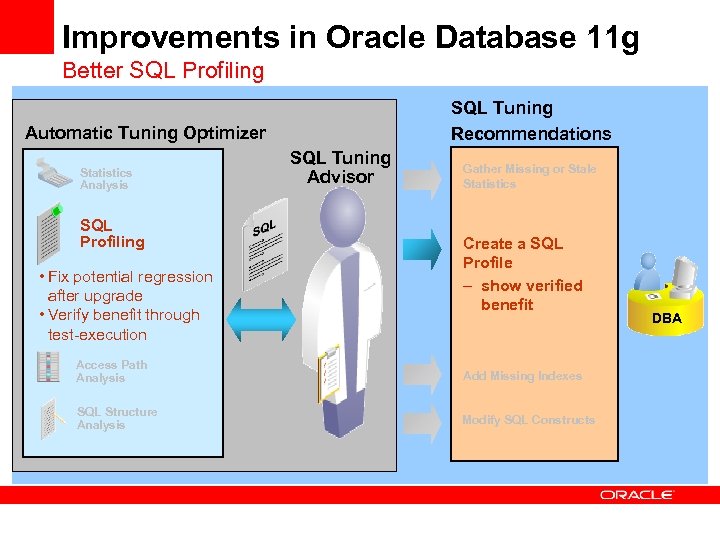 Improvements in Oracle Database 11 g Better SQL Profiling SQL Tuning Recommendations Automatic Tuning Optimizer Statistics Analysis SQL Profiling • Fix potential regression after upgrade • Verify benefit through test-execution SQL Tuning Advisor Gather Missing or Stale Statistics Create a SQL Profile – show verified benefit Access Path Analysis Add Missing Indexes SQL Structure Analysis Modify SQL Constructs DBA
 Agenda SQL Tuning Challenges Oracle Database 11 g Solutions • • • Automatic SQL Tuning 1. Improvements to SQL Tuning Advisor 2. Fully automating SQL tuning Real-time SQL Monitoring 1. Track high response-time SQL 2. Find the most expensive plan operation Q&A
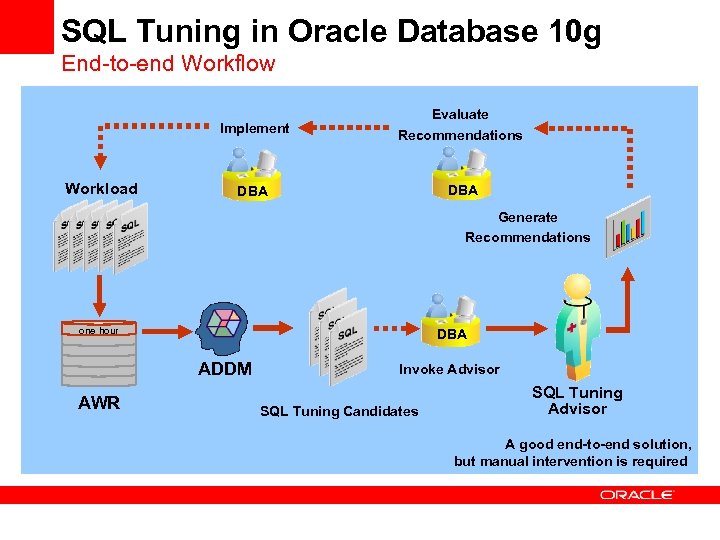 SQL Tuning in Oracle Database 10 g End-to-end Workflow Implement Workload Evaluate Recommendations DBA Generate Recommendations one hour DBA ADDM AWR Invoke Advisor SQL Tuning Candidates SQL Tuning Advisor A good end-to-end solution, but manual intervention is required
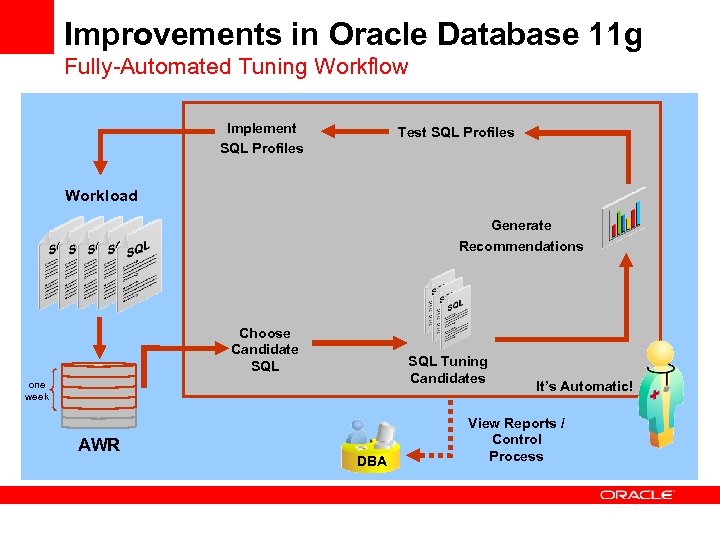 Improvements in Oracle Database 11 g Fully-Automated Tuning Workflow Implement SQL Profiles Test SQL Profiles Workload Generate Recommendations Choose Candidate SQL Tuning Candidates one week AWR DBA It’s Automatic! View Reports / Control Process
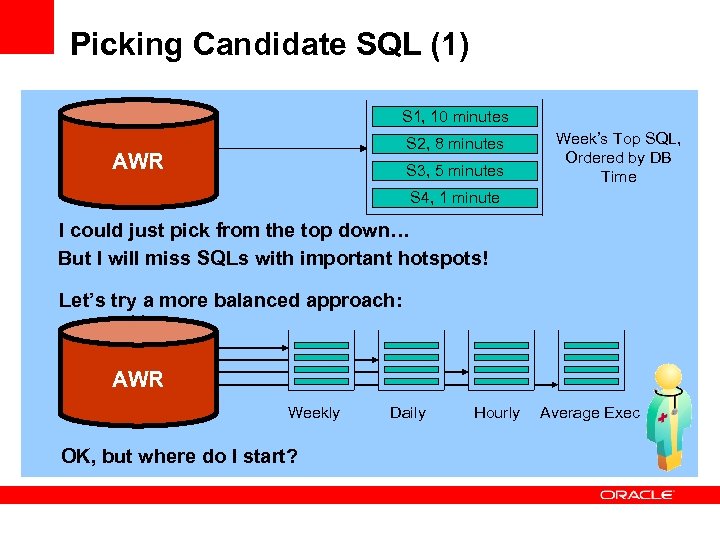 Picking Candidate SQL (1) S 1, 10 minutes S 2, 8 minutes AWR S 3, 5 minutes Week’s Top SQL, Ordered by DB Time S 4, 1 minute I could just pick from the top down… But I will miss SQLs with important hotspots! Let’s try a more balanced approach: AWR Weekly OK, but where do I start? Daily Hourly Average Exec
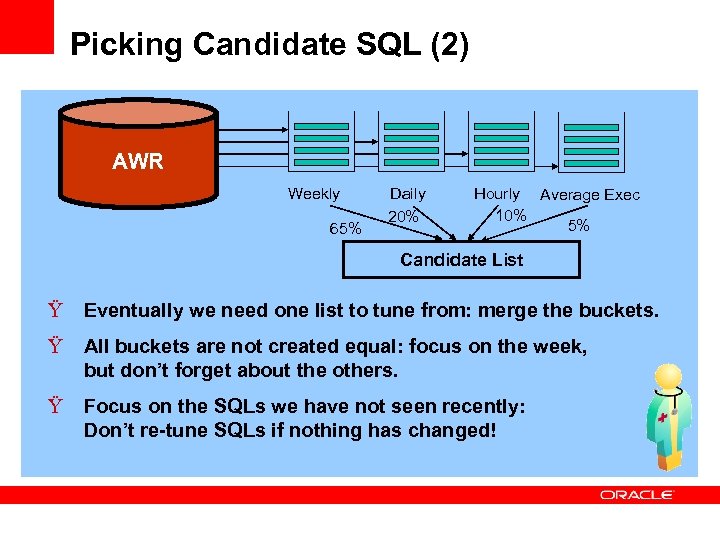 Picking Candidate SQL (2) AWR Weekly 65% Daily 20% Hourly Average Exec 10% 5% Candidate List Ÿ Eventually we need one list to tune from: merge the buckets. Ÿ All buckets are not created equal: focus on the week, but don’t forget about the others. Ÿ Focus on the SQLs we have not seen recently: Don’t re-tune SQLs if nothing has changed!
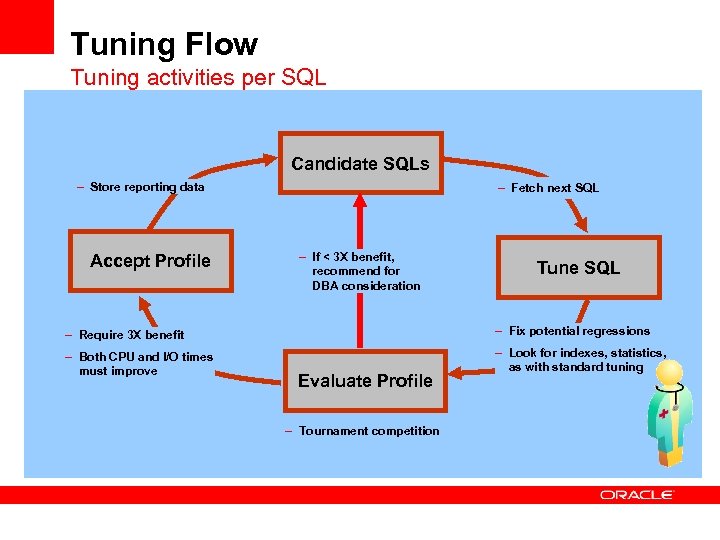 Tuning Flow Tuning activities per SQL Candidate SQLs – Store reporting data Accept Profile – Fetch next SQL – If < 3 X benefit, recommend for DBA consideration Tune SQL – Require 3 X benefit – Fix potential regressions – Both CPU and I/O times must improve – Look for indexes, statistics, as with standard tuning Evaluate Profile – Tournament competition
 Focus on SQL Profiles First step in automating SQL tuning Auto-testing/implementing is limited to profiles because: • No lengthy, expensive set-up process (building an index takes time) • Private to the current compilation • No change to user SQL (does not change semantics) • SQL-level recommendation, can be effectively tested • Easily reversed by the DBA Testing is done for regular SQL Tuning Advisor tasks as well!
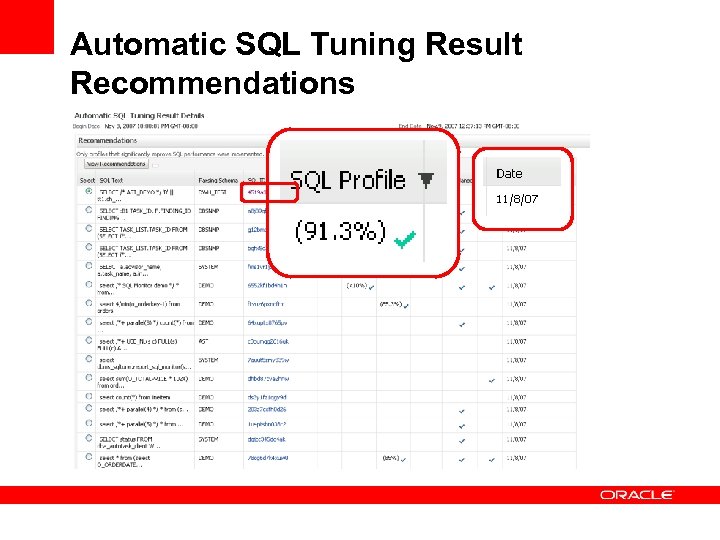
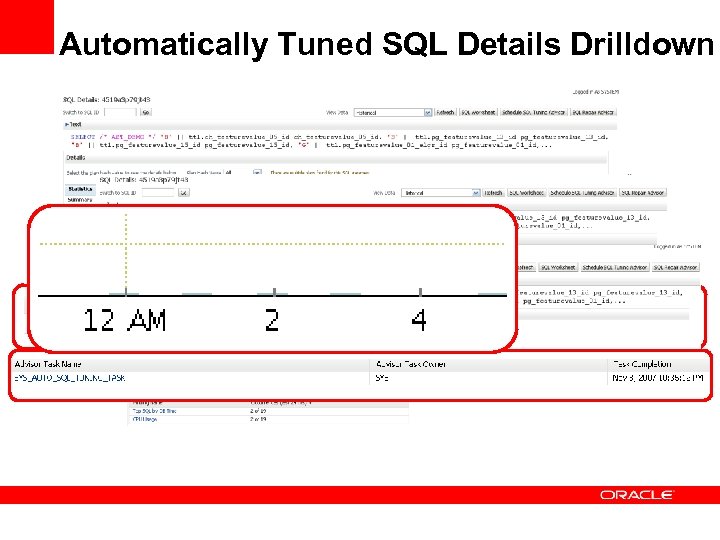
 Automatic SQL Tuning Defaults Sensible defaults with flexible configurations • Out-of-the-box defaults: • Runs in each maintenance window (MAINTENANCE_WINDOW_GROUP) • SQL profiles are tested but not implemented • DBA can configure using EM: • Whether / When / How long it runs • Resources it uses • Whether it implements profiles • How many profiles it implements
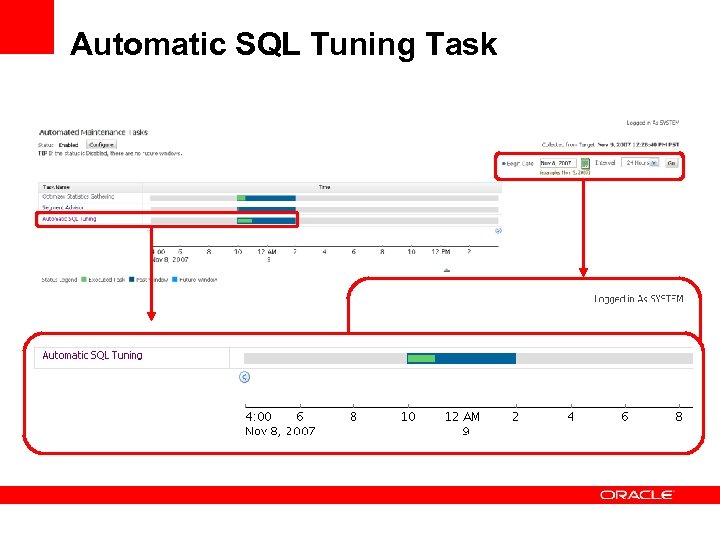 Automatic SQL Tuning Task
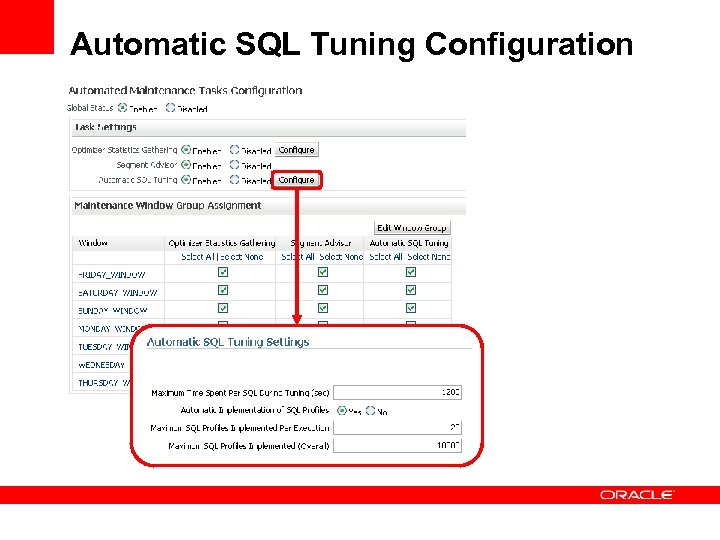 Automatic SQL Tuning Configuration
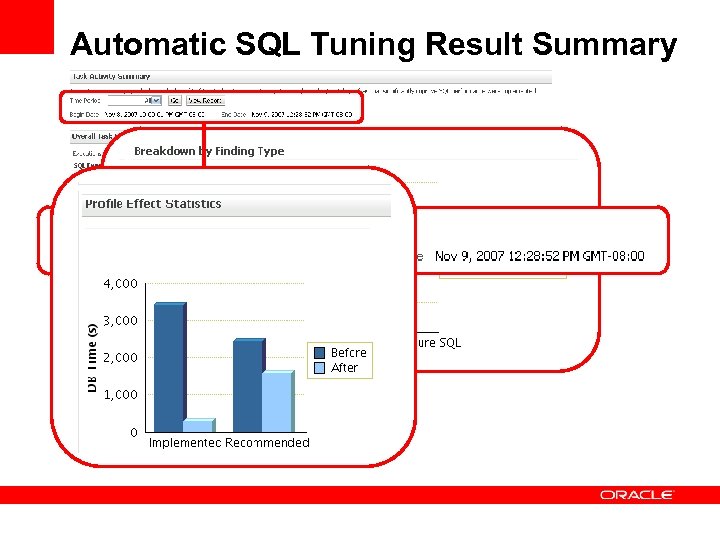 Automatic SQL Tuning Result Summary
 Automatic SQL Tuning Result Recommendations
 Automatically Tuned SQL Details Drilldown
 Conclusions • Manual SQL tuning is painful even for the experts • Oracle 10 g SQL Tuning Advisor quickly gives DBA good choices • Oracle 11 g Automatic SQL Tuning automates the process by making the easy decisions • DBA can control as much of the process as he wants
 Q & A
Q & A
 Real-Time SQL Monitoring
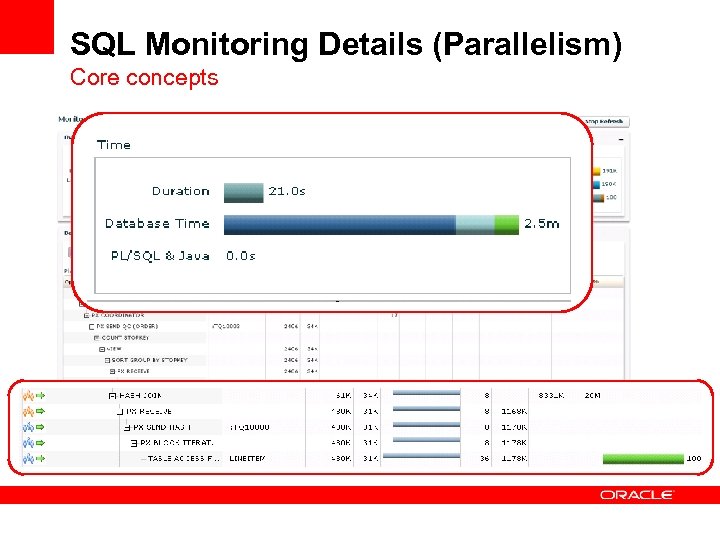
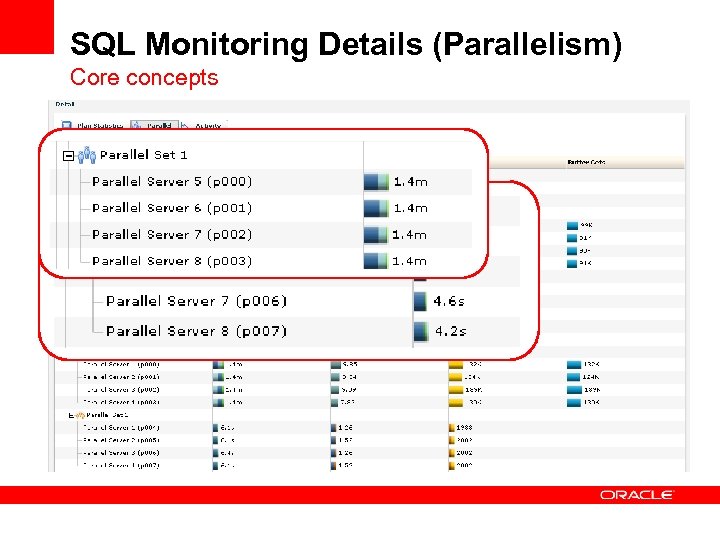
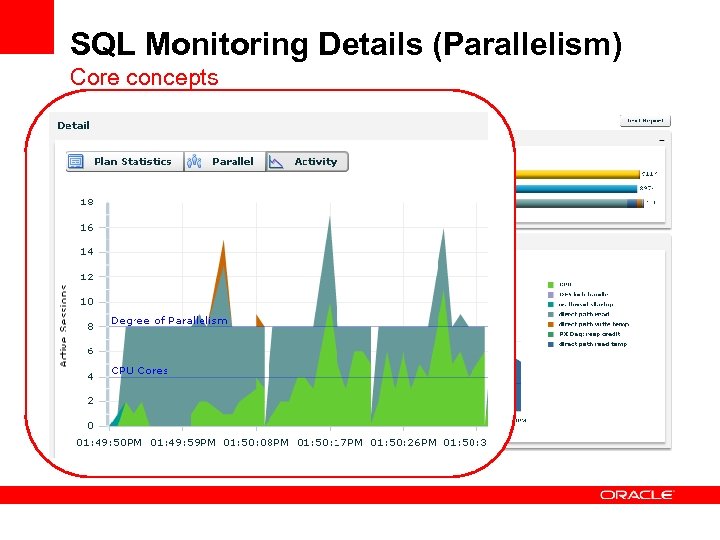
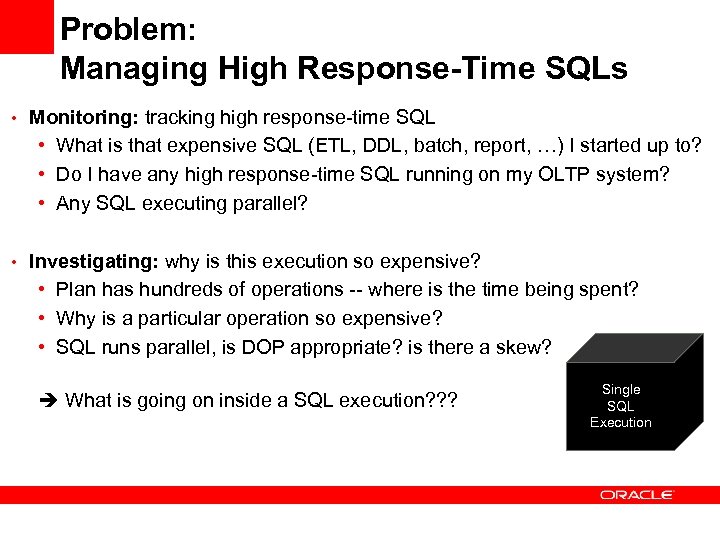 Problem: Managing High Response-Time SQLs • Monitoring: tracking high response-time SQL • What is that expensive SQL (ETL, DDL, batch, report, …) I started up to? • Do I have any high response-time SQL running on my OLTP system? • Any SQL executing parallel? • Investigating: why is this execution so expensive? • Plan has hundreds of operations -- where is the time being spent? • Why is a particular operation so expensive? • SQL runs parallel, is DOP appropriate? is there a skew? What is going on inside a SQL execution? ? ? Single SQL Execution
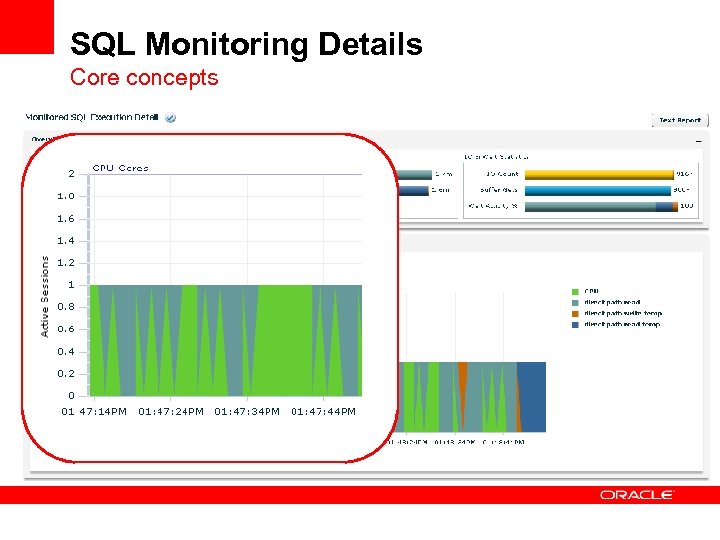
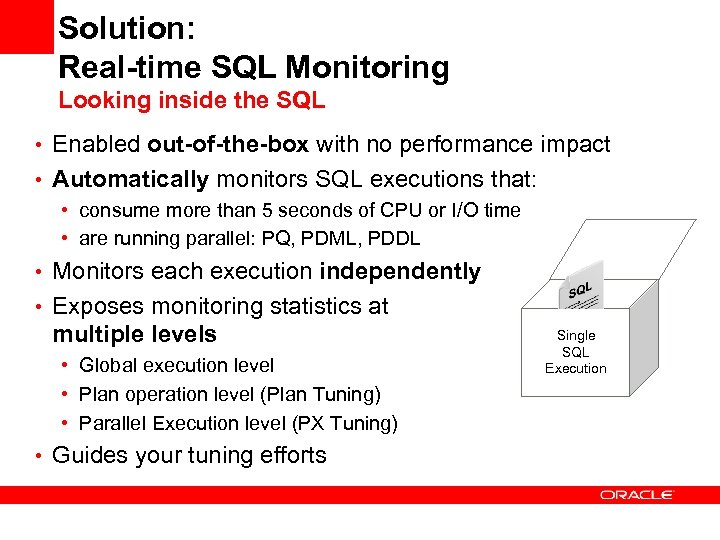 Solution: Real-time SQL Monitoring Looking inside the SQL • Enabled out-of-the-box with no performance impact • Automatically monitors SQL executions that: • consume more than 5 seconds of CPU or I/O time • are running parallel: PQ, PDML, PDDL • Monitors each execution independently • Exposes monitoring statistics at multiple levels • Global execution level • Plan operation level (Plan Tuning) • Parallel Execution level (PX Tuning) • Guides your tuning efforts Single SQL Execution
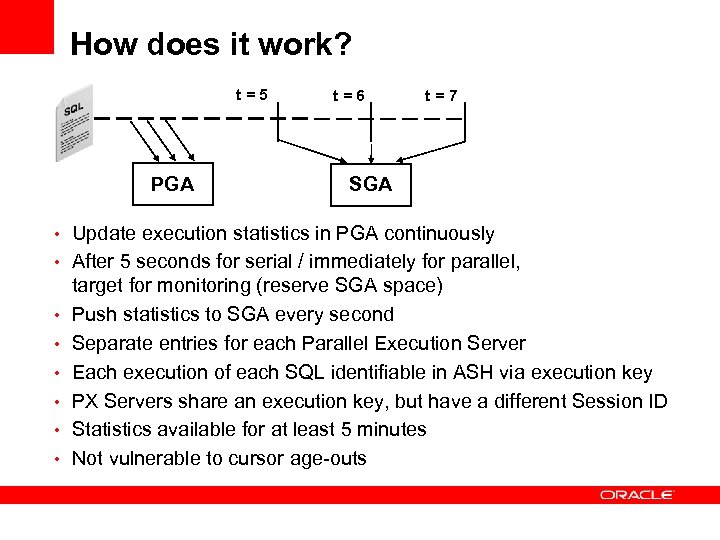 How does it work? t=5 PGA t=6 t=7 SGA • Update execution statistics in PGA continuously • After 5 seconds for serial / immediately for parallel, • • • target for monitoring (reserve SGA space) Push statistics to SGA every second Separate entries for each Parallel Execution Server Each execution of each SQL identifiable in ASH via execution key PX Servers share an execution key, but have a different Session ID Statistics available for at least 5 minutes Not vulnerable to cursor age-outs
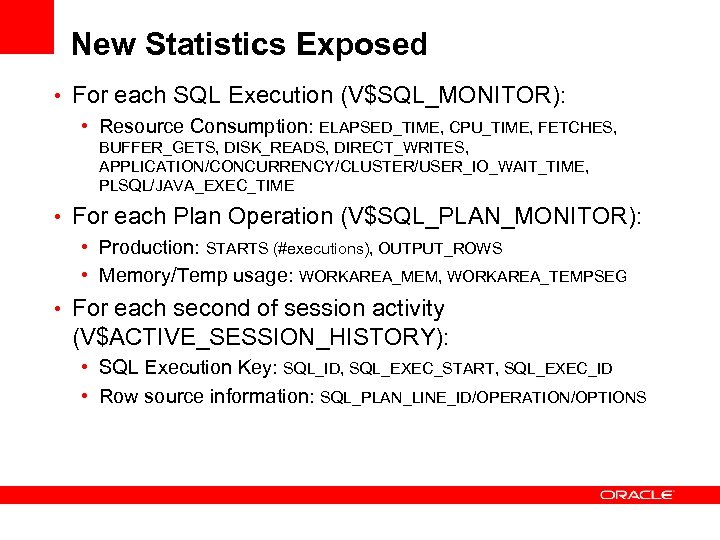 New Statistics Exposed • For each SQL Execution (V$SQL_MONITOR): • Resource Consumption: ELAPSED_TIME, CPU_TIME, FETCHES, BUFFER_GETS, DISK_READS, DIRECT_WRITES, APPLICATION/CONCURRENCY/CLUSTER/USER_IO_WAIT_TIME, PLSQL/JAVA_EXEC_TIME • For each Plan Operation (V$SQL_PLAN_MONITOR): • Production: STARTS (#executions), OUTPUT_ROWS • Memory/Temp usage: WORKAREA_MEM, WORKAREA_TEMPSEG • For each second of session activity (V$ACTIVE_SESSION_HISTORY): • SQL Execution Key: SQL_ID, SQL_EXEC_START, SQL_EXEC_ID • Row source information: SQL_PLAN_LINE_ID/OPERATION/OPTIONS
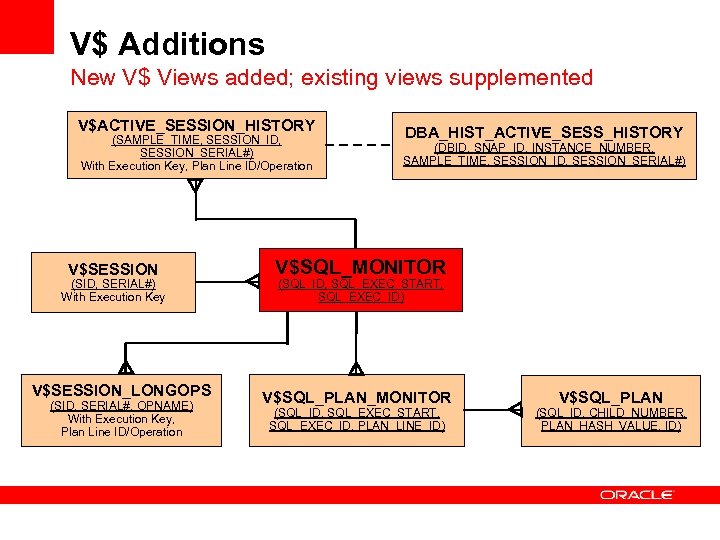 V$ Additions New V$ Views added; existing views supplemented V$ACTIVE_SESSION_HISTORY (SAMPLE_TIME, SESSION_ID, SESSION_SERIAL#) With Execution Key, Plan Line ID/Operation V$SESSION (SID, SERIAL#) With Execution Key V$SESSION_LONGOPS (SID, SERIAL#, OPNAME) With Execution Key, Plan Line ID/Operation DBA_HIST_ACTIVE_SESS_HISTORY (DBID, SNAP_ID, INSTANCE_NUMBER, SAMPLE_TIME, SESSION_ID, SESSION_SERIAL#) V$SQL_MONITOR (SQL_ID, SQL_EXEC_START, SQL_EXEC_ID) V$SQL_PLAN_MONITOR (SQL_ID, SQL_EXEC_START, SQL_EXEC_ID, PLAN_LINE_ID) V$SQL_PLAN (SQL_ID, CHILD_NUMBER, PLAN_HASH_VALUE, ID)
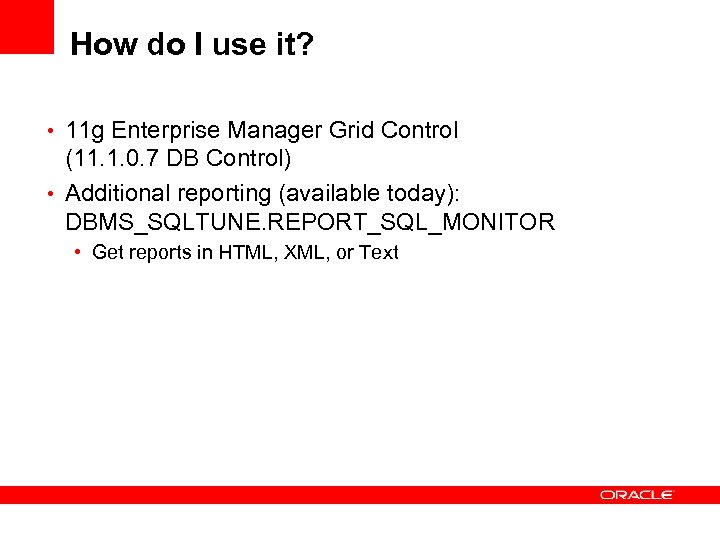 How do I use it? • 11 g Enterprise Manager Grid Control (11. 1. 0. 7 DB Control) • Additional reporting (available today): DBMS_SQLTUNE. REPORT_SQL_MONITOR • Get reports in HTML, XML, or Text
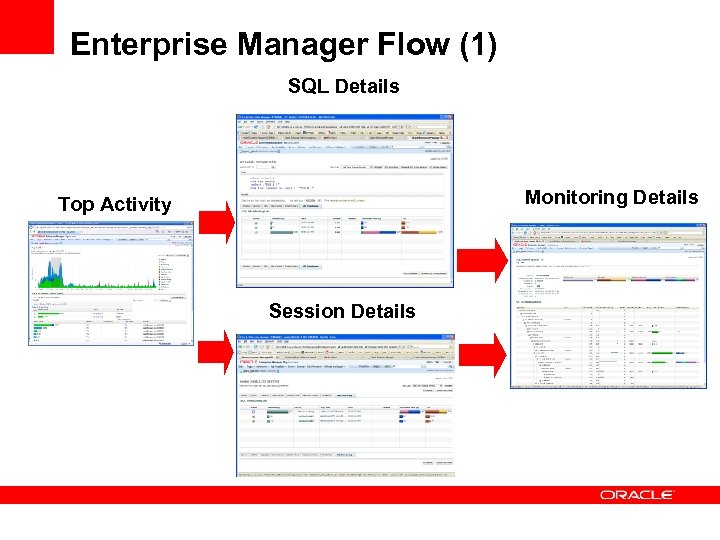 Enterprise Manager Flow (1) SQL Details Monitoring Details Top Activity Session Details
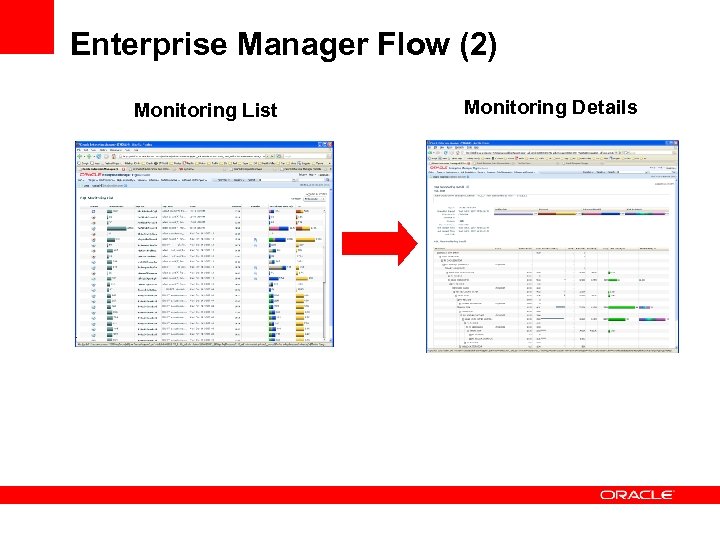 Enterprise Manager Flow (2) Monitoring List Monitoring Details
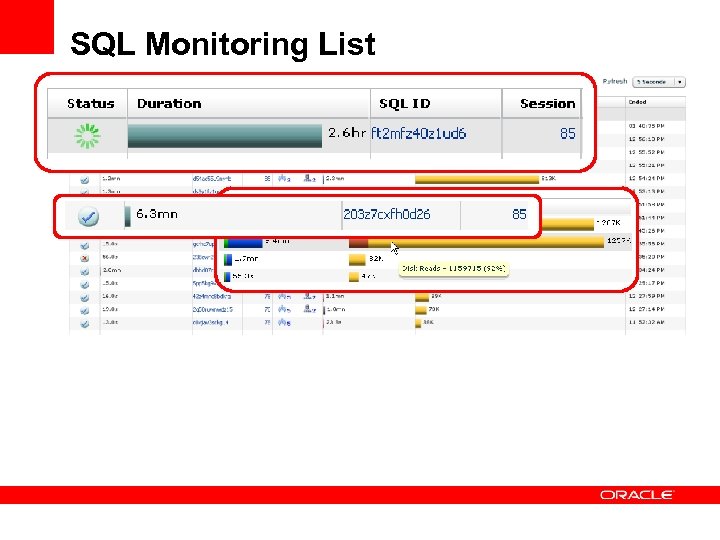 SQL Monitoring List
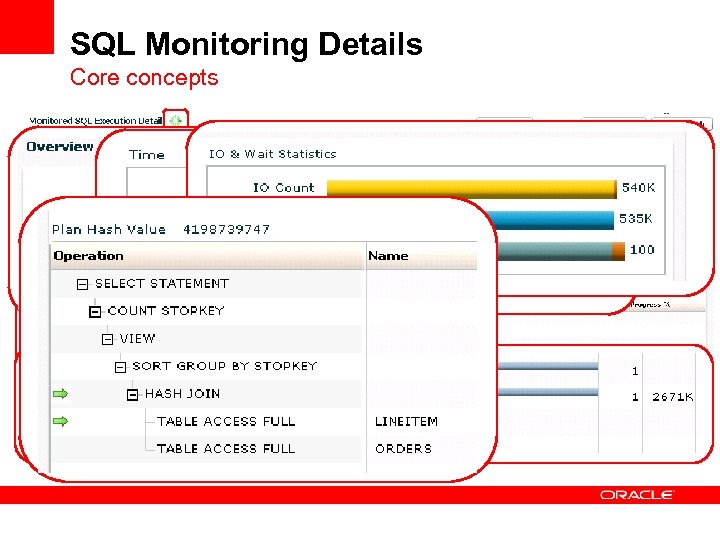 SQL Monitoring Details Core concepts
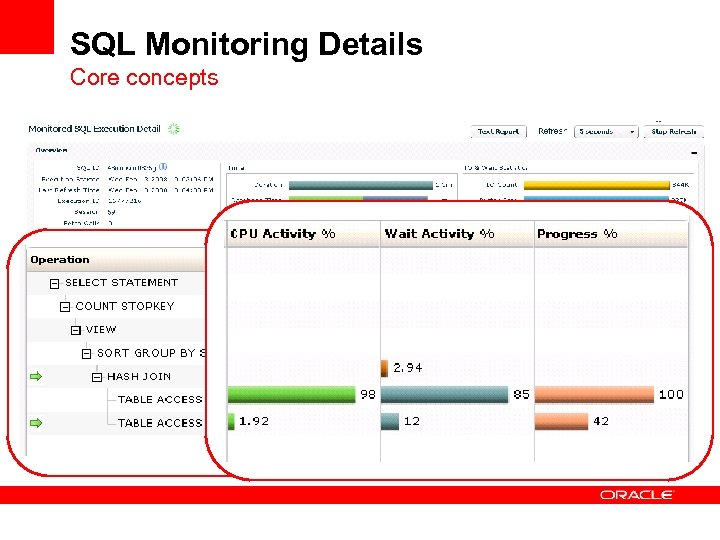 SQL Monitoring Details Core concepts
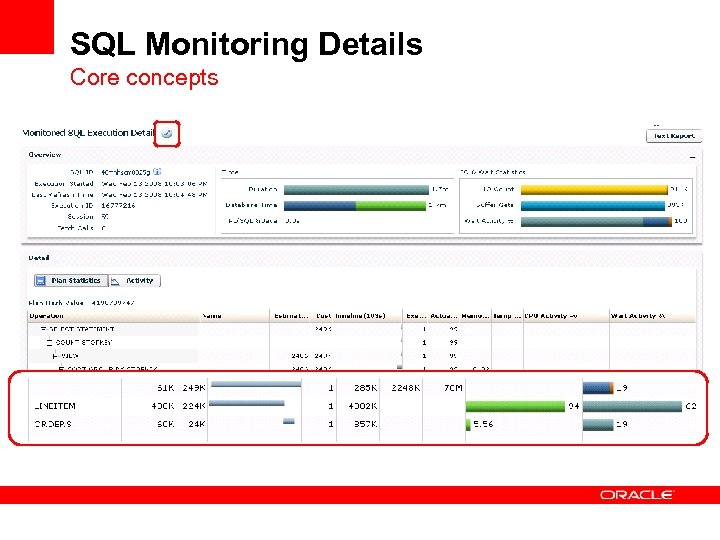 SQL Monitoring Details Core concepts
 SQL Monitoring Details Core concepts
 SQL Monitoring Details (Parallelism) Core concepts
 SQL Monitoring Details (Parallelism) Core concepts
 SQL Monitoring Details (Parallelism) Core concepts
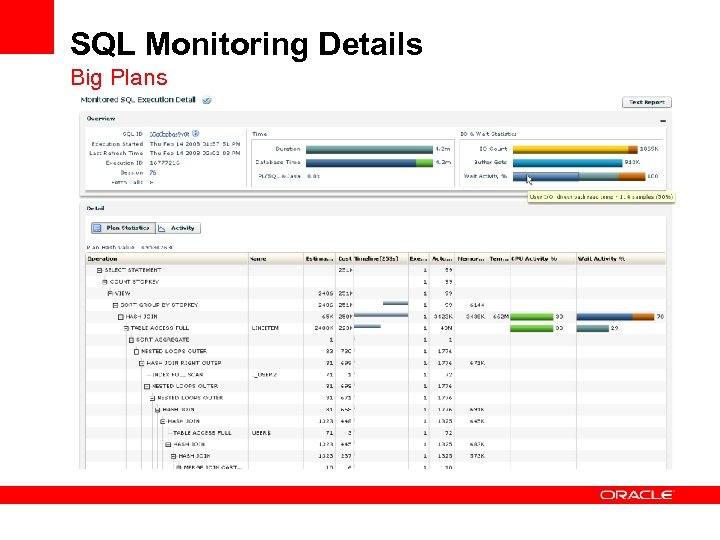 SQL Monitoring Details Big Plans
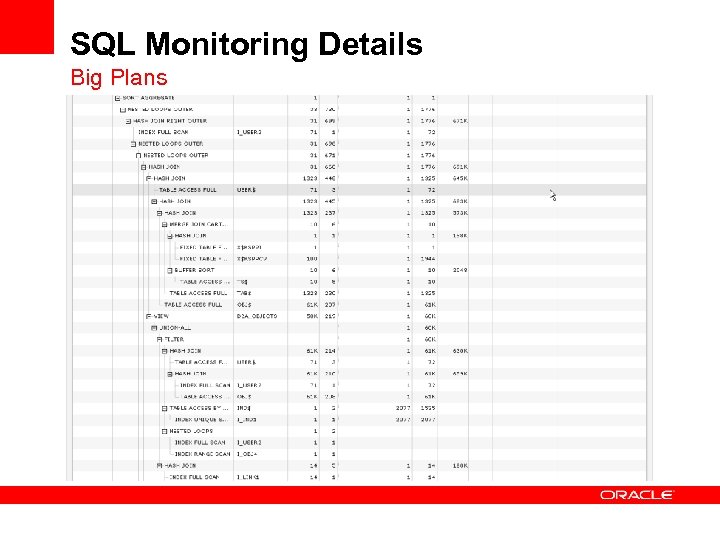 SQL Monitoring Details Big Plans
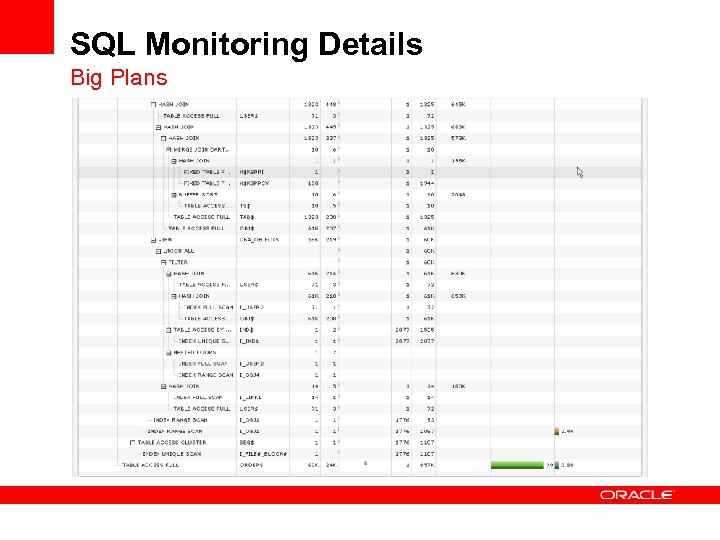 SQL Monitoring Details Big Plans
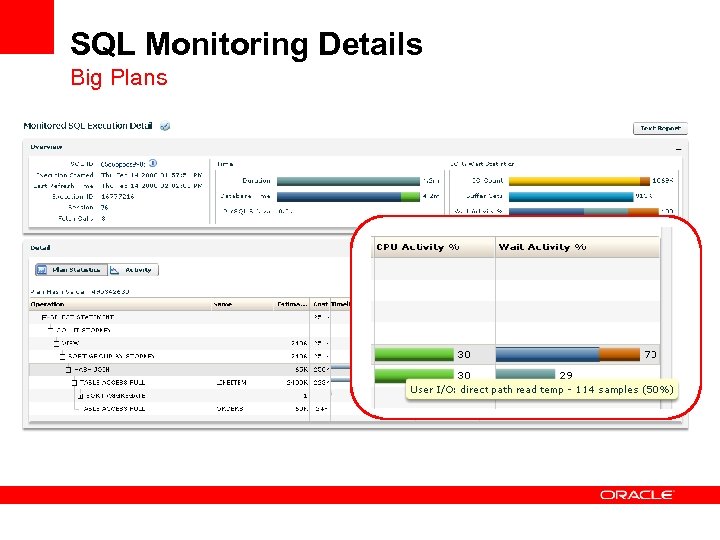 SQL Monitoring Details Big Plans
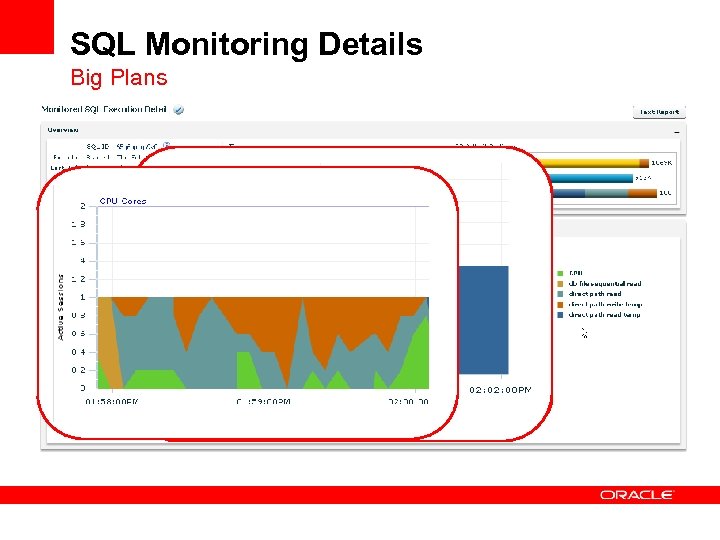 SQL Monitoring Details Big Plans
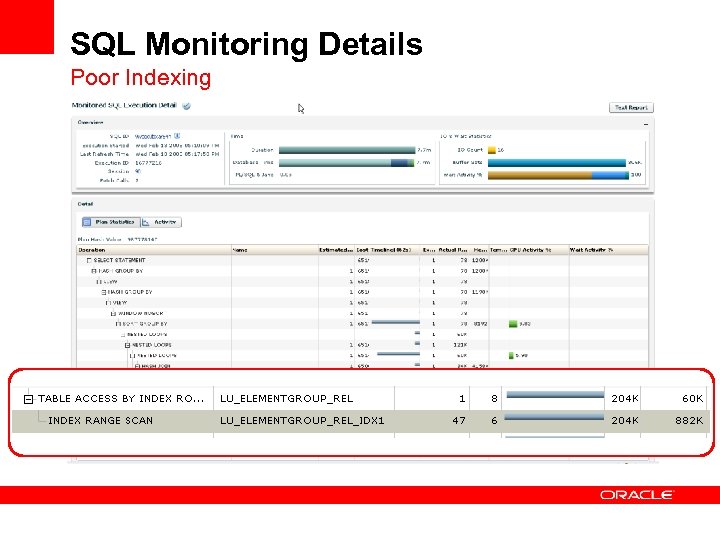 SQL Monitoring Details Poor Indexing
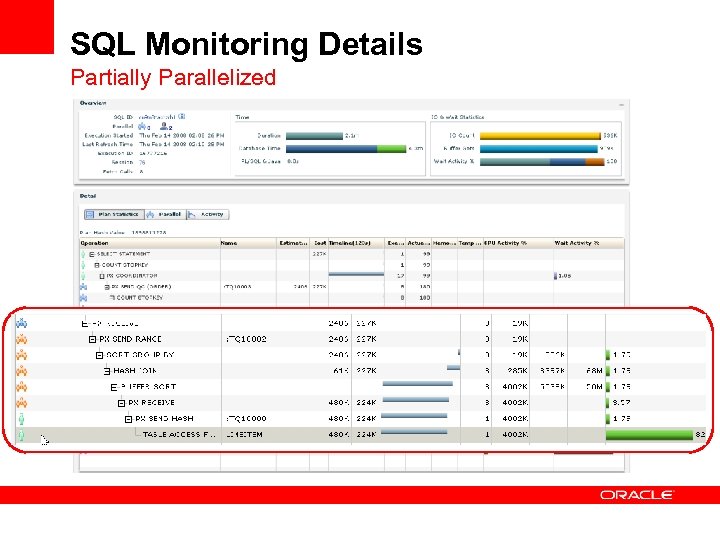 SQL Monitoring Details Partially Parallelized
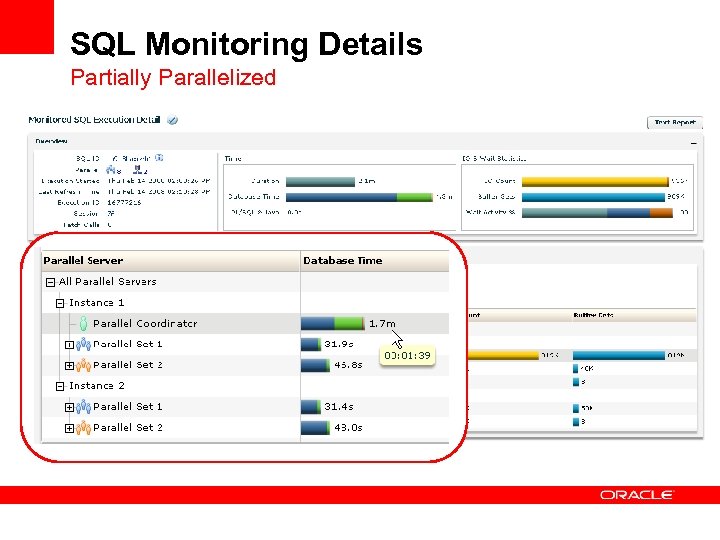 SQL Monitoring Details Partially Parallelized
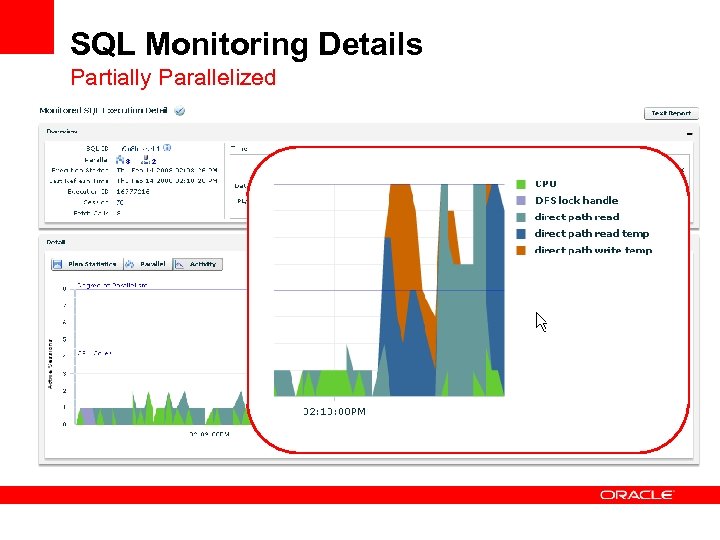 SQL Monitoring Details Partially Parallelized
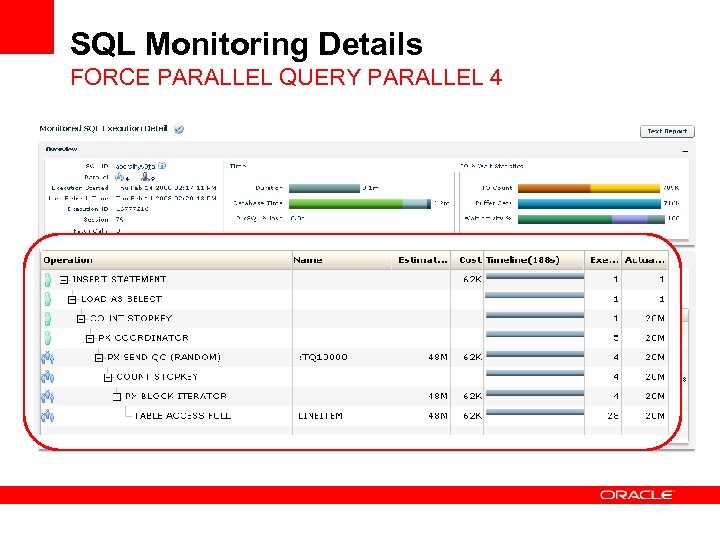 SQL Monitoring Details FORCE PARALLEL QUERY PARALLEL 4
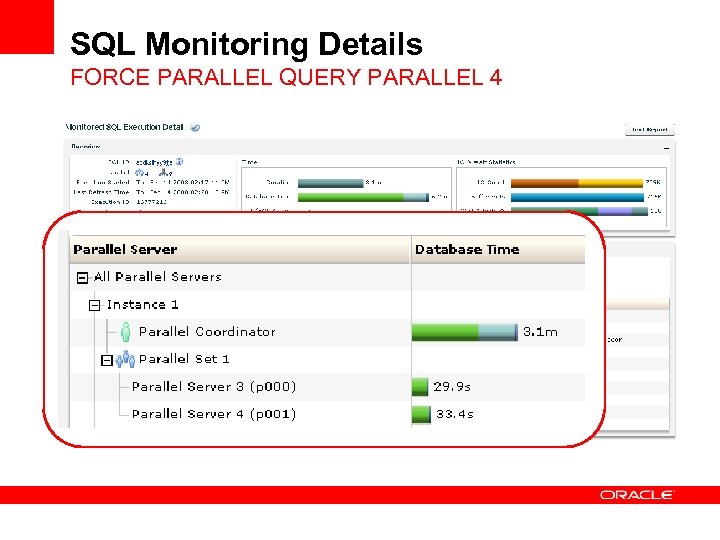 SQL Monitoring Details FORCE PARALLEL QUERY PARALLEL 4
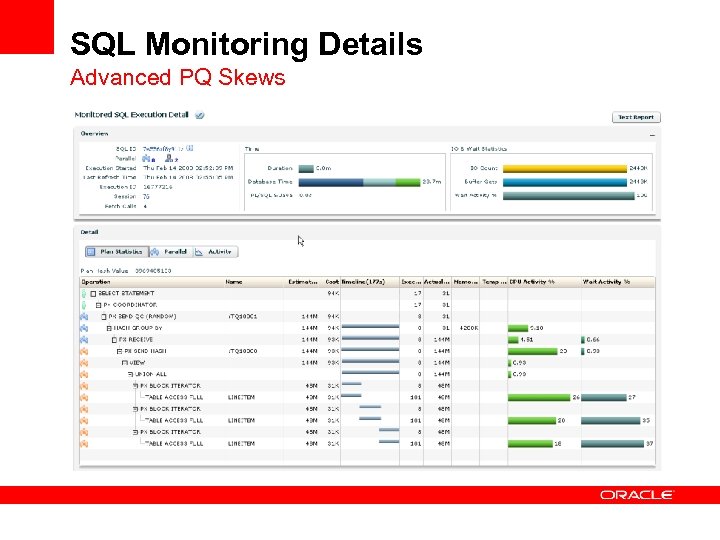 SQL Monitoring Details Advanced PQ Skews
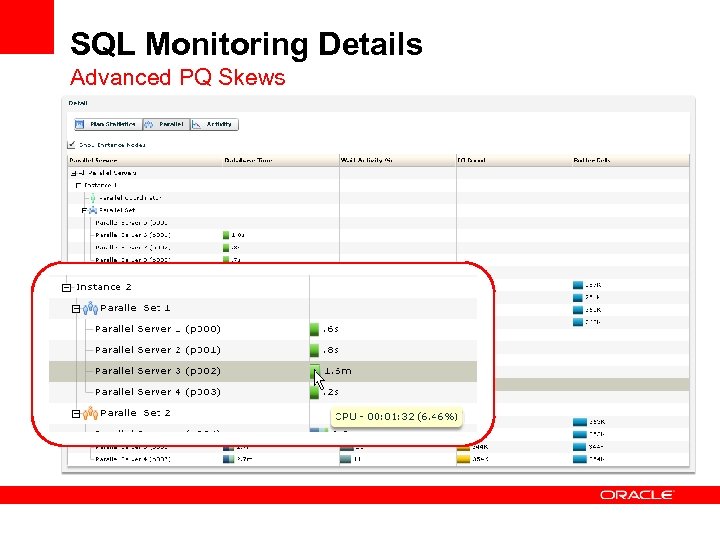 SQL Monitoring Details Advanced PQ Skews
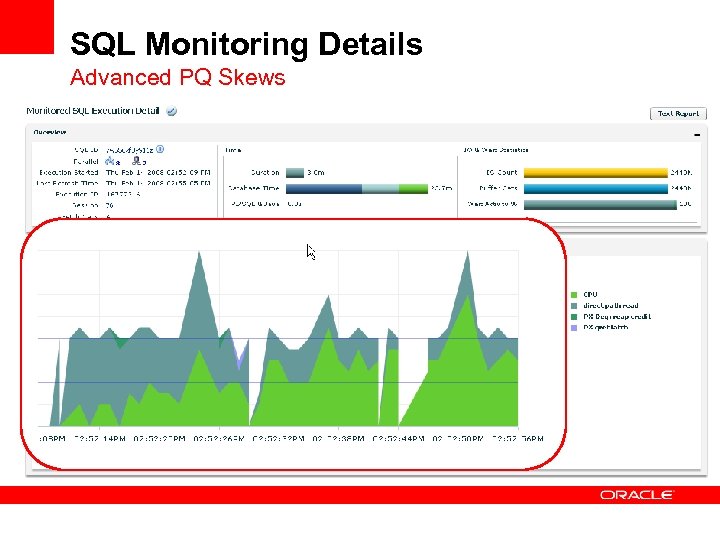 SQL Monitoring Details Advanced PQ Skews
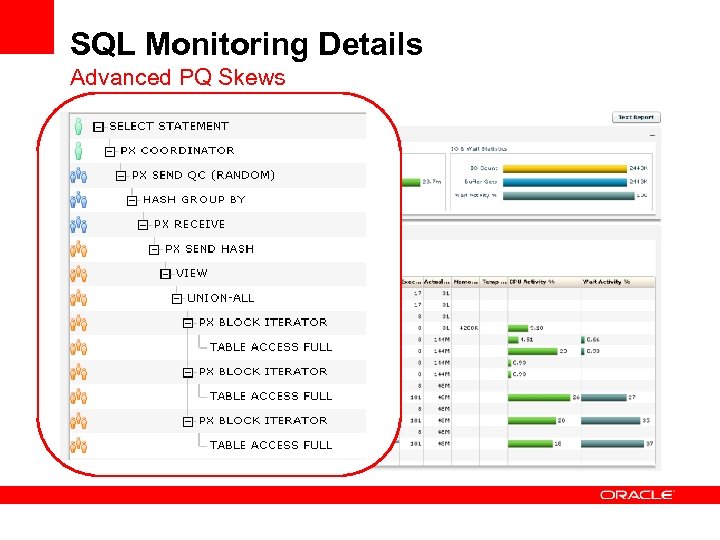 SQL Monitoring Details Advanced PQ Skews
 Conclusion • Real-Time SQL Monitoring is • Monitoring and tuning for high response-time SQLs • New, fine-grained SQL statistics • tracked automatically • updated while the SQL runs • highly visible and accessible • at no cost to your production system • The only way to know what’s happening inside single SQL execution • The quickest way to the root cause of a performance problem: If you can find the problem, you can fix it!
 Q & A
Q & A


