74c659364be6ab618534a6651e523ae1.ppt
- Количество слайдов: 44


INFO MEMO PT ARWANA CITRAMULIA Tbk 2016

To be the Best The Top Ceramic Tile Manufacturer in 2016

To be the Best Total Capacity 2013 : 49, 370, 000 sqm/year +8, 000 sqm/year - Plant 4 A 2016 : 57, 370, 000 sqm/year +8, 000 sqm/year - Plant 5 A 2018 : 63, 870, 000 sqm/year +6, 000 sqm/year - Plant 5 B 2019 : 69, 370, 000 sqm/year +6, 000 sqm/year - Plant 4 B 2020 : 75, 370, 000 sqm/year +6, 000 sqm/year - Plant 5 C

To be the Best ISO 14001: 2004 ISO 9001: 2000 Environmental Management System Quality Management System Ceramic tiles Definitions, classification, characteristics and marking Plant III Plant I : November 21, 2002 Plant II : April 26, 2007 Plant III : September 19, 2007 Plant III Plant IV Plant V : June 22, 2012 : September 21, 2011 : January 16, 2013 ISO 13006: 2010 : May 07, 2013 : Januari 29, 2014 : April 22, 2015 : March 28, 2016

To be the Best Green Industry Award 2013 2014 2015 2012 2011

To be the Best Trifecta Award For Winning Three years in a Row November 26, 2015 Certificate of Appreciation Award From Indonesian Directorate of Taxes April 23, 2015 Asia’s Best Companies 2015 Best Managed Company & Most Committed to Paying Good Dividends 2014, 2015 Green Industry Award 2011, 2012, 2013, 2014, 2015 Best of the Best Award The Top 50 Companies 2013, 2014, 2015 Capital Market Award 2014 Best Stock Issuer With Market Capitalization Up To IDR 10 Trillion May 13, 2014 Indonesia World-Record Rekor Bisnis (Re. Bi) Ceramic Industry with the Most Factory Location in Indonesia 2010, 2011, 2013, 2014 Forbes Asia Best Under a Billion Dollar December 9, 2014 First Ceramic Industry That Received Green Industry Certificate from the Ministry of Industry & Ceramic Industry with the Most Factory Location of Republic of Indonesia October 29, 2013

Arwana Vision To be the best company in the ceramic tiles industry, full of creativity and innovation, and able to contribute to the development of the country and the society

Creativity 5 Different Locations 2013 Plant IV, Ogan Ilir Plant V, Mojokerto 2015 Plant I, Tangerang 1995 I N D O N E S I A 2000 1997 Plant III, Gresik Plant II, Serang

Creativity Arwana’s Distributors & Outlets 2011 -2015 Sumatera 2011= 10 & 2, 684 2012= 10 & 3, 082 2013= 10 & 3, 410 2014= 11 & 3, 974 2015= 11 & 4, 201 Sulawesi Kalimantan 2011= 4 & 736 2012= 5 & 866 2013= 5 & 959 2014= 5 & 1, 073 2015= 5 & 1, 126 2011= 5 & 1, 425 2012= 5 & 1, 560 2013= 5 & 1, 756 2014= 5 & 2, 045 2015= 5 & 2, 203 Sorong I N D O N E S I A 2015= 1 & 1 Jawa & Bali 2011= 20 & 9, 195 2012= 20 & 10, 104 2013= 20 & 11, 299 2014= 21 & 13, 487 2015= 21 & 14, 275 NUMBER OF SUB DISTRIBUTORS & OUTLETS 2011 = 41 Sub Distributor & 14, 084 outlet (18%) 2012 = 42 Sub Distributor & 15, 668 outlet (11%) 2013 = 42 Sub Distributor & 17, 493 outlet (12%) 2014 = 44 Sub Distributor & 20, 648 outlet (18%) 2015 = 45 Sub Distributor & 21, 881 outlet (5, 9%) Ambon 2011= 1 & 29 2012= 1 & 35 2013= 1 & 40 2014= 1 & 40 2015= 1 & 45 Jayapura 2011= 1 & 15 2012= 1 & 21 2013= 1 & 29 2014= 1 & 29 2015= 1 & 30

Creativity Arwana’s Capacity Expansion 75, 370 69, 370 2019 63, 370 2018 2016 57, 370 Plant 5 C Plant 4 B Plant 5 A 49, 370 Plant 4 A 41, 370 40, 870 Plant 2 A Upgrade Plant 3 C Phase 2; Plant 2 C Extension 34, 280 Plant 3 C Phase 1 27, 400 Plant 2 C Phase 2 22, 400 Plant 2 B Phase 1 17, 370 12, 040 Plant 3 B Plant 2 Equipment Upgrade 10, 775 Plant 3 A 7, 490 Plant 2 A 2, 800 Plant 1 Installed Capacity (In Thousand m 2) Plant 2 Plant 3 Plant 4 Plant 5 2015 – 2020 : 1, 050 B 300 B 150 B 300 B
 Starting Capacity: 2, 880, 000 sqm /")
Plant I Tangerang, Banten (Operated June 1995) Starting Capacity: 2, 880, 000 sqm / year Current Capacity : 3, 780, 000 sqm / year ISO 9001 : 2000 Certified ISO 14001 : 2012 Certified 11
 Starting Capacity : 4, 500, 000 sqm")
Plant II Serang, Banten (Operated July 1997) Starting Capacity : 4, 500, 000 sqm / year Current Capacity : 19, 500, 000 sqm / year ISO 9001 : 2000 Certified ISO 14001 : 2011 Certified 12
 Starting Capacity : 3, 600,")
Plant III Wringin Anom-Gresik, East Java (Operated May 2002) Starting Capacity : 3, 600, 000 sqm / year Current Capacity : 18, 090, 000 sqm / year ISO 9001 : 2007 Certified ISO 14001 : 2013 Certified 13
 Current Capacity : 8, 000")
Plant IV Ogan Ilir, South Sumatera (Operated September 2013) Current Capacity : 8, 000 sqm / year SNI - ISO 13006 : 2010 Certified ISO 9001 : 2008 14
 Current Capacity : 8, 000 sqm")
Plant V Mojokerto, East Java (Operated January 2016) Current Capacity : 8, 000 sqm / year SNI - ISO 13006 : 2010 Certified 15

Plant V 16

Plant V 17

Arwana Vision To be the best company in the ceramic tiles industry, full of creativity and Innovation, and able to contribute to the development of the country and the society
")
Innovation Heat Recovery Multi Mill Continues (MMC)

Arwana Vision To be the best company in the ceramic tiles industry, full of creativity and innovation, and able to contribute to the development of the country and the society

Contribute Corporate Social Responsibility Worship Place Renovation Free Medical Care School Renovation Blood Donation School Supplies Donation Scholarship House Renovation Homecoming Program Orphanage Charity 21

Growth Strategy Environment Energy Product Technology Human Resources

Environment Plant II Plant V Plant III Plant IV
")
Energy Production Cost (Q 3)

Energy Cost Reduction Through Heat Recovery and Multi Layer HD Energy Cost Efficiency with Multi Mill Continues (MMC)
 11% 10. 5% 20. 3% 9. 7% 17. 2% 35. 9%")
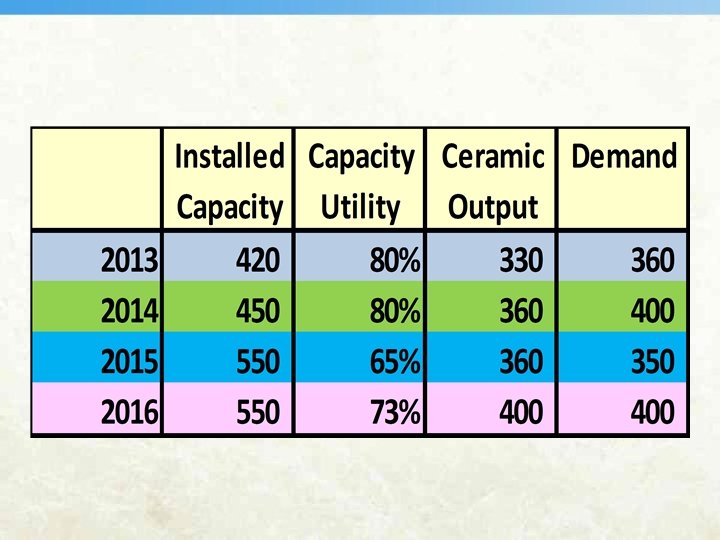
Product (Capacity Utilization) 11% 10. 5% 20. 3% 9. 7% 17. 2% 35. 9% 3. 3% 7. 12% 15. 1% 19. 3%

Technology Heat Recovery Horizontal Dryer Kiln SPR System

Technology Digital Printing

Human Resources 1. 2. 4. 3. 1. 2. 3. 4. 5. 6. Corporate Plant III Plant IV Plant V 5. In House Training 29

Human Resources Arwana Management Tandean Rustandy, M. BA. Edy Suyanto, S. E. Ir. Rudy Sujanto Hatta Syafrudin S. H, M. Si Chief Executive Officer 1993 - Current Chief Operating Officer 1996 - Current Chief Financial Officer 2009 - Current Independent Director 2015 - Current Ir. Lim Tjhiu Iong Renny A. Sandi, SE Rally Sudarta B. Com V. P. Operation 1994 - Current V. P. Marketing 2000 - Current V. P. HR & GA 2007 - Current Agustinus Kusnadi, SE V. P. Financial Controller 2007 - Current Li Sufan Sufendi , ST V. P. Procurement 2014 - Current 30

Human Resources Arwana Corporate Structure 31

FINANCIAL PERFORMANCE 32

Net Sales & Net Profit 2005 - 2016 13% 27% 20% 21% 20% 11% 16% 28% 10% 51% 8% 50% 20% 54% 26% 19% 23% 20% 10% 64% 73% 15% 33

34

35

36
 Gross Profit")
Profitability Ratios 2008 2009 2010 2011 2012 2013 2014 2015 2016(3 Q) Gross Profit Margin 31% 30% 32% 31% 34% 35% 32% 21% Net Profit Margin 8% 9% 9, 5% 10, 3% 14, 2% 17, 0% 16, 1% 5, 4% 5, 5% Return on Equity 19% 19% 20% 26% 31% 29% 8% 7% Return on Assets 7% 8% 9% 11% 17% 21% 5% 4% 11% 14% 17% 27% 33% 35% 8% 9% Return on Investment Solvability Ratios 76% 79% 97% 102% 136% 130% 168% 102% 124% 158% 138% 112% 72% 52% 48% 38% 60% 66% Gearing Ratio 71% 63% 48% 33% 11% 5% 2% 1% 11% Debt to Assets 61% 58% 52% 42% 34% 32% 28% 37% 40% Current Ratio Debt to Equity Ratio 37

38

Profitability Ratio - ROE 1000 35% 30. 6% 900 909. 9 894. 7 28. 5% 800 25. 9% 30% 768. 5 25% 700 600 18. 3% 19. 0% 604. 8 19. 6% 20% 483. 2 500 415. 1 400 15% 348. 3 300 235. 2 200 100 259. 5 10% 7. 8% 156. 5 63. 9 79. 0 0 2009 2010 5% 94. 7 Net 2011 Profit 69. 8 Equity 2012 ROE 2013 0% 2014 2015 39

Liquidity Ratio – Current ratio 180% 161% 160% 140% 124% 130% 120% 100% 117% 102% 95% 78% 80% 76% 79% 60% 102% 97% 66% 40% 33% 20% 0% 11% 2008 2009 2010 2011 2012 Current Ratio 11% 5% 2013 2% 2014 1% 2015 2016 (Q 3) Gearing Ratio 40

37, 490 28, 725

INDONESIAN CERAMIC DEMAND Total House needed per Year Unit Population Growth 1. 3% per year 839, 500 251, 850, 000 x 1. 3% 3. 9 House refurbishment 5% per year 3, 238, 580 House Back Log 1, 360, 000 64, 771, 600 x 5% 13, 600, 000 10 year 5, 438, 080 CERAMIC DEMAND = 435, 046, 400 M 2

THANK YOU
74c659364be6ab618534a6651e523ae1.ppt