1f9356b605f4c9a13c2222d285e6e396.ppt
- Количество слайдов: 39
 Influence of socioeconomic disparities on the nutritional status of Mongolian children under 5 years of age Ganzorig Dorjdagva, Ph. D. HRO Meeting May 28, 2014 1
 growth reference is being") New WHO Standards • National Center for Health Statistics (NCHS) growth reference is being used for assessment of nutritional status of children since 1978. • NCHS reference has several limitations and multi ethnical reference was required. • In 2006 WHO released new standards for assessing the growth and development of children from birth to 5 years of age. • WHO recommends the use of the WHO standards to assess the growth and development of children worldwide.
New WHO Standards • National Center for Health Statistics (NCHS) growth reference is being used for assessment of nutritional status of children since 1978. • NCHS reference has several limitations and multi ethnical reference was required. • In 2006 WHO released new standards for assessing the growth and development of children from birth to 5 years of age. • WHO recommends the use of the WHO standards to assess the growth and development of children worldwide.
 Global Child Nutrition Status • Undernutrition is progressively declining in Asia since 1990. Stunting was reduced from 40% to 29%; underweight was from 31% to 26%; and wasting was from 21% to 13%. (UNICEF, 2008) • Underlying causes of malnutrition have been suggested: o Poverty o Lack of access to foods o Conflicts o Climate change o Lack of safe drinking water o Diseases
 Child Stunting Prevalence in the World Mongolia
 Problems Related to Nutrition Status of Children in Mongolia • Problems include poverty, unemployment, migration, lack of food safety and security. • Although underweight and wasting are reduced drastically, stunting is still in a high level. • Exclusive breastfeeding up to 6 months is practiced by majority of women. • The provision of complementary foods is not adhered to the WHO recommendation.
 by NCHS ref 30 % 26. 4 25 24.") Stunting in Mongolia (1992 -2005) by NCHS ref 30 % 26. 4 25 24. 6 25 Total Stunting Severe Stunting 21. 0 19. 6 20 15 10 5 8. 7 8. 5 4. 9 5. 9 0 National Nutrition Multi-Indicator Survey 1, 1992 Survey 2, 1999 Cluster Survey 2, Survey 3, 2004 Cluster Survey 3, 2000 2005 6
Stunting in Mongolia (1992 -2005) by NCHS ref 30 % 26. 4 25 24. 6 25 Total Stunting Severe Stunting 21. 0 19. 6 20 15 10 5 8. 7 8. 5 4. 9 5. 9 0 National Nutrition Multi-Indicator Survey 1, 1992 Survey 2, 1999 Cluster Survey 2, Survey 3, 2004 Cluster Survey 3, 2000 2005 6
 QUESTIONS NEED TO BE ANSWERED • Who are vulnerable to child undernutrition in Mongolia? • What types of socioeconomic factors are related to child undernutrition in Mongolia? • Are there any changes in national nutrition status after the adoption of the WHO growth standards?
 STUDY Influence of Socioeconomic Disparities on the Nutritional Status of Mongolian Children under 5 Years of Age M
 OBJECTIVES 1. To examine the disparities in nutrition by demographic and socioeconomic factors. 2. To evaluate changes of nutritional status in children under 5 years of age between 2000 and 2005.
 METHODS Datasets Survey name, year Regions Total Households House Clusters per Cluster holds Total children under 5 years old Multi-Indicators Clusters Survey 2, 2000 6 300 25 6000 6199 Multi-Indicators Clusters Survey 3, 2005 5 253 25 6325 3568 Multi-Indicators Clusters Survey 3, 2010 5 420 25 10092 3956 Datasets are available in UNICEF web site: www. childinfo. org R
 Nutrition Indicators and Definition Indicator Measure Cut-off Stunting Underweight Wasting Overweight Height-for-age Weight-for-height Body mass for index-for-age < - 2 SD > 2 SD
 Demographic and Socioeconomic Variables Variable Level Child age <2 years old, ≥ 2 years old Gender Male, Female* Areas of residence Rural areas, Urban areas* Mother’s education Less education (≤ 8 years of formal education) High education* (> 8 years of formal education) Wealth index * Reference level Quintiles (Poorest, Second, Middle, Fourth, Richest*)
 Statistical Analysis Calculation of z-scores using WHO growth standard. Calculation of undernutrition prevalences by sociodemographic factors. Chi-square test was used to compare the prevalence of undernutrition between 2000 and 2005. Odds ratios of undernutrition by demographic and socioeconomic factors were estimated with 95% confidence Interval.
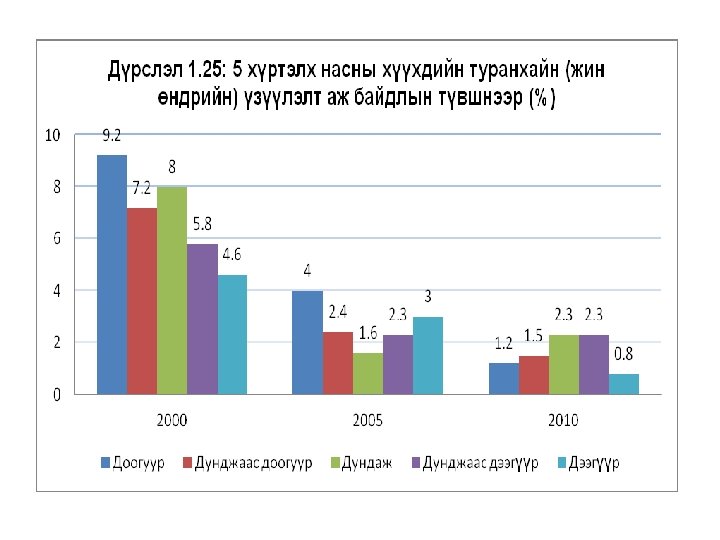
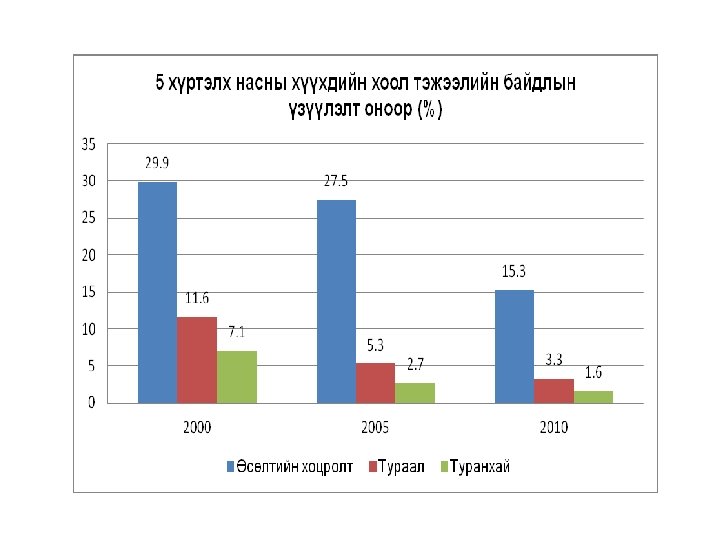
 RESULTS Malnutrition Prevalence in 2000, 2005 and 2010 Indicator Underweight Severe underweight Wasting Severe wasting Overweight Obese Stunting Severe stunting MICS 2, 2000 11. 6% 3. 9% 7. 1% 3. 0% 14. 7% 4. 6% 29. 9% 12. 0% MICS 3, 2005 5. 3% 1. 6% 2. 7% 1. 1% 17. 1% 4. 9% 27. 5% 9. 9% MICS 3, 2010 3. 3 0. 9 1. 6 0. 7 10. 9 ? 15. 3 4. 7 P value <0. 001 <0. 05 0. 65 0. 07 <0. 05
 Unadjusted odds ratios and 95% confidential intervals of stunting, underweight and wasting for selected sociodemographic factors in children under 5 years of age in 2000 and 2005 MICS 2, 2000 MICS 3, 2005 Stunting Underweight Wasting Male / Female 1. 17 (1. 05 - 1. 31) 1. 22 (1. 04 - 1. 43) 1. 07 (0. 88 - 1. 31) 1. 19 (1. 03 - 1. 40) 1. 00 (0. 74 - 1. 35) 0. 94 (0. 62 - 1. 43) Rural / Urban 1. 89 (1. 68 - 2. 12) 1. 77 (1. 50 - 2. 10) 1. 48 (1. 21 - 1. 83) 1. 28 (1. 10 - 1. 49) 1. 26 (0. 93 - 1. 72) 1. 06 (0. 70 - 1. 62) Less Educ. /High Educ. 1. 67 (1. 49 - 1. 87) 1. 65 (1. 40 - 1. 94) 1. 49 (1. 22 - 1. 83) 1. 72 (1. 47 - 2. 00) 2. 01 (1. 48 - 2. 72) 1. 64 (1. 08 - 2. 50) 2
 Adjusted odds ratios* and 95% confidential intervals of stunting, underweight and wasting for selected sociodemographic factors in children under 5 years of age in 2000 and 2005 MICS 2, 2000 MICS 3, 2005 Stunting Underweight Wasting Male / Female 1. 18 (1. 05 – 1. 32) 1. 22 (1. 04 – 1. 44) 1. 08 (0. 88 – 1. 32) 1. 19 (1. 02 – 1. 39) 0. 99 0. 94 (0. 73 – 1. 35) (0. 62 – 1. 44) Rural / Urban 1. 21 (1. 03 – 1. 41) 1. 14 (0. 90 – 1. 43) 1. 15 (0. 87 – 1. 53) 0. 80 (0. 65 – 1. 00) 0. 61 0. 62 (0. 39 – 0. 95) (0. 32 – 1. 20) Less Educ. /High Educ. 1. 31 (1. 16 – 1. 49) 1. 32 (1. 11 – 1. 57) 1. 29 (1. 04 – 1. 60) 1. 41 (1. 80 – 1. 68) 1. 61 (1. 13 – 2. 30) (0. 96 – 2. 71) 2
 DISCUSSION Finding 1 – Nutrition Status was Improved, but Stunting was Persistent Reduction was observed in rural areas, in severe forms. o Implementation of nutrition program reached to the target directed to under 2 years old and countryside. o Mass migration from rural areas after 2000. o Other studies showed: Mongolian complementary foods are not adhered with recommendation. Frequency and amount are insufficient, but contained high calories and low nutrients (Lander R, 2008). o Micronutrients deficiency – Vit D def 41%, supplementation 15%, 74% of under 3 years old children had Zn deficiency in Mongolia (NNS 3, 2004; Lander R, 2010)
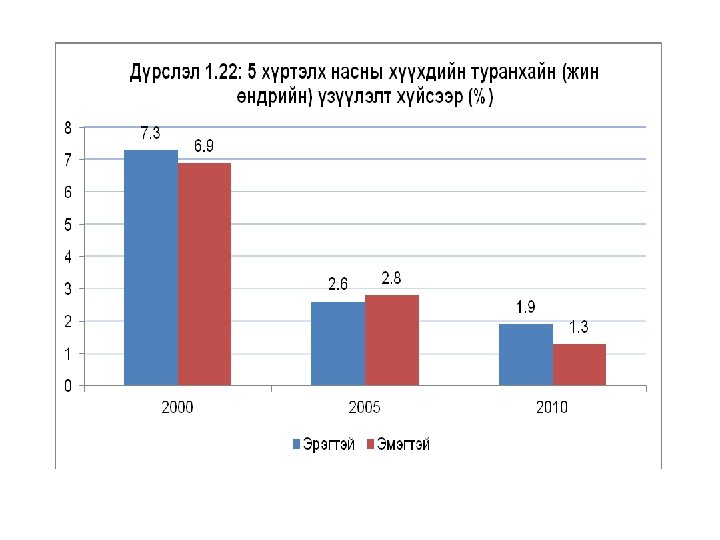
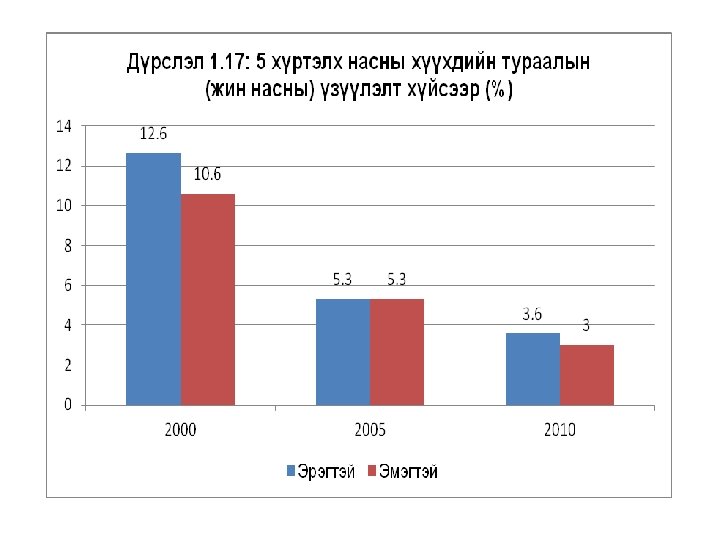
 Finding 2 – Boys were More Stunted than Girls As for growth patterns, boys in general tend to be taller and heavier than girls. o Other studies showed: Boys are taller in Bangladesh but shorter in sub-Saharan Africa (Dancer D, 2010; Wamany H, 2007) o Male gender is more predisposed to affect to undernutrition, morbidity and death (Elsmén E, 2002; Health statistics Mongolia, 2005) o Sex differential was not shown in NCHS reference, but it was shown in WHO standard in Mongolian cases.
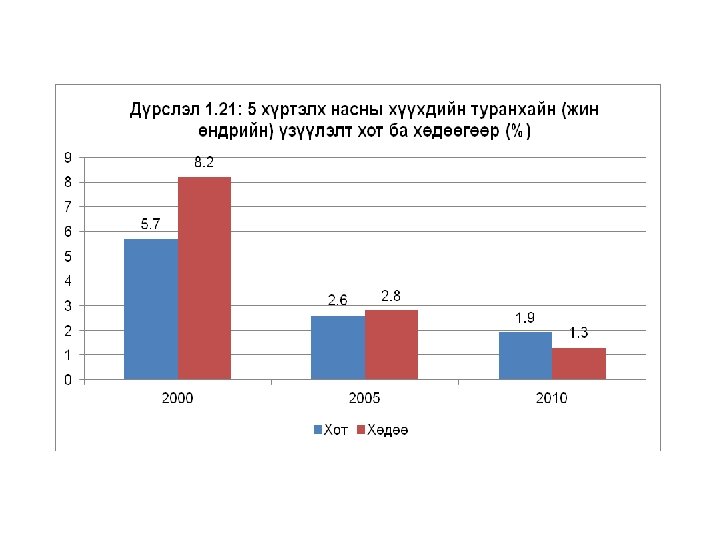
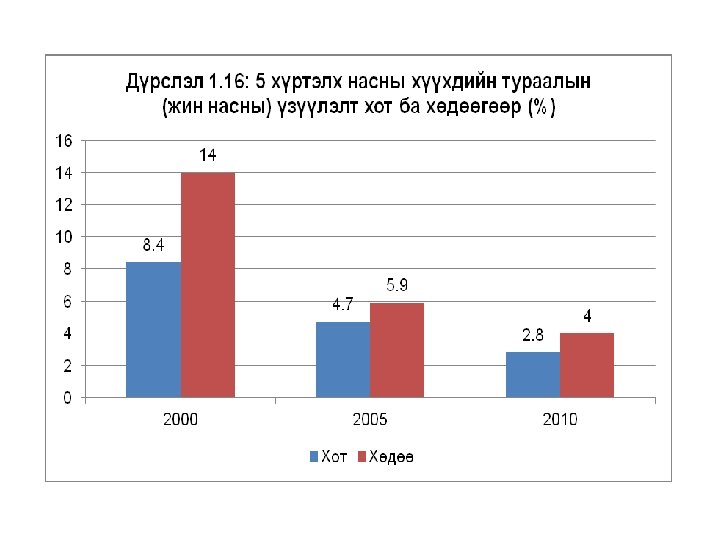
 Finding 3 – Residence Difference in Nutrition Other studies showed: Children in rural areas in the developing world were almost twice as likely to be underweight as children in urban areas (Gleland JG, 1988). The rural children were 2 times more affected to stunting and underweight than urban children in Mongolia (NNS 3, 2004). Compared with 2000, in 2005 the area of residence difference did not show any effects. It might be related to the successful implementation of nutrition programs in countryside, which mainly involved under 2 years old children in Mongolia since 2000. Also it might be related with internal migration after 2000.
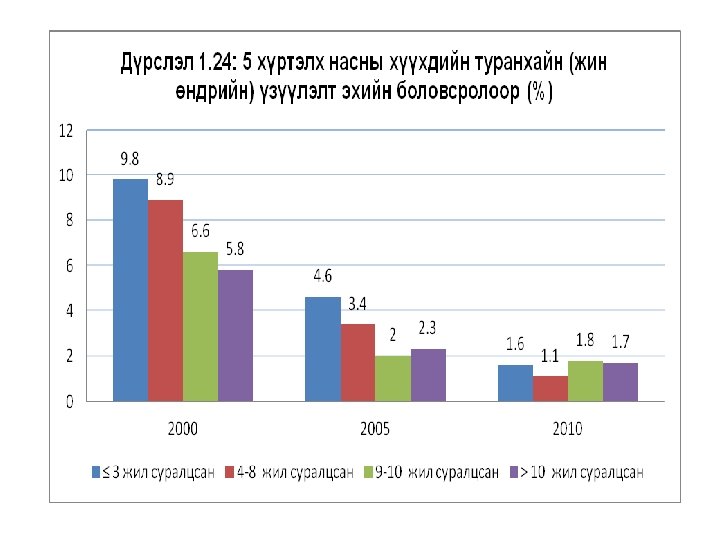
 Finding 4 – Mother’s Education Level Difference in Nutrition Similar to other studies in sub-Saharan Africa and Bangladesh (Wamany H, 2004 ; Giashuddin M, 2005). The Mongolian women’s literacy rate is high (97. 8%), but child feeding and caring practice are not adhered with the recommendation. Only 1. 6% of 6 -11 month old children, 0. 9% of 25 -59 months old children, and no 12 -23 month old children were fed according to the amount and frequency specified in the WHO recommendations. (NNS 3, 2004; Lander R, 2008 and 2010). The lack of economic capacity and child caring and feeding knowledge may reduce health potential of their children.
 Finding 5 – Wealth Index Difference in Nutrition The nutritional status in children under five years of age is often associated with measures of poverty. Other studies showed: The children who lived in low income households had 2 times more stunting and 1. 7 times more underweight than the children who lived in middle and high income households in Mongolia (NNS 3, 2004). The poorest sectors were at least three times as likely to be stunted as those in the richest (Larrea C & Freire W, 2002). Most of poor households placed in rural and peri urban areas. Less educated mothers of this study tend to belong to poor households.
 STUNTING HAZ< -2 SD MDG, Goal 1, objective 2: 2015 онд 13. 0%-д хүргэнэ
 40 35 Дүрслэл 1. 11: 5 хүртэлх насны хүүхдийн 35. 5 өсөлтийн хоцролтын (өндөр нас) үзүүлэлт хот ба хөдөөгөөр (%) 30 30 25 25. 1 22. 5 19. 9 20 15 11. 9 10 5 0 2000 Õîò … 2005 պ人 … 2010
 35 30 Дүрслэл 1. 12: 5 хүртэлх насны хүүхдийн өсөлтийн 31. 5 хоцролтын (өндөр нас) үзүүлэлт хүйсээр (%) 28. 2 29. 2 25. 6 25 20 17. 1 13. 5 15 10 5 0 2000 Ýðýãòýé … 2005 Ýìýãòýé … 2010
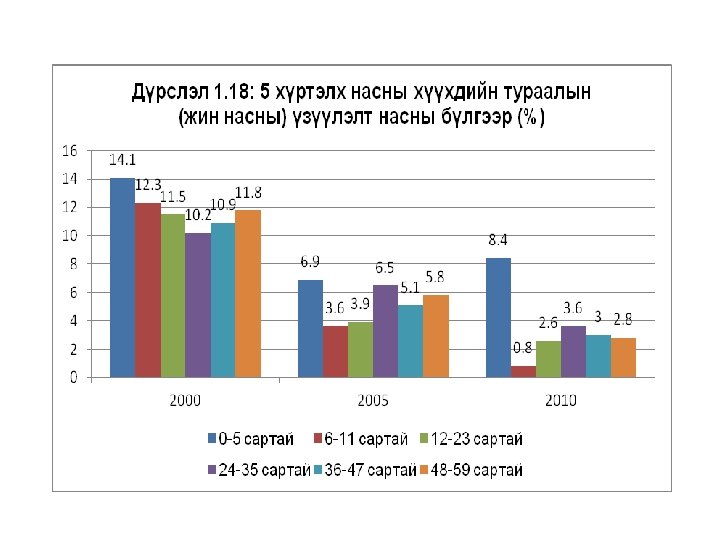
") 40 35 30 Дүрслэл 1. 15: 5 хүртэлх насны хүүхдийн өсөлтийн хоцролтын (өндөр нас) үзүүлэлт насны 33. 5 32. 8 бүлгээр (%) 31. 8 31. 3 36. 4 27. 5 30. 4 28. 1 29. 2 25 18. 4 20 15 20. 5 19. 6 15. 5 13. 8 12. 6 10 11. 7 8 7 5 0 0 -5 ñàðòàé … 24 -35 ñàðòàé … 2000 6 -11 ñàðòàé … 36 -472005 ñàðòàé … 12 -23 ñàðòàé … 48 -59 ñàðòàé … 2010
40 35 30 Дүрслэл 1. 15: 5 хүртэлх насны хүүхдийн өсөлтийн хоцролтын (өндөр нас) үзүүлэлт насны 33. 5 32. 8 бүлгээр (%) 31. 8 31. 3 36. 4 27. 5 30. 4 28. 1 29. 2 25 18. 4 20 15 20. 5 19. 6 15. 5 13. 8 12. 6 10 11. 7 8 7 5 0 0 -5 ñàðòàé … 24 -35 ñàðòàé … 2000 6 -11 ñàðòàé … 36 -472005 ñàðòàé … 12 -23 ñàðòàé … 48 -59 ñàðòàé … 2010
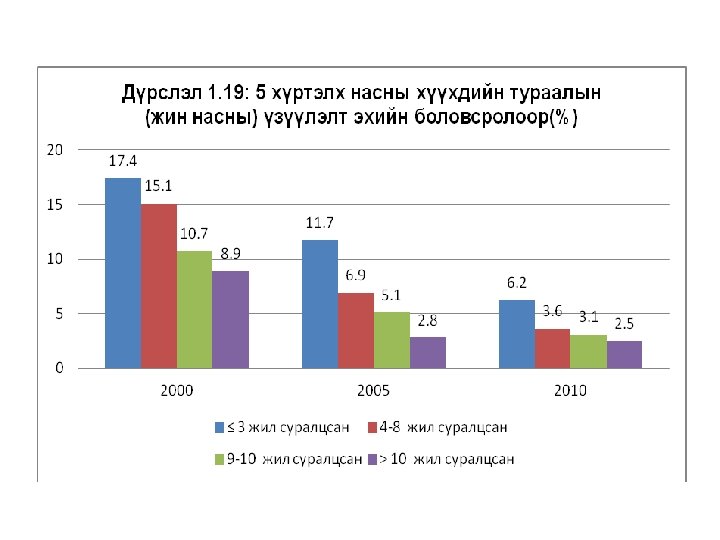
") 50 40 Дүрслэл 1. 14: 5 хүртэлх насны хүүхдийн өсөлтийн 44 хоцролтын (өндөр нас) үзүүлэлт эхийн боловсролын түвшнээр (%) 38. 2 35 33. 7 45 30 36. 9 29. 2 28. 3 26. 7 23. 1 25 20. 2 20 20. 6 15. 9 15 10. 1 10 5 0 ≤ 3 жил суралцсан 2000 4 -8 жил суралцсан 2005 жил суралцсан 9 -10 > 10 жил суралцсан 2010
50 40 Дүрслэл 1. 14: 5 хүртэлх насны хүүхдийн өсөлтийн 44 хоцролтын (өндөр нас) үзүүлэлт эхийн боловсролын түвшнээр (%) 38. 2 35 33. 7 45 30 36. 9 29. 2 28. 3 26. 7 23. 1 25 20. 2 20 20. 6 15. 9 15 10. 1 10 5 0 ≤ 3 жил суралцсан 2000 4 -8 жил суралцсан 2005 жил суралцсан 9 -10 > 10 жил суралцсан 2010
 UNDERWEIGHT WAZ < -2 SD MDG, Goal 1, objective 2: 2015 онд 2. 0%-д хүргэнэ
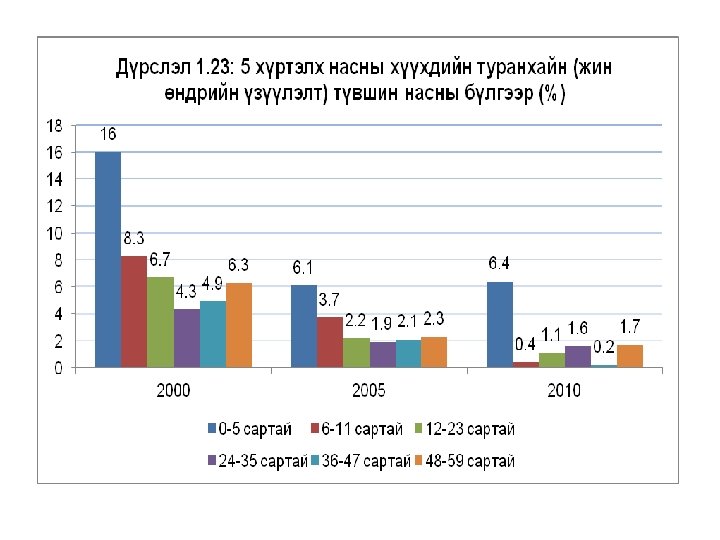
 WASTING WHZ < -2 SD MDG, Goal 1, objective 2: 2015 онд 1. 0%-д хүргэнэ