552f784ed2995abd9ee75a34155a52cf.ppt
- Количество слайдов: 108


Impact of Epidemiology on Diabetes Mellitus Echo Lecture from Thelma D. Crisostomo, MD

Epidemiology of Diabetes Mellitus Type II

Global – 2000 AD 1990 Developing countries Developed countries Total 2000 60 million 20 million 120 million 40 million 80 million 160 million Figure 1. Diabetes-the global situation. It is estimated that in the year 2000 the number of diabetic patients will reach 160 million

Total Number of People with Diabetes Year 2000 Year 2030 171 Million 366 Million

Developing Countries Most Affected In This Global Diabetes Epidemic

Certain Ethnic Groups Who Have Experienced Rapid Modernization Of Lifestyle Demonstrate The Greatest Susceptibility To Type 2 DM

Epidemiology Studies distribution and determinants of disease PURPOSE To understand natural history, cause of the disorder and pathogenesis. For appropriate diagnostic investigation and clinical management. For creation of scientifically based program for prevention and health care.

The First Step Of Epidemiologic Research Begins With Measuring Incidence Number of new cases discovered for a specific time and place. Used to identify epidemics. Used to search for etiology Prevalence Total number of cases old and new occurring in a specified time and place. Tool for determining public health needs.

Is There An Epidemic Of Type 2 Diabetes Mellitus? Epidemic – Definition The occurance in a community of a disease, infectious or chronic (e. g. diabetes mellitus), occurring at a greater frequency than usually expected. Does this apply to Type 2 DM? Yes, particularly in industrialized nations. developing and newly

Type 2 DM: A Public Health Prospective Type 2 DM is among the top 7 cause of death in most countries. Cardiovascular complications are major cause of morbidity and mortality: This results in the impact of type 2 DM being underestimated from death certificates. There is an excessive frequency of coronary artery and peripheral vascular disease and strokes.

Type 2 DM: A Public Health Prospective Type 2 DM is the most common cause of adult blindness and a common cause of renal failure and amputation. Results in disability, reduced life expectancy and enormous health cost for any society.

Cause of Death in Type 2 DM

The true cost of treating T 2 DM is not the cost of oral hypoglycemics. The true cost come from treating complications with non-OADs and other forms of treatment

Cost Associated with Type 2 Diabetes

Etiologic Classification of Diabetes Mellitus I. Type 1 Diabetes (B-cell destruction, usually leading absolute insulin deficiency). a. Immune mediated b. Idiopathic II. Type 2 Diabetes (may range from predominantly insulin resistance with relative insulin deficiency to a predominantly secretory defect with insulin resistance).

Etiologic Classification of Diabetes Mellitus III. Other a. b. c. d. e. f. g. h. specific types Genetic defects of B-cell function Genetic defects in insulin action Disease of the exocrine pancreas Endocrinopathies Drug – or – chemical – induced Infections Uncommon forms of immune-mediated diabetes Other genetic syndromes sometimes associated with diabetes IV. Gestational diabetes mellitus (GDM)

Ratio of Diagnosed / Undiagnosed Type 2 DM United States 1: 1 Western Europe 1: 1 Other Countries 1: 7

Prevalence of NIDDM in Selected Populations in the Age Range 30– 64 Years

Prevalence of DM Worldwide Year 2000 Year 2030 2. 8% 4. 8%

Global Diabetes Prevalence by Age and Sex for 2000

List of Countries with the Highest Numbers of Estimated Cases of Diabetes for 2000 and 2030

Estimated Number of Adults with Diabetes by Age-Group, Year, and Countries for the Developed and Developing Categories and for the World.

Estimated Number of Adults with Diabetes by Age-Group, Year, and Countries for the Developed and Developing Categories and for the World.
 1982 - 1983 General Population 4. 17% Rural Areas 2.")
Prevalence of DM (Philippines) 1982 - 1983 General Population 4. 17% Rural Areas 2. 5% Urban Areas 6. 8% National Capital Region 8. 4%
 1982 - 1983 General Population 4. 5% National Capital Region")
Prevalence of IGT (Philippines) 1982 - 1983 General Population 4. 5% National Capital Region 7. 3%

What is the Prevalence of Diabetes Mellitus in the Philippines? A. B. C. D. E. 2 out of 100 4 out of 100 6 out of 100 8 out of 100 10 out of 100 5 th National Nutrition Survey FNRI, DOST Oct 1999 N = 70, 000 99 areas

Diabetes Genetics Environment

Aetiology of NIDDM: The Interaction of Genetic Susceptibility and Environment Factors Heredity Genetic Susceptibility Obesity Physical inactivity Nutritional Factors Hyperinsulinemia Aging Insulin Resistance Beta-cell Failure Type 2 DM Intrauterine Factors

Collision Hunter Gatherer Genes VS 20 th Century Lifestyle Type 2 DM

Thrifty Gene Hypothesis Past populations subjected to cycles of feast/famine Genes were adopted to store energy efficiently Rapid Modernization Famine rare. Abundant food stored efficiently Results in Obesity, hyperinsulinemia and diabetes
 Hunter-gatherer society Modern society Feast + famine Feast Maximum metabolic efficiency")
‘Thrifty Genotype’ (Hyperinsulinemia) Hunter-gatherer society Modern society Feast + famine Feast Maximum metabolic efficiency Insulin resistance § Hepatic gluconeogenesis § Hepatic lipogenesis § Selective insulin resistance in muscle Survival • diet energy dense, high saturated fat • Physical inactivity • Obesity B-cell exhaustion Glucose intolerance Dyslipidemia Hypertension A proposal for the operation of the “thrifty genotype” in the pathogenesis of non-insulin dependent diabetes and other associated cardiovascular disease risk factors in populations who have changed their life-style from hunter gatherer to modern.
")
Age-Standardized prevalence of diabetes in adults in “urban” pacific populations (25 -74 years)
. Age-standardized by direct")
Prevalence of diabetes by ethnic groups in Mauritius (25 -74 years). Age-standardized by direct method to total Mauritius population – 1986.
 in China, Singapore and Mauritius.")
Prevalence of NIDDM in Chinese (30 – 64 years) in China, Singapore and Mauritius. Age-standardized by the direct method to Segi’s world population.

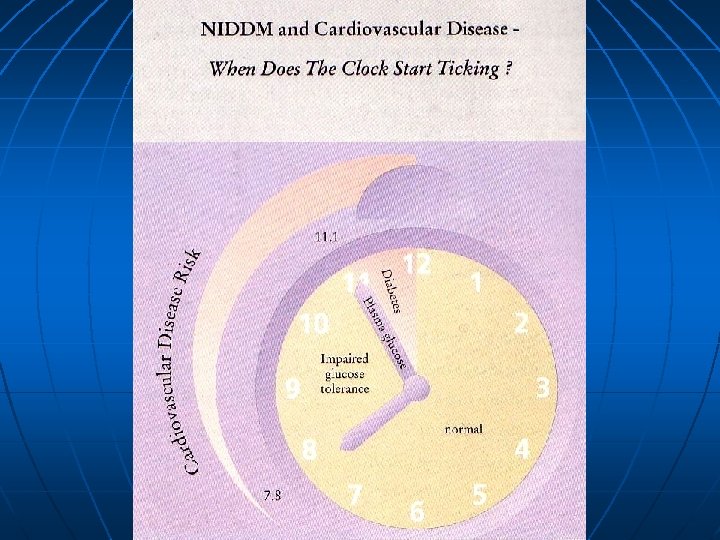
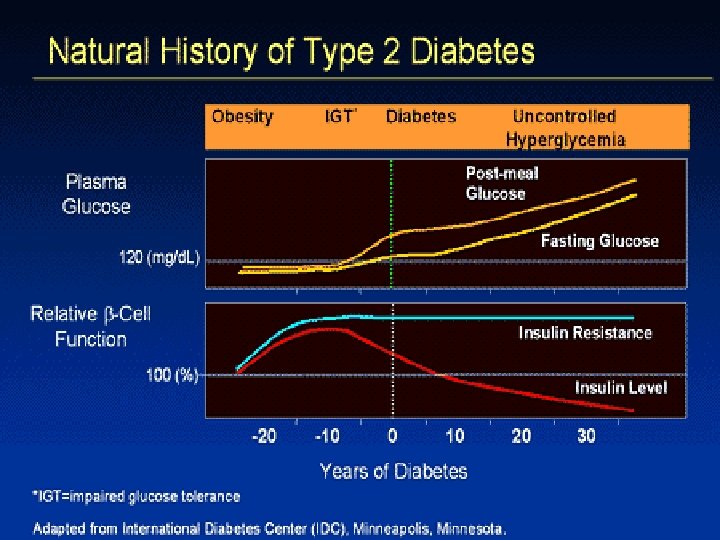
Stages in the Development of Type 2 DM Genetic susceptibility Hyperinsulinemia and/or insulin resistance Impaired glucose tolerance Non-insulin dependent diabetes

Development of Type 2 Diabetes I II III Fasting Glucose IV V Hyperglycemia Glucose Tolerance Abnormal glucose tolerance Insulin Sensitivity Decreased insulin sensitivity Insulin Secretion Hyperinsulinemia, the -cell failure Normal IGT Type 2 Diabetes

Development of Type 2 Diabetes Insulin Sensitivity Insulin Secretion Macrovascular Disease 30% 50% 70% 100% 50% 70 -100% 150% 100% 50% 40% 10% 0% Macrovascular disease is closely linked to Insulin Resistance Groop Etiology of non-insulin-dependent diabetes mellitus. Hormone Res. 1997; 22: 131 -156 Type 2 Diabetes IGT Impaired Glucose Metabolism Normal Glucose Metabolism

Studies that Confirm the Strong Genetic Basis of Type 2 DM Twin studies Familial aggregation High prevalence population Genetic Admixture studies Prevalence in different ethnic groups in same environment MODY/Nauruans/Pimas – autosomal dominant inheritance

Genetic Factor Type 2 DM – 100% Concordance in Identical Twins Type 1 DM – 30 -50% in Concordance in Identical Twins

Impaired Glucose Tolerance Worsening to Diabetes in Siblings Overall Occurrence Rate Diabetes 12% Impaired Glucose Tolerance 12%

IGT Worsening to Diabetes Filipino Siblings 50% Conversion in 8 years Conversion rate: 9. 3 per 100 cases/year

IGT Conversion Rate PIMA Indians 9. 3 cases per 1000/year Filipino Siblings
 Natural History Subjects with IGT 10 yr Follow up")
Impaired Glucose Tolerance (IGT) Natural History Subjects with IGT 10 yr Follow up

Major Behavioral, Environmental and Social Risk Factors for Type 2 DM These may vary within and between populations and include: Age Nutritional factors Obesity (central) Physical inactivity Degree of modernization Intra-uterine environment ? Stress, ? others

Changes in Component of the Diet that Have Been Seen in the Change From Hunter Gatherer to the Modern “Western” Diet Fat 15 to 20% Fat 10 to 15% Fat 40+% Sugar 5% Sugar 20% Starch 50 to 70% Starch 60 to 75% Starch 23 to 30% Protein 15 to 20% Protein 10 to 15% Protein 12%

High Fat, High Simple Sugar Low Complex Carbohydrate Diet in westernized Societies are contributing to the excess Obesity and NIDDM

Environmental Determinant of Type 2 DM Obesity If there were no obesity, the prevalence of diabetes would be greatly reduced
")
Central Distribution of Body Fats as Risk Factor for NIDDM Implicated in: Europids (Sweden) Mexican Americans Native Americans Micronesians (Nauruans) Asian Indians (Hindu and Muslim) Creoles Chinese Japanese Americans
 Plasma glucose response ( U/dl) Minutes")
Insulin Resistance in Obesity Plasma glucose response (mg/dl) Plasma glucose response ( U/dl) Minutes Normal weight (mean 66. 1 kg) Reaven et al. : Diabetes 32, 600, 1 983 Moderately obese (mean 91. 1 kg)

Environmental Determinant of Type 2 DM Intrauterine Factor Low Birth Weight-Risk Factor for NIDDM Impaired Development of Endocrine Pancreas

Physical Inactivity Risk Factor for Diabetes Possible Explanation Insulin Resistance

IGT New NIDDM inactive BMI Tertile Prevalence of abnormal glucose tolerance by body mass index and physical activity (Mauritius) 1997

Higher Prevalence in Urban Than Rural Environment Explanation: Change in lifestyle Physical Activity More Refined Diet Greater Occurrance of Obesity

Major Behavioral, Environmental and Social Risk Factors for Type 2 DM These may vary within and between populations and include: Age Nutritional factors Obesity (central) Physical inactivity Degree of modernization Intra-uterine environment ? Stress; ? Others

Preventing Type 2 DM Evidence that it is possible Primate studies of Type 2 DM Prevention of coronary artery disease Reversion to traditional life-style Rural-urban studies of risk factors Influence of physical activity Type 2 DM prevalence and incidence

Marked Improvement in Fasting Metabolic Parameters in Ten Australian Aborigines with 7 Week Reversion to Traditional Lifestyle Parameter n. Plasma glucose (mm/l) n Plasma insulin (m. U/ml) n Plasma cholesterol (mm/l) n Plasma triglycerides (mm/l) n Weight (kg) * P < 0. 005 ** p < 0. 001 Before after 11. 6 23. 0 5. 65 4. 02 81. 9 6. 6 ** 12. 0 * 4. 98 1. 15 ** 73. 8

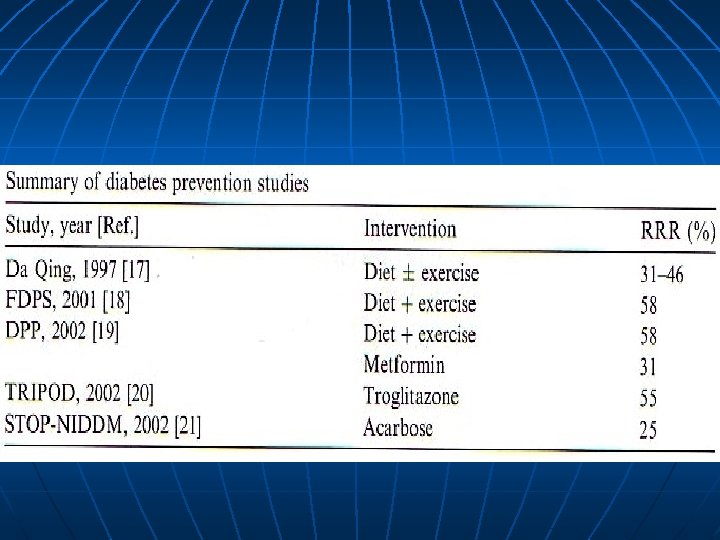
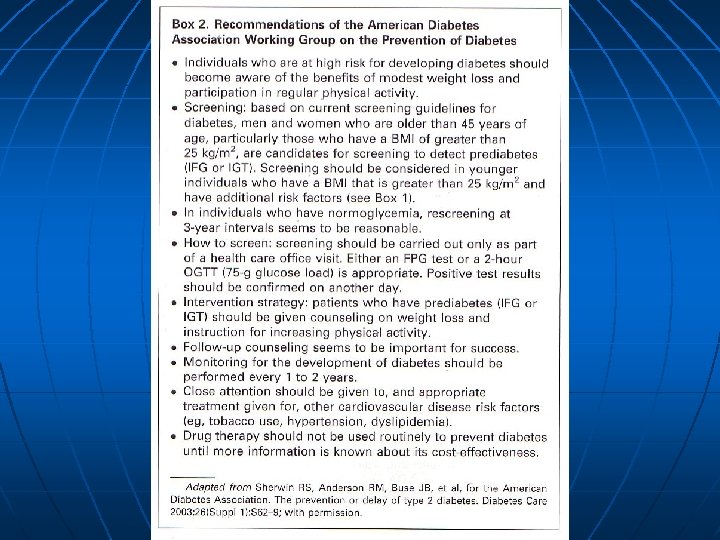
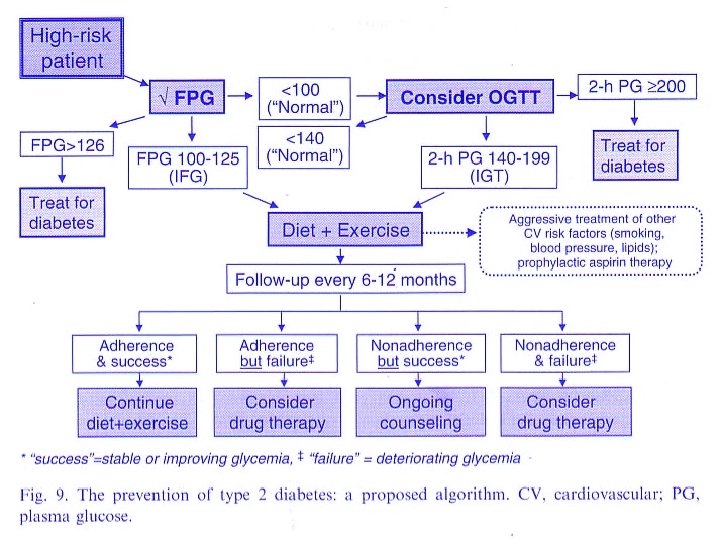
Interventional Strategies 1. 2. 3. 4. Weight Reduction Dietary composition Exercise Pharmacologic therapy
. Certain")
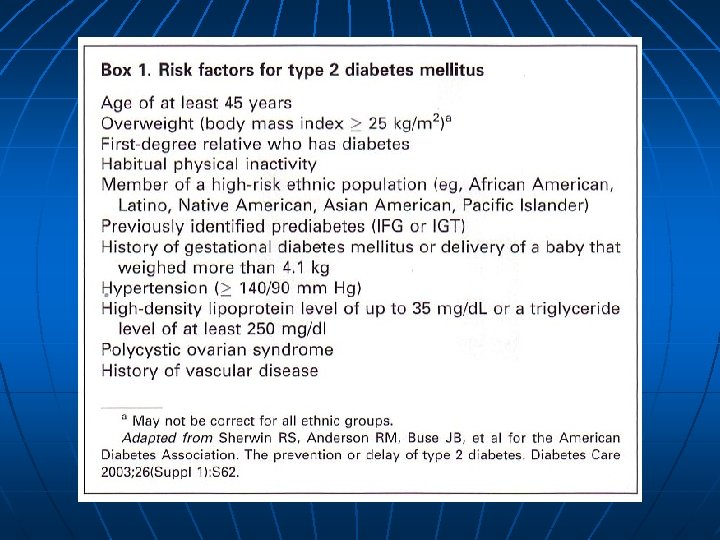
People at High Risk of Developing Type 2 DM Impaired glucose tolerance (IGT). Certain ethic groups such as Pacific Islanders, Australians Aborigines, migrant Asian Indians, American Indians, Black and Hispanics who show high diabetes prevalence. Positive family history of Type 2 DM in first degree relatives (parents, siblings or children). Obesity especially in women with a past history of gestational diabetes or large babies.

People at High Risk of Developing Type 2 DM Age greater than 50 years in Europids and lower ages (30 to 40 years) in high prevalence groups. History of previous abnormality of glucose tolerance, particularly in pregnancy. Hypertension, macrovascular disease or dyslipidemia.

Epidemiology of Type I DM

Type 1 Genetics Environment
 ? Chemicals ?")
Aetiology of Type 1 DM Viruses Genetic susceptibility (HLA – DQ) ? Chemicals ? Nutrition Autoimmune Process Beta-cell destruction Insulin-dependent diabetes mellitus (Type 1 DM) Modified from Schoffling, K. : Diabetologic in Klinik und Praxis, Thieme, 37 -41 1984

Features of Type 1 DM Occurs at any age Proneness to ketoacidosis Low insulin and C peptide levels Specific associations with the HLA complex Islet cell antibodies High frequency of insulin auto antibodies

Comparison of Characteristics of Type 1 DM and Type 2 DM IDDM NIDDM 0. 5% 3– 5% Usually < 40 yrs* Autoimmune aetiology Yes No n ICA, anti-GAD Yes No n HLA association Yes No Twin Studies (monozygotic) concordance 30% 90% Invariable 20 – 30 % Infrequently 80% Prevalence in population Age of onset Insulin therapy Association with obesity * Can vary significantly depending on population

Standardized Incidence Rates Age 0 – 14 years Denmark Finland Sicily Sardinia Incidence of Childhood Onset Type 1 DM (1998 1990) European Study

Incidence Rate of Type 1 DM in Children less than 15 yrs old Incidence Rate / 100, 000

Geographic and Ethnic Variation Markeded Variations are Reflections of Difference in: Environment Genetic Susceptibility

Environmental Factors Nature of these factors are still obscure Possible cause 1. Viral infections Rubella Coxsackle B Mumps 2. Chemicals Rodernticides Alloxan Streptozocin 3. Changes in breast feeding habits

Early cow’s milk exposure may be an important determinant of subsequent Type 1 Diabetes and may increase the risk – 1. 5 times

Cow’s Milk Consumption and Type 1 DM Incidence Region Portugal Greece Sicily Lazio Luxebourg Lombardy Belgium Sardinia France Israel Spain Netherlands U. K. Denmark Austria Norway Finland Cow’s milk consumption IDDM I Incidence 62. 0 66. 7 68. 1 77. 8 78. 6 80. 6 81. 1 83. 2 86. 3 90. 0 104. 9 120. 9 135. 0 145. 5 148. 7 222. 1 224. 9 7. 5 9. 3 10. 0 6. 5 12. 4 6. 8 9. 8 30. 2 7. 8 5. 5 10. 6 11. 0 16. 5 21. 5 7. 7 20. 8 42. 9 Cow’s milk consumption measured in liters/ person / year IDDM incidence per 100, 00 / year in those 0 – 14 years

Type 1 DM Genetic Factors Concordance rate Monozygotic twins Dizygotic twins Siblings Offspring : : 25 – 30% 5 – 10% 5% 2 – 3 % (if mother is diabetic) 5 – 6 % (if father is diabetic)

HLA System in Type 1 Diabetes Mellitus Genes Conferring Susceptibility Class II Allele European : HLA – DR, -DQ, -DP LOGI : DR 3, DR 4 (5 -8 x risk) : DR 3/DR 4 (20 – 40 x risk) : HLA – DR 3 DQW 2 : HLA – DR 4 DQW 8 : DOA 1*0501, DQB 1*0302 Genes Conferring Protection : HLA-DR 2 : HLA DQB 1*0602

HLA System HLA A B C Antigens - Present in all body cells HLA DR Antigens - Restricted to B Lymphocytes, Macrophages, endothelial cells Function (HLA - DR) - Defense against aggressive environmental factors and involved in autoreactive self recognition of tissue antigens.

Reports of Diabetes Mellitus and ICA Associated with Known Virus Infection References Virus Islet-Cell Antibodies Ig. G Yoon et. al 1979 (33) Helmke et. al; 1980 (42) Ilonen et. al 1980 (43) Gamble et. al 1980 (unpublished) Champsaur et. al 1982 (44) CF = complement fixing Cox B 4 Mumps Influenza Cox. B 5 CF + + Not done + + < 1: 20

Type 1 DM – Immunological Factors Not yet well defined Initiating autoantigens identified through studies on: Islet Cell Cytoplasmic Antibodies Insulin Autoantibodies Anti-GAD Antibodies to Pancreatic B Cell Surface Protein p 69 Immune phenomena decline rapidly Shown by rapid disappearance ICA (Type 1 A) 85 – 90% (Viral Etiology) Immune phenomenon may persist (Type 1 B) 10 – 15% characteristics of primary autoimmune endocrine disorder.

The Known an Unknown Immunological Phenomena Possibly Involved in the Recognition and Subsequent Damage of Pancreatic Beta Cells Complement Natural killer cell ? Insulin Cell • virus or modified (tumour) antigens § HLA-A, -B, -C histocompatibility antigens Killer cell §? Cytotoxic Thymphocyte cell

Onset of Type 1 DM Protracted Prodromal Period Over hyperglycemia occurs many years after islet cell antibodies and insulin autoantibodies are detected.

Seasonal Distribution of Onset of Type I Diabetes Number of Patients UK 40 30 20 10 J A S O N D J F M E M Number of Patients Chile 50 J Combined data from studies carried out in the UK and Chile (38, 41). Approximately 1500 cases have been analyzed (age of onset: UK: 0 -15 year; Chile 0 -30 years). Major peeks are seen in autumn and winter and this pattern have been confirmed in a number of countries in the northern hemisphere.

Relative Frequency % Pattern of Age Onset of Type 1 Diabetes Total Males Females Age (Years) Combined data from studies out in Denmark, Chile, USA and Canada. The relative frequency of Type 1 diabetes up to age 28 years is shown. Diabetes can occur in the first months of life and its frequency increase abruptly at about 9 months of age, rising to a major peak at puberty. This peak is earlier in girls than boys.
")
Causes of Death in Type 1 DM (Age < 30 years)

The Natural History of Insulin-dependent diabetes mellitus* Onset of diabetes Environmental factors Complications e. g. viral infection cow’milk nutrition DEATH Disability Genetic Susceptibility e. g. certain HLA types ICA + Hyperglycemia IAA + insulin Anti-GAD + dependency Retinopathy Nephropathy Atherosclerosis Neuropathy Blindness Renal failure Coronary heart disease Amputation * HLA, Human Leukocyte Antigen: ICA, Islet-Cell Cytoplasmic Antibodies; IAA, Insulin Autoantibodies; anti-GAD, antibodies to glutamate Decarboxylase

Can Type 1 DM be Prevented? Insulin Prophylaxis Nicotinamide Cow’s milk Exclusion > 20 JDFu ICA + Loss of FPIR IAA Dual Parameter Model FH + Baseline Risk IAA etc. Genetics Markers ICA + FH - The decision tree representation of prediction Type 1 DM with intervention trials planned in 1994

Insulin Therapy for End Stage Prediabetes State Rationale: Improve cell function to delay onset of Diabetes. Initiating active insulin substitution rapidly may save as many cells as possible.

Thank you!


Classification of Diabetes Mellitus and Other Categories of Glucose Intolerance* Clinical classes Diabetes mellitus Insulin-dependent (IDDM) Non-insulin dependent (NIDDM) Non-obese Obese Malnutrition related (MRDM) Other types Pancreatic Endocrine Drug-induced, etc.

Classification of Diabetes Mellitus and Other Categories of Glucose Intolerance* Other categories Impaired glucose tolerance (IGT) Gestational Diabetes Mellitus (GDM) * WHO Study Group on Diabetes Mellitus - 1995

NIDDM – A Public Health Perspective NIDDM is amongst the top 7 causes of death most countries. Cardiovascular complications are a major cause of morbidity and mortality. This results in the impact if NIDDM being underestimated from death certificates. There is an excessive frequency of coronary artery and peripheral vascular disease and strokes. NIDDM is the most common cause of adult blindness and a common cause of renal failure and amputations. Results in disability, reduced life expectancy and enormous health cost for any society

Studies of Diabetes Epidemiology 1. Modernization of Lifestyle in situ 2. Rural-Urban comparisons 3. Migration studies 4. Several ethnic groups living in same location

Thrifty Genotype How does a genetic disorder, such as Diabetes, with adverse impact on fertility and mortality, survive with such a high prevalence within population?

The New World Syndrome Non-insulin-dependent diabetes mellitus Central obesity Dyslipidemia Hyperinsulinemia Hypertension

NIDDM – A Spectrum Ranging from Hyperinsulinemia to Hypoinsulinemia Hyperinsulinemia / insulin resistance Insulinemia deficiency

Preventing NIDDM Evidence that it is possible: Primate studies of NIDDM Prevention of coronary artery disease Reversion to traditional life-style Rural-urban studies of risk factors Influence of physical activity on NIDDM prevalence and incidence

Primary Prevention The promotion of health by personal and community-wide efforts, e. g. improving nutritional status, physical fitness etc.

NIDDM Hyperinsulinemia Insulin resistance Dyslipidemia Central obesity hypertension NIDDM is the “tip of the iceberg” of a cluster cardiovascular disease risk factors.

Why is Diabetes Mellitus Important? Many people have the disease. Those who have the disease are at greater risk of dying. Those who have the disease puts a burden on health care cost because of the complications that develop.

Prevalence if diabetes of diabetes by usual physical activity level (males > 20 years; age-standardized).

Prevalence of NIDDM Adults 25 years and Over in the USA Harris MI, et al: Diabetes 36, 523 -534, 1978

Dietary Factors Determining IGT and NIDDM High fat intake contributes to risk of glucose intolerance. Fish, potatoes, vegetables, legumes may have protective effects. Vitamin C and Antioxidants may have protective effects. Finnish and Dutch Study Diabetes Care August 1995

Total Number of People With Diabetes is Increasing Due to: 1. 2. 3. 4. Population growth AGING URBANIZATION Increasing prevalence of obesity and physical inactivity
552f784ed2995abd9ee75a34155a52cf.ppt