Identifying Choroidal Neovascularization Using Fluorescein Angiography and Complementary

fluorescein_angiography.ppt
- Размер: 8.8 Мб
- Автор:
- Количество слайдов: 62
Описание презентации Identifying Choroidal Neovascularization Using Fluorescein Angiography and Complementary по слайдам
 Identifying Choroidal Neovascularization Using Fluorescein Angiography and Complementary Imaging Techniques
 Fundamentals of Fluorescein Angiography
 Use of Fluorescein Angiography To show characteristics of retinal blood flow To detect retinal and choroidal pathology which is not visible with other techniques – Vascular changes at the retinal and choroidal level, e. g. retinal vessels, CNV – Phathologies of the retinal pigment epithelium (RPE)
 Physical-Chemical Features of Fluorescein Blue light is absorbed by fluorescein and leads to excitation of the molecules – Maximum absorption: 480– 500 nm Green light is emitted once molecules change to a lower energetic level – Maximum emission: 520– 530 nm A camera system with a yellow-green filter is used to visualize the fluorescence
 extremely rare. Fluorescein Angiography: Adverse Events Extravasation associated with local irritation Nausea (2– 4%) Syncope Anaphylactic reactions Death due to cardiac complications
 Fluorescein Angiography: Requirements Standardized protocol: minimum requirements: – Color fundus photographs – Red-free photographs – Fluorescein angiograms run to 10 minutes Can also have: – Color fundus photographs of both diseased and fellow eye – All images in stereo
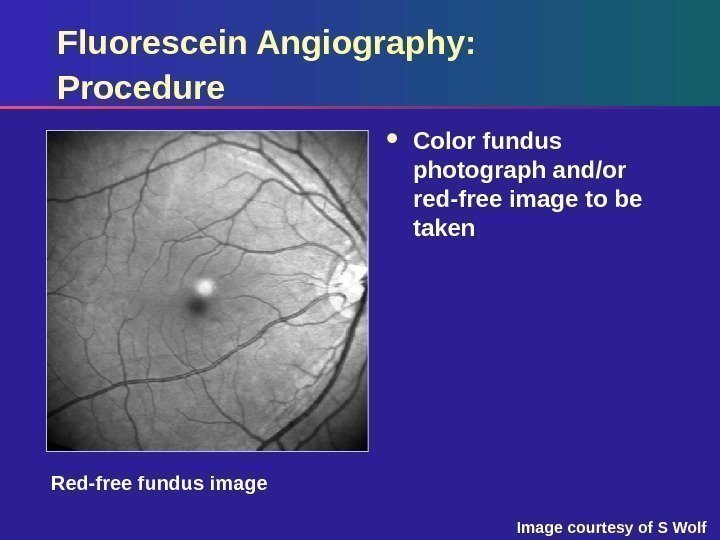
 Red-free image. Fluorescein Angiography: Procedure Color fundus photograph and/or red-free image to be taken Red-free fundus image Image courtesy of S Wolf
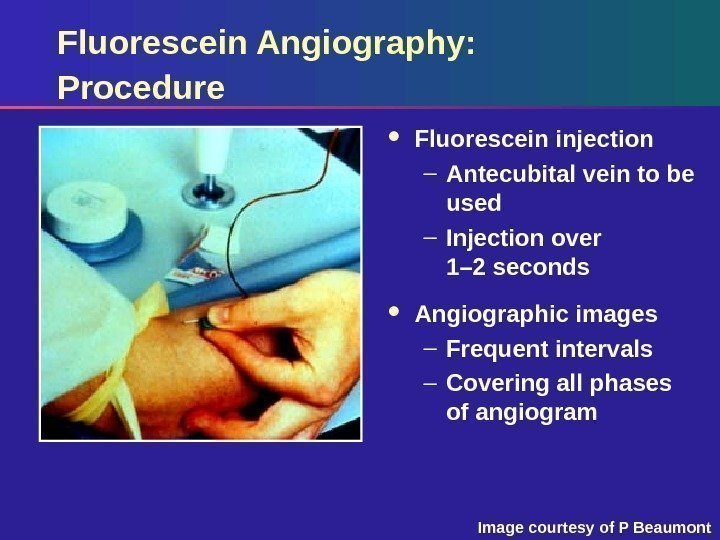
 Fluorescein Angiography: Procedure Fluorescein injection – Antecubital vein to be used – Injection over 1– 2 seconds Angiographic images – Frequent intervals – Covering all phases of angiogram Image courtesy of P Beaumont
 Technical Aspects: Variables Affecting Quality Dilatation of the pupil Opacity of the optic media Cooperation of the patient Volume and speed of the fluorescein injection
 Fluorescein Angiogram: Phases Transient phase Arterial (early) phase Venous (mid) phase Late phase
 Fluorescein Angiogram: Features by Phase Transient phase – Duration for distribution of fluorescein to ocular vessels Arterial (early) phase – Filling of retinal arterial vessels and capillaries – Filling of the choroid – 1– 2 minutes
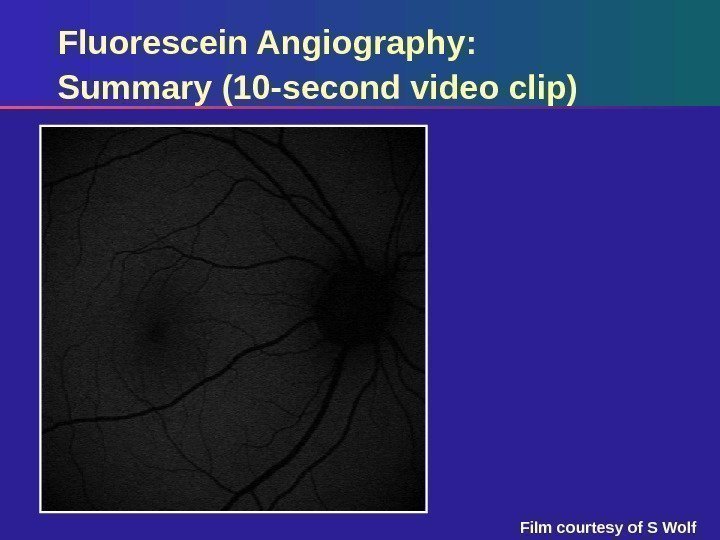
 Fluorescein Angiography: Summary (10 -second video clip) Film courtesy of S Wolf
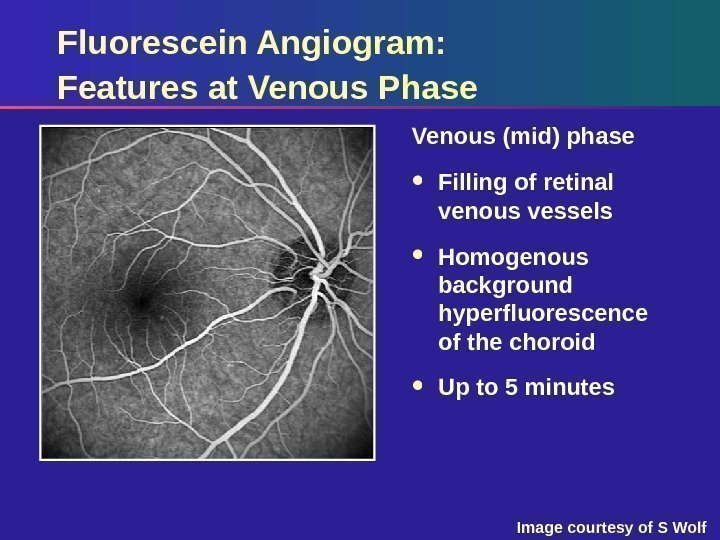
 Fluorescein Angiogram: Features at Venous Phase Venous (mid) phase Filling of retinal venous vessels Homogenous background hyperfluorescence of the choroid Up to 5 minutes Image courtesy of S Wolf
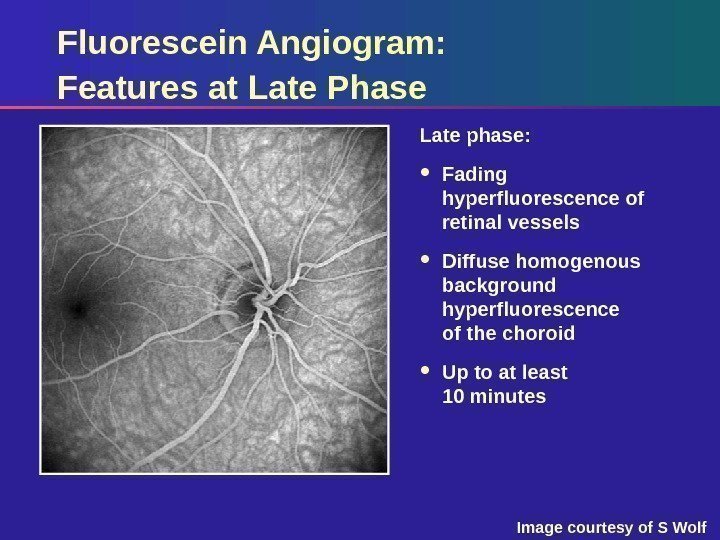
 Fluorescein Angiogram: Features at Late Phase Late phase: Fading hyperfluorescence of retinal vessels Diffuse homogenous background hyperfluorescence of the choroid Up to at least 10 minutes Image courtesy of S Wolf
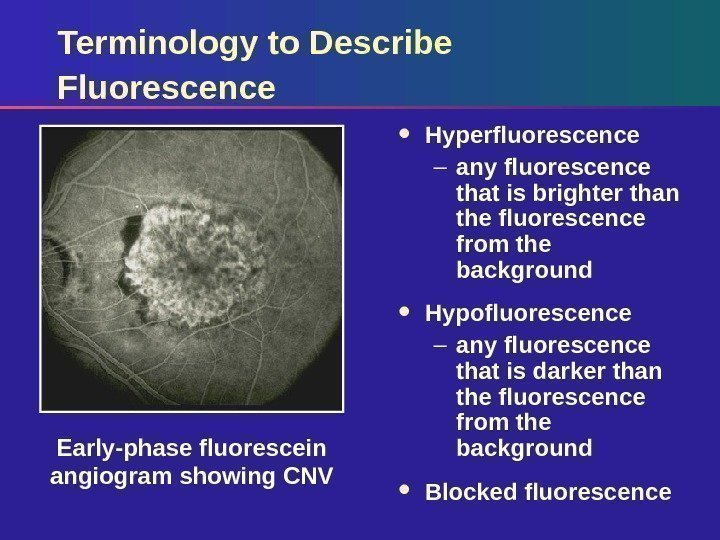
 Terminology to Describe Fluorescence Hyperfluorescence – any fluorescence that is brighter than the fluorescence from the background Hypofluorescence – any fluorescence that is darker than the fluorescence from the background Blocked fluorescence. Early-phase fluorescein angiogram showing CNV
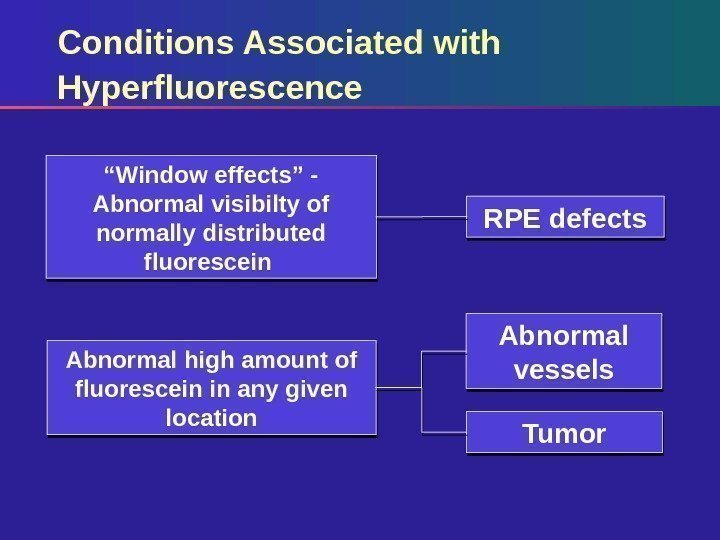
 Conditions Associated with Hyperfluorescence RPE defects Abnormal vessels Tumor“ Window effects” — Abnormal visibilty of normally distributed fluorescein Abnormal high amount of fluorescein in any given location
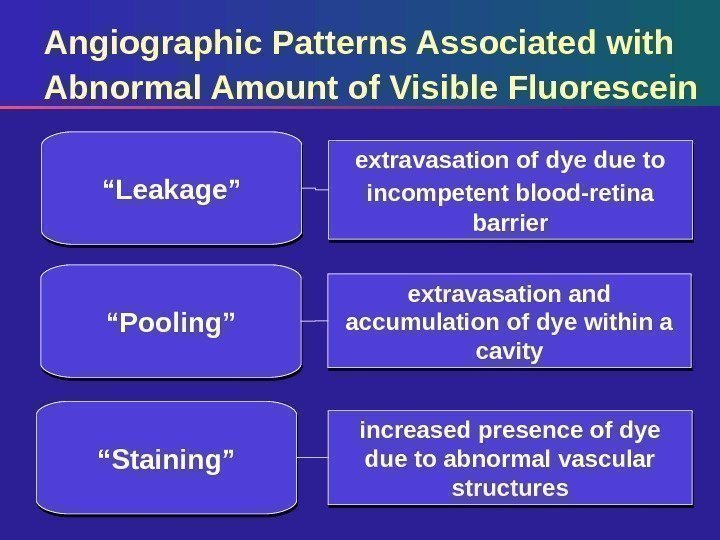
 Angiographic Patterns Associated with Abnormal Amount of Visible Fluorescein extravasation of dye due to incompetent blood-retina barrier“ Leakage” extravasation and accumulation of dye within a cavity increased presence of dye due to abnormal vascular structures“ Pooling” “ Staining”
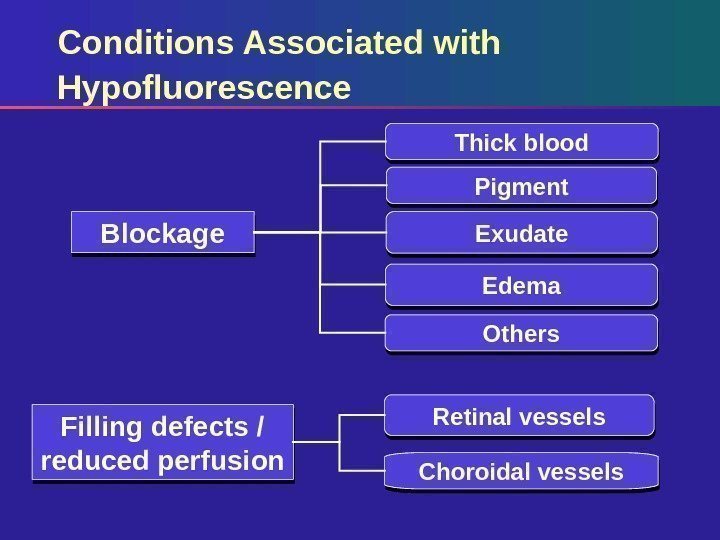
 Conditions Associated with Hypofluorescence Pigment Exudate Edema Others. Blockage Filling defects / reduced perfusion Retinal vessels Choroidal vessels Thick blood
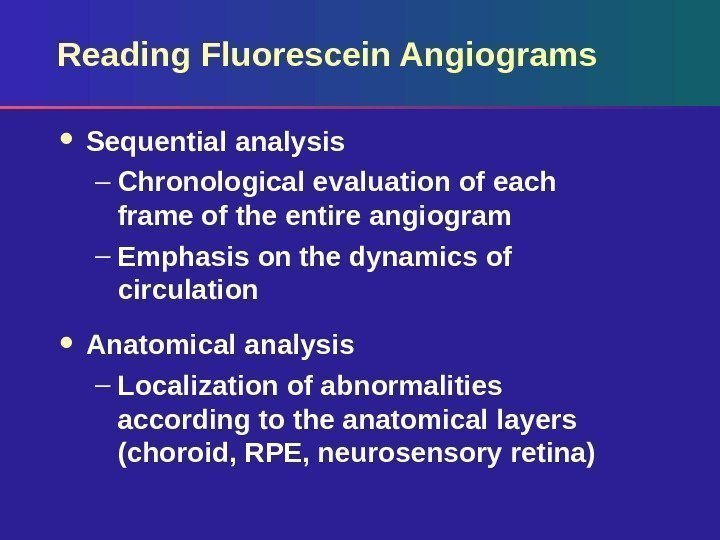
 Reading Fluorescein Angiograms Sequential analysis – Chronological evaluation of each frame of the entire angiogram – Emphasis on the dynamics of circulation Anatomical analysis – Localization of abnormalities according to the anatomical layers (choroid, RPE, neurosensory retina)
 Fluorescein Angiography: Gold Standard for Imaging CNV
 Causes of Choroidal Neovascularisation Age-related macular degeneration (AMD) – Leading cause of severe vision loss in people over 50 years of age Pathologic myopia – The most frequent cause of CNV in people under 50 years of age The ocular histoplasmosis syndrome (OHS) – Frequent cause of CNV in mid-central USA Angioid streaks, idiopathic causes
 Two Forms of AMD Non-neovascular / atrophic or geographic AMD – Affects 80% of patients with AMD Neovascular or wet AMD – Affects 20% of patients with AM
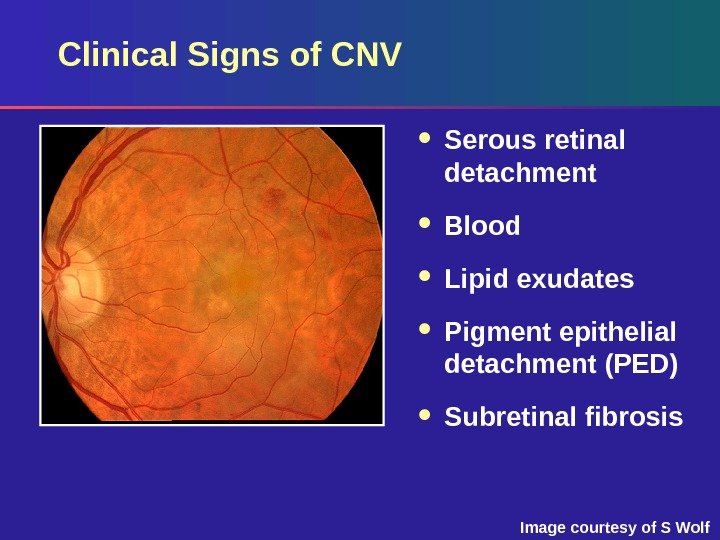
 Image courtesy of S Wolf. Clinical Signs of CNV Serous retinal detachment Blood Lipid exudates Pigment epithelial detachment (PED) Subretinal fibrosis
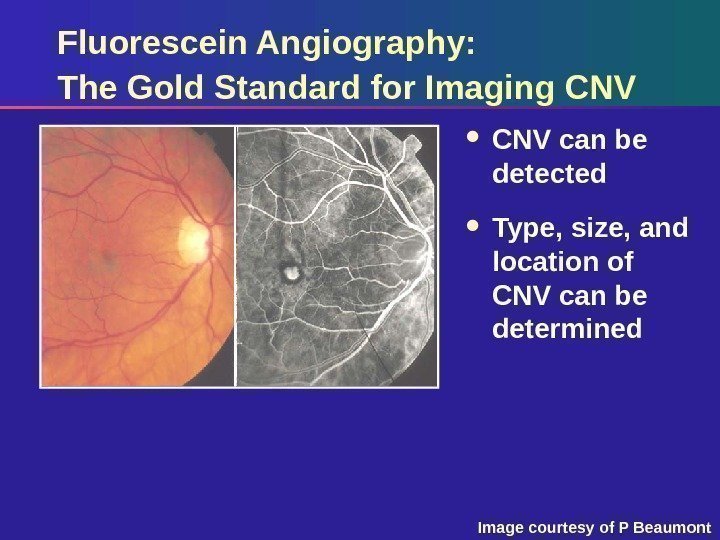
 Fluorescein Angiography: The Gold Standard for Imaging CNV can be detected Type, size, and location of CNV can be determined Image courtesy of P Beaumont
 Terminology to Define a Lesion CNV Thick blood Blocked fluorescence Pigment epithelial detachment. Entire neovascular lesion made up of components including:
 Lesion Classification A lesion can be classified by its: Location Components Size
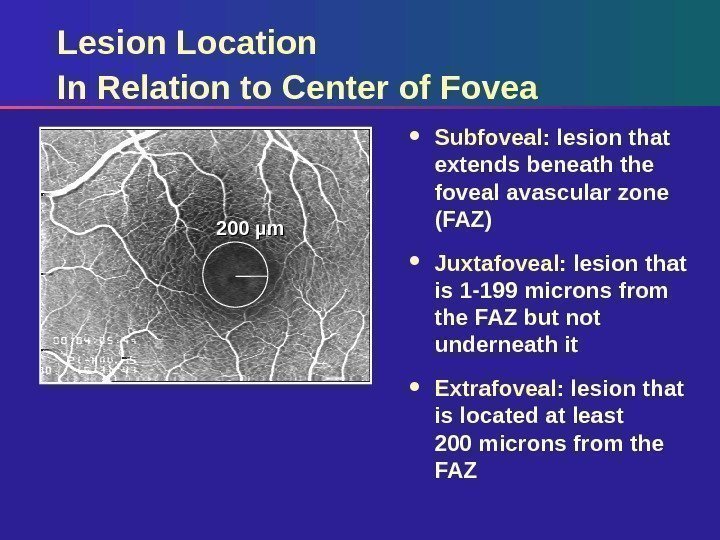
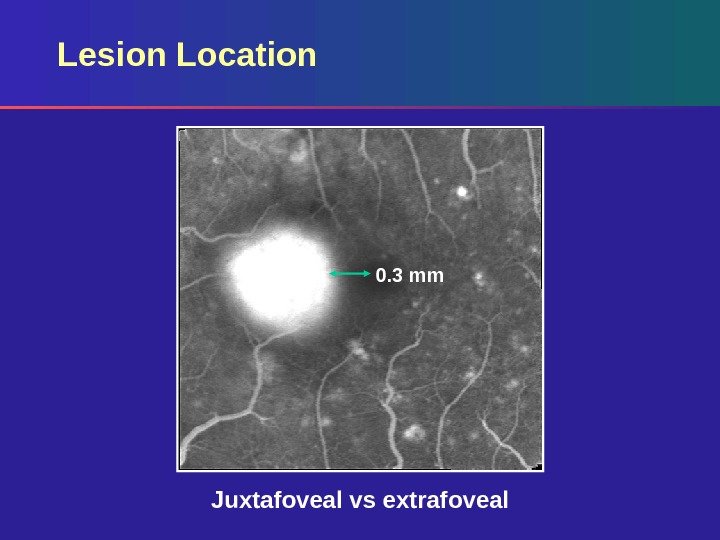
 Lesion Location In Relation to Center of Fovea Subfoveal: lesion that extends beneath the foveal avascular zone (FAZ) Juxtafoveal: lesion that is 1 -199 microns from the FAZ but not underneath it Extrafoveal: lesion that is located at least 200 microns from the FAZ 200 µm
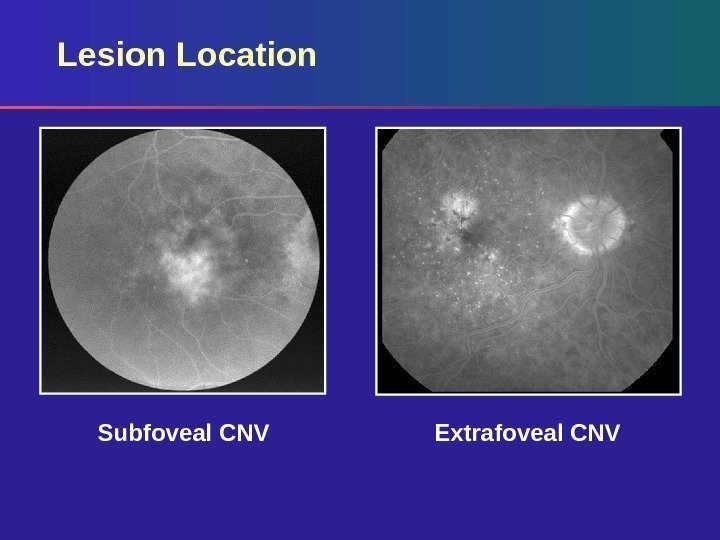
 Lesion Location Extrafoveal CNVSubfoveal CNV
 Lesion Location 0. 3 mm Juxtafoveal vs extrafoveal
 Lesion Composition: Key Features Classic CNV Occult CNV Hemorrhage Blocked fluorescence Pigment epithelial detachment
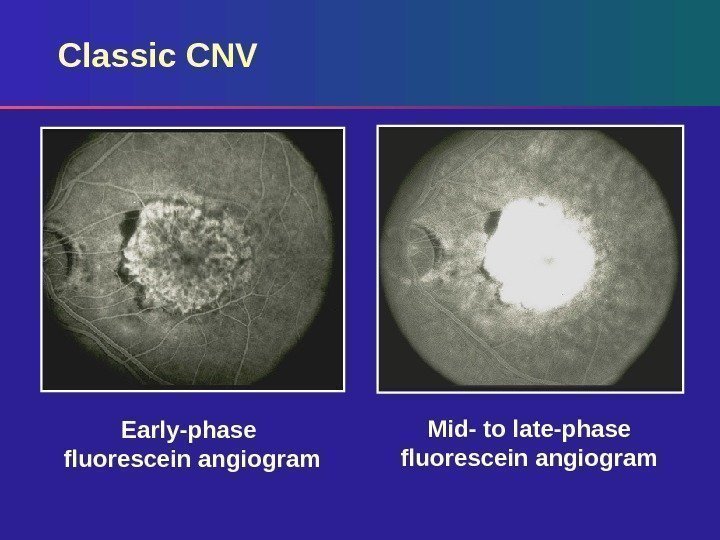
 Lesion Composition: Classic CNV Classic – always well demarcated Surrounding hypofluorescent (dark) rim Vascular patterns – Lacy network – Feeder vessels Appearance in early phase Increase in intensity and extent of dye leakage in late phase
 Classic CNV Early-phase fluorescein angiogram Mid- to late-phase fluorescein angiogram
 Occult CNV Two Types Fibrovascular pigment epithelial detachment (PED) Late leakage of undetermined source. Two patterns on fluorescein angiography were defined in the Macular Photocoagulation Study:
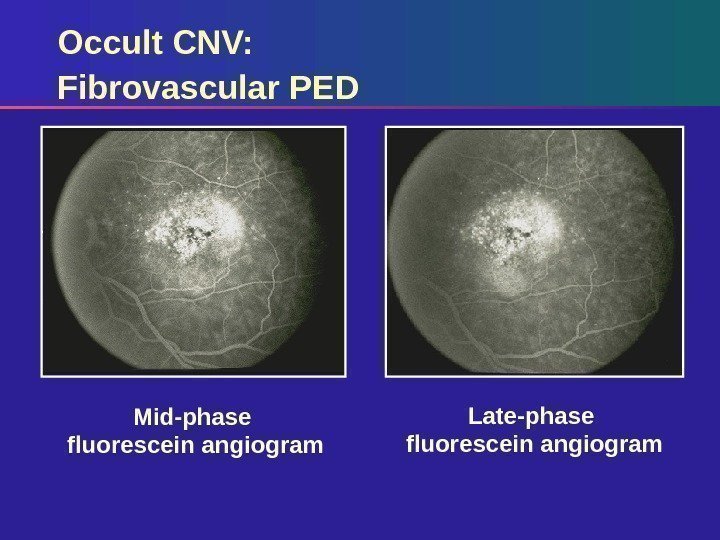
 Occult CNV: Fibrovascular PED Irregular areas of elevated RPE on stereo images – Stippled hyperfluorescence appearing 1– 2 minutes after dye injection Not as discrete or bright as classic Persistence of fluorescein staining or leakage occurs within 10 minutes of dye injection May be well or poorly demarcated
 Mid-phase fluorescein angiogram Late-phase fluorescein angiogram. Occult CNV: Fibrovascular P
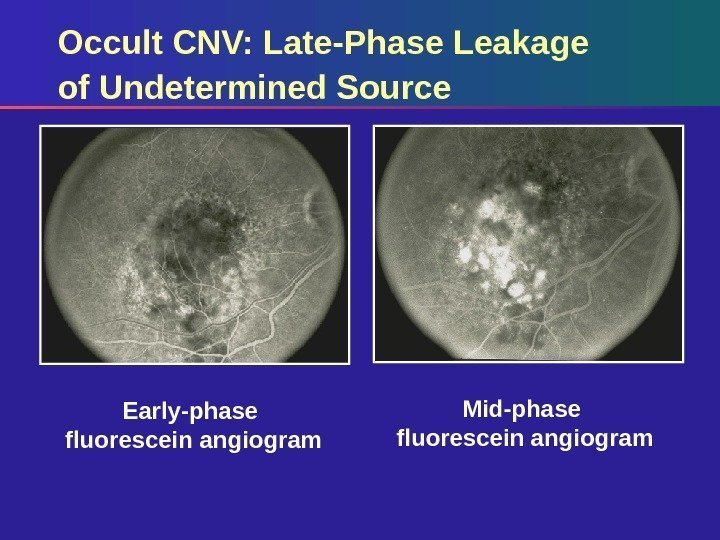
 Occult CNV: Late-Phase Leakage of Undetermined Source Irregular areas of elevated RPE on stereo images Stippled or pinpoint hyperfluorescence at the level of the RPE appearing in the mid-late phase (2– 5 minutes) May be well or poorly demarcated Diffuse ooze
 Early-phase fluorescein angiogram Mid-phase fluorescein angiogram. Occult CNV: Late-Phase Leakage of Undetermined Source
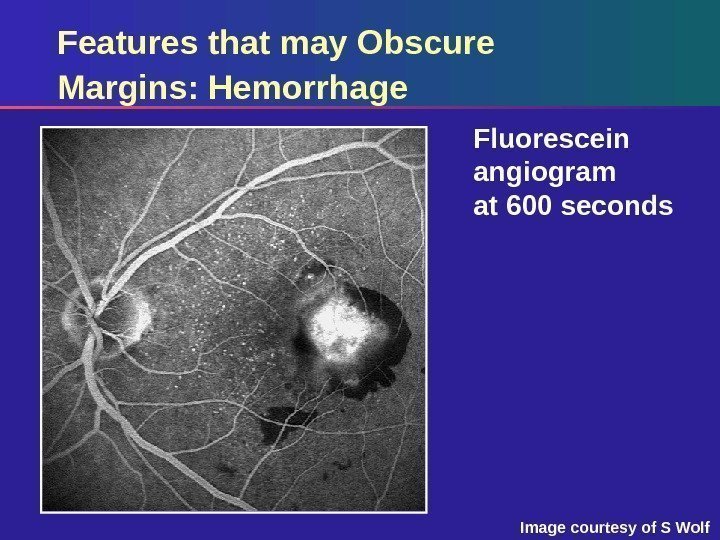
 Lesion Composition: Features That May Obscure CNV Margins Thick hemorrhage Raised blocked fluorescence – hyperplastic pigment – fibrous tissue Serous detachment of RP
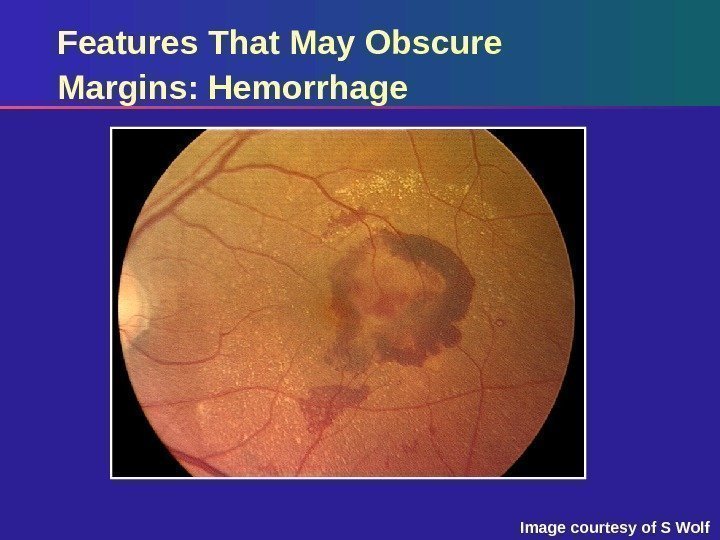
 Features That May Obscure Margins: Hemorrhage Image courtesy of S Wolf
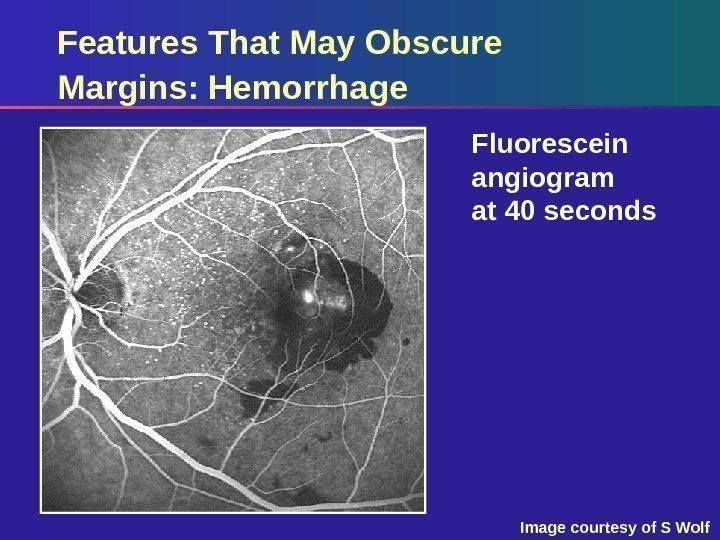
 Features That May Obscure Margins: Hemorrhage Fluorescein angiogram at 40 seconds Image courtesy of S Wolf
 Features that may Obscure Margins: Hemorrhage Fluorescein angiogram at 600 seconds Image courtesy of S Wolf
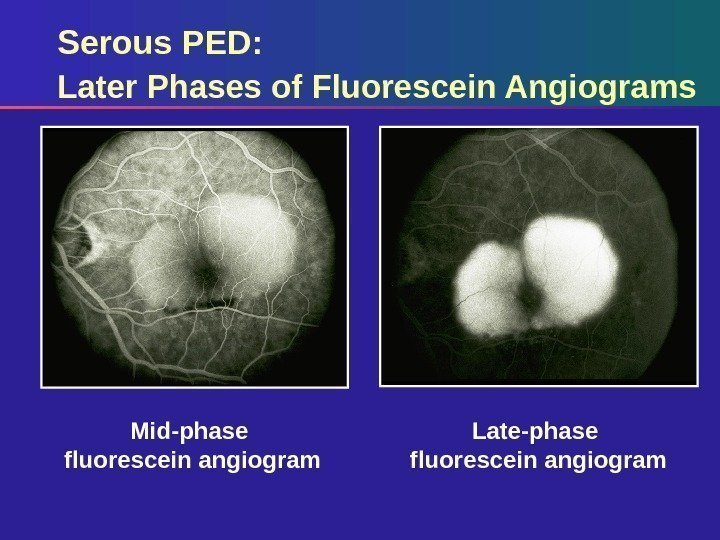
 Serous PED Sharply demarcated, dome-shaped elevation of RPE Brightly hyperfluorescent, fills early and fairly uniformly Increased hyperfluorescence throughout fluorescein angiogram No change in size or shape
 Serous PED: Later Phases of Fluorescein Angiograms Late-phase fluorescein angiogram. Mid-phase fluorescein angiogram
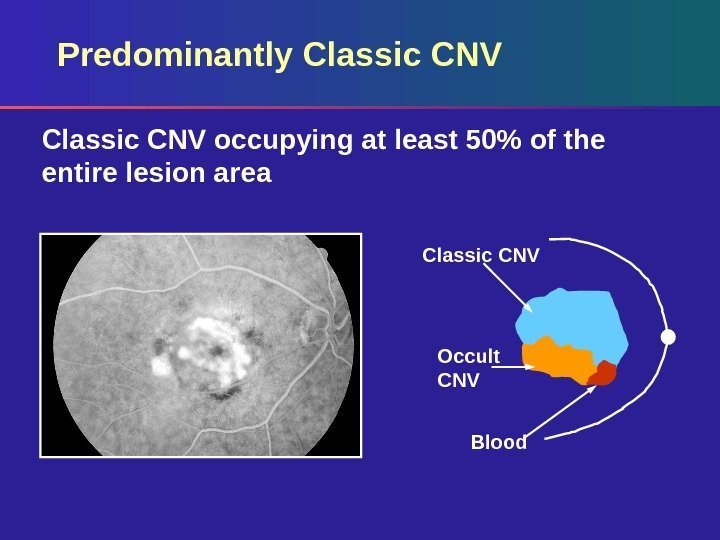
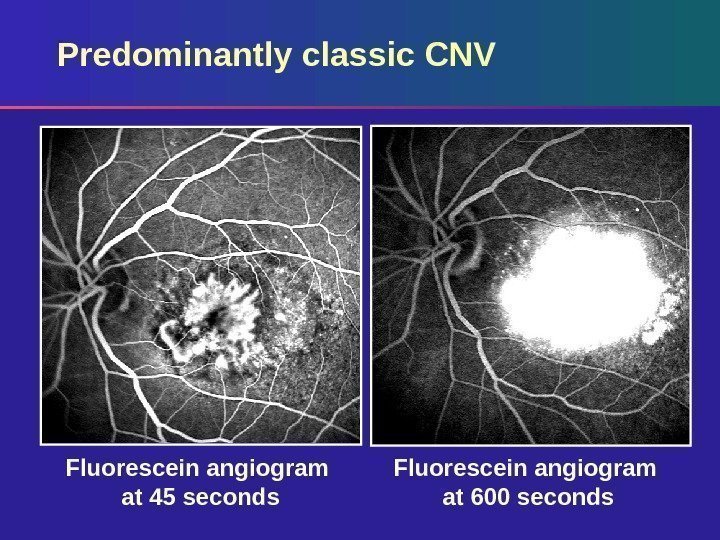
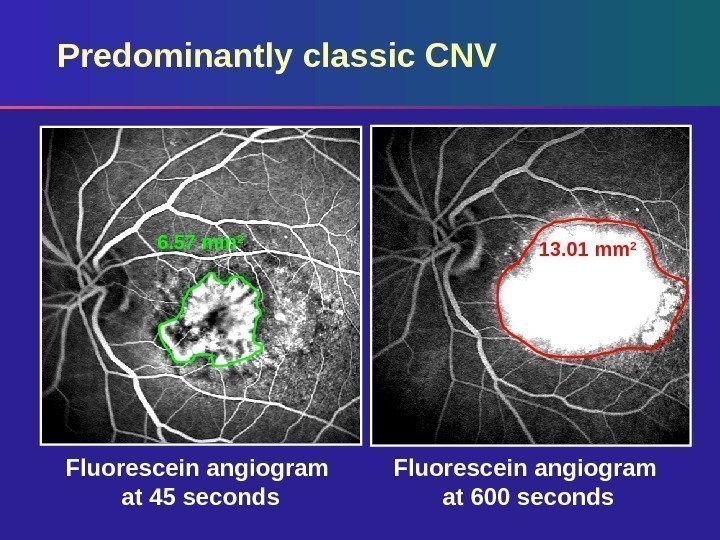
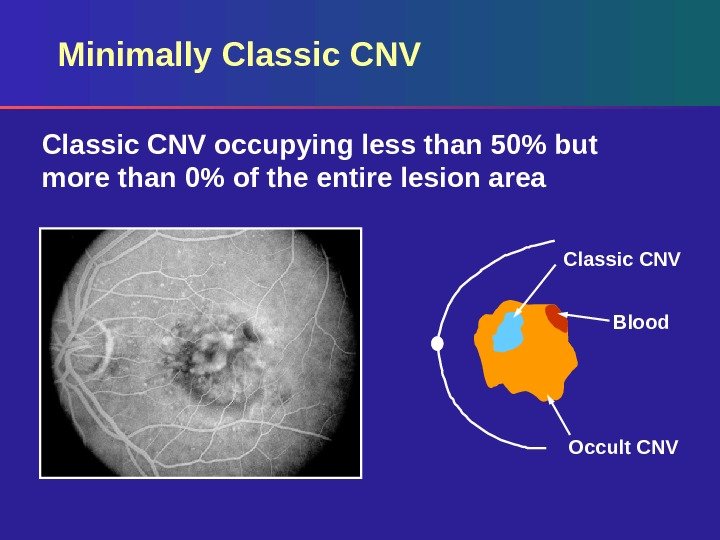
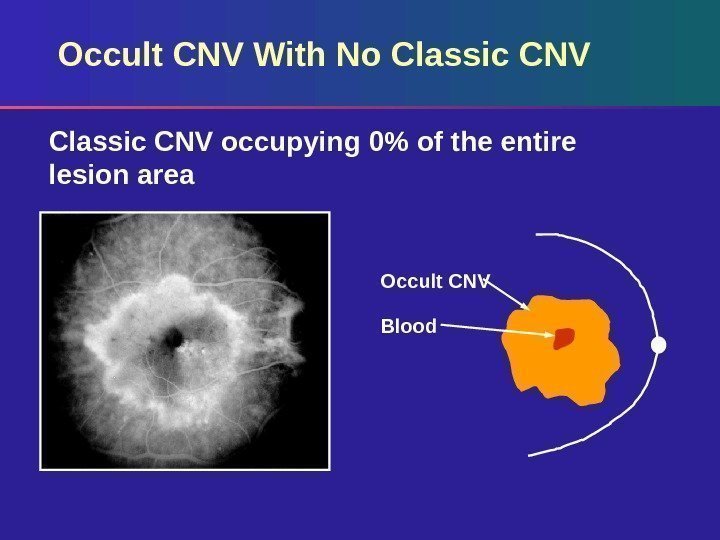
 Determination of Lesion Composition Predominantly classic CNV Minimally classic CNV No classic CNVBased on the TAP Investigation, lesions can be categorized from fluorescein angiograms as:
 Predominantly Classic CNV occupying at least 50% of the entire lesion area Occult CNV Blood. Classic CNV
 Predominantly classic CNV Fluorescein angiogram at 600 seconds. Fluorescein angiogram at 45 seconds
 Fluorescein angiogram at 600 seconds. Fluorescein angiogram at 45 seconds. Predominantly classic CNV 6. 57 mm 2 13. 01 mm
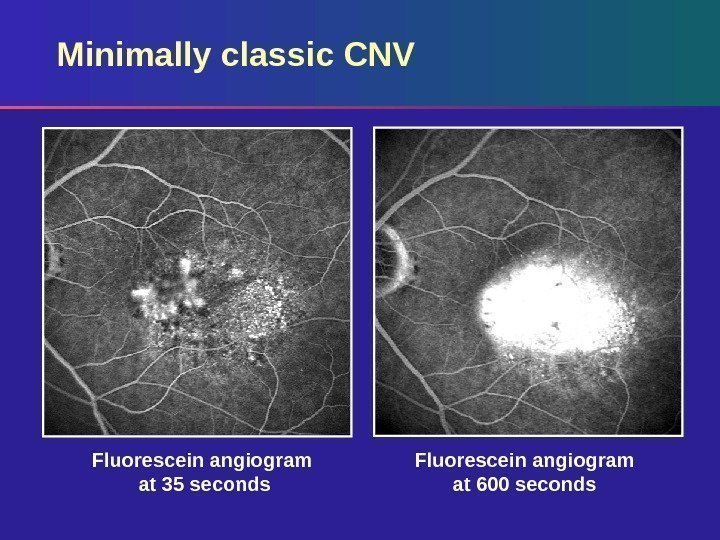
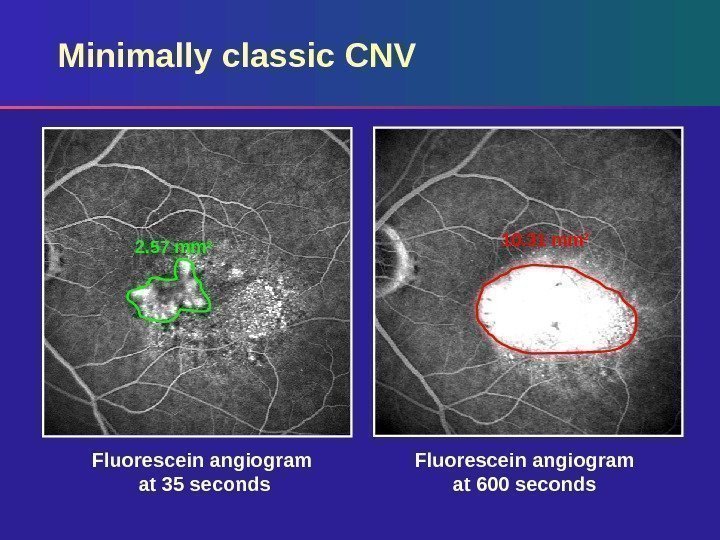
 Minimally Classic CNV occupying less than 50% but more than 0% of the entire lesion area Classic CNV Blood Occult CNV
 Minimally classic CNV Fluorescein angiogram at 600 seconds. Fluorescein angiogram at 35 seconds
 Fluorescein angiogram at 600 seconds. Fluorescein angiogram at 35 seconds. Minimally classic CNV 10. 31 mm 2 2. 57 mm
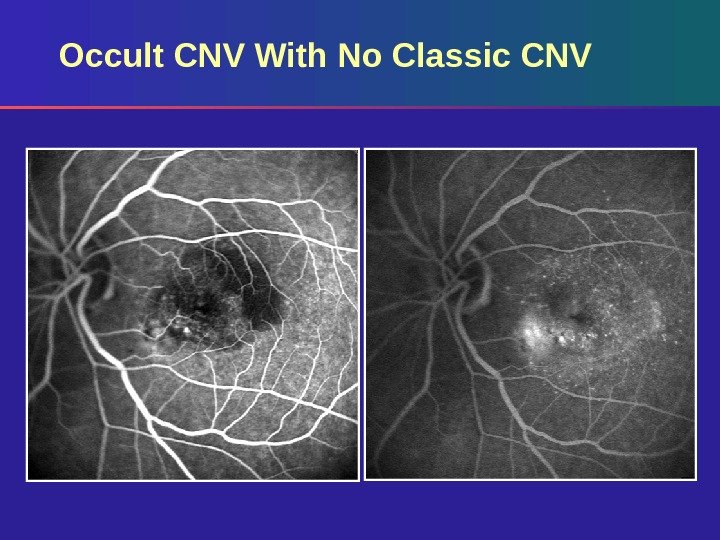
 Occult CNV With No Classic CNV occupying 0% of the entire lesion area Occult CNV Blood
 Occult CNV With No Classic CNV
 Lesion Size Lesion size can be determined as: MPS disc areas (DA) Greatest linear dimension (GLD)
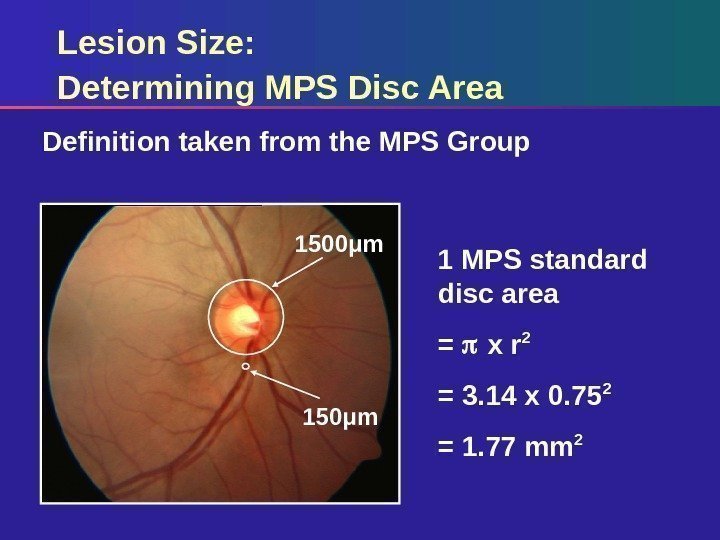
 Lesion Size: Determining MPS Disc Area Definition taken from the MPS Group 1 MPS standard disc area = x r 2 = 3. 14 x 0. 75 2 = 1. 77 mm 21500μm 150μm
 Lesion Size: Determining GLD of Lesion Defining boundaries of choroidal neovascular lesion – Include CNV (classic and occult) and all contiguous lesion components that obscure CNV borders Measure size from early frames Use late frames to confirm presence of occult CNV – Hyperfluorescent areas must remain elevated
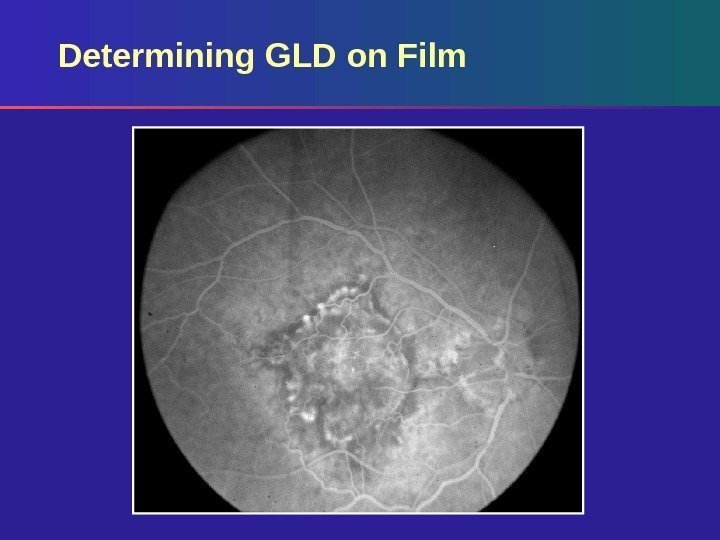
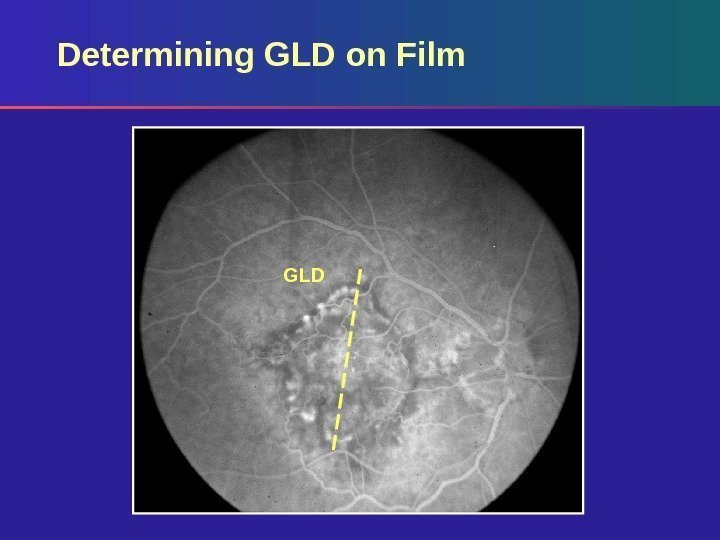
 Determining GLD on Film Based on standard photos – 35° using Topcon – 30° using Zeiss Measure GLD of lesion on angiogram using a reticule Calculate actual GLD on retina by correcting for magnification of the fundus camera (divide by magnification factor)
 Determining GLD on Film
 GLDDetermining GLD on Film
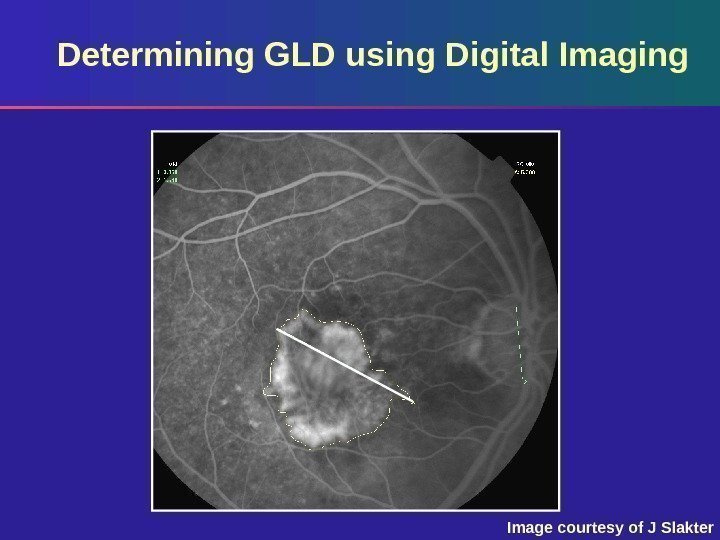
 Determining GLD using Digital Imaging Based on standard photos – 35° using Topcon – 30° using Zeiss Digital tracing software provides most accurate assessment of: – CNV margins – Lesion size – GLD of the CNV
 Determining GLD using Digital Imaging Image courtesy of J Slakter
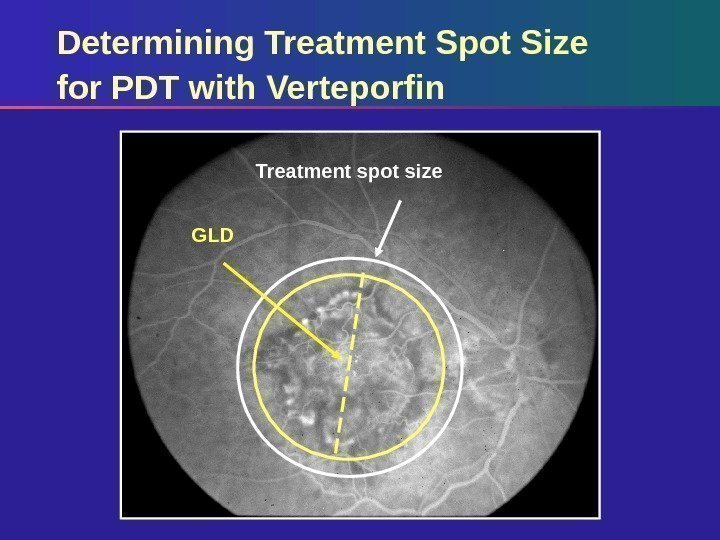
 Determining Treatment Spot Size for PDT with Verteporfin Determine GLD on angiographic image and correct for camera magnification if required Add 1000 µm to allow a 500 µm border around lesion Ensure treatment spot is no closer than 200 µm to edge of optic disc Use the same camera at the same magnification throughout follow-up
 Treatment spot size GLDDetermining Treatment Spot Size for PDT with Verteporfin

