27c778c4c37e707d8e440d10a76dc7ad.ppt
- Количество слайдов: 99
IBM Power Systems System Management Tools Ravi Singh IBM Power Systems rsingh@us. ibm. com 1 © 2009 IBM Corporation
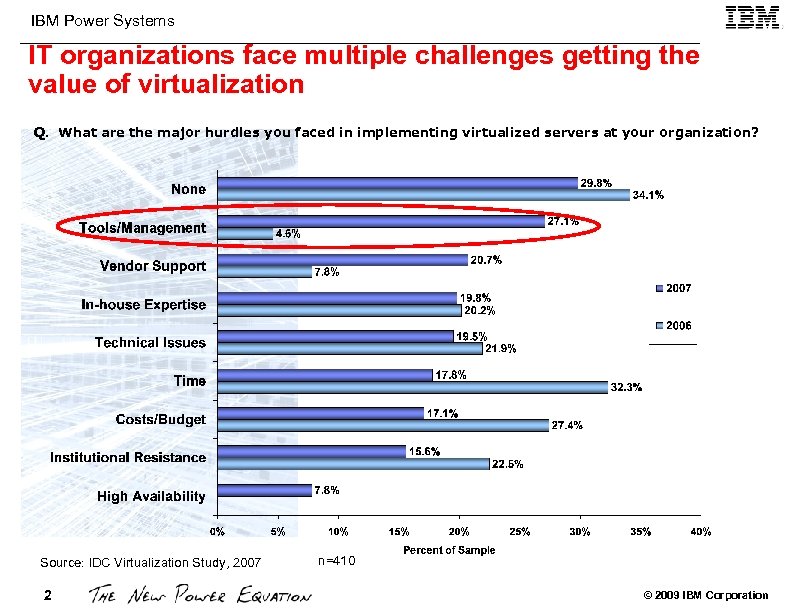
IBM Power Systems IT organizations face multiple challenges getting the value of virtualization Q. What are the major hurdles you faced in implementing virtualized servers at your organization? Source: IDC Virtualization Study, 2007 2 n=410 © 2009 IBM Corporation
IBM Power Systems System Management 1. AIX commands & other tools 2. Free d. W Tools 3. Licensed Tools 3 © 2009 IBM Corporation
IBM Power Systems AIX Commands and other Tools 4 © 2009 IBM Corporation
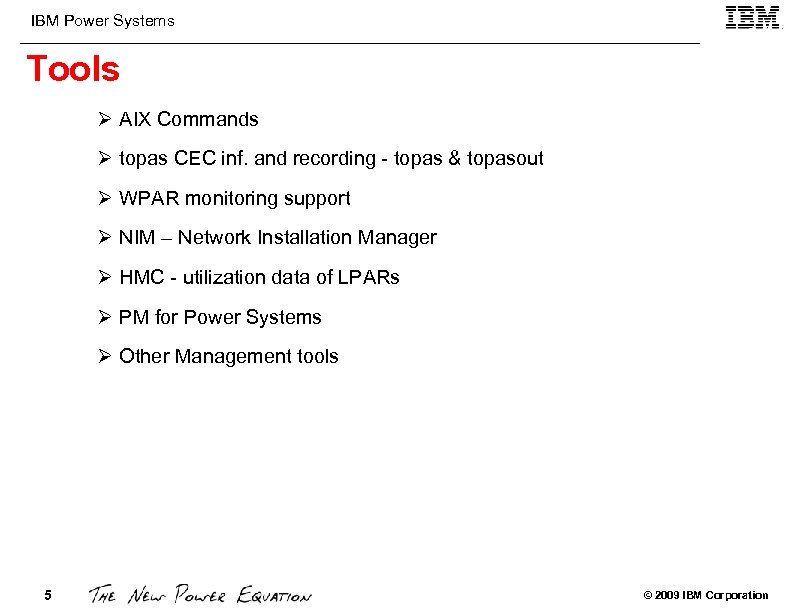
IBM Power Systems Tools Ø AIX Commands Ø topas CEC inf. and recording - topas & topasout Ø WPAR monitoring support Ø NIM – Network Installation Manager Ø HMC - utilization data of LPARs Ø PM for Power Systems Ø Other Management tools 5 © 2009 IBM Corporation
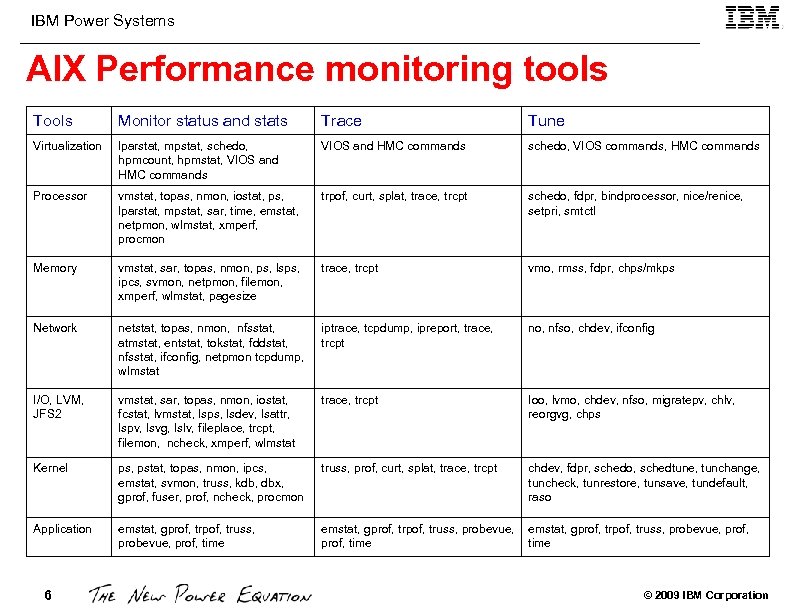
IBM Power Systems AIX Performance monitoring tools Tools Monitor status and stats Trace Tune Virtualization lparstat, mpstat, schedo, hpmcount, hpmstat, VIOS and HMC commands schedo, VIOS commands, HMC commands Processor vmstat, topas, nmon, iostat, ps, lparstat, mpstat, sar, time, emstat, netpmon, wlmstat, xmperf, procmon trpof, curt, splat, trace, trcpt schedo, fdpr, bindprocessor, nice/renice, setpri, smtctl Memory vmstat, sar, topas, nmon, ps, lsps, ipcs, svmon, netpmon, filemon, xmperf, wlmstat, pagesize trace, trcpt vmo, rmss, fdpr, chps/mkps Network netstat, topas, nmon, nfsstat, atmstat, entstat, tokstat, fddstat, nfsstat, ifconfig, netpmon tcpdump, wlmstat iptrace, tcpdump, ipreport, trace, trcpt no, nfso, chdev, ifconfig I/O, LVM, JFS 2 vmstat, sar, topas, nmon, iostat, fcstat, lvmstat, lsps, lsdev, lsattr, lspv, lsvg, lslv, fileplace, trcpt, filemon, ncheck, xmperf, wlmstat trace, trcpt Ioo, lvmo, chdev, nfso, migratepv, chlv, reorgvg, chps Kernel ps, pstat, topas, nmon, ipcs, emstat, svmon, truss, kdb, dbx, gprof, fuser, prof, ncheck, procmon truss, prof, curt, splat, trace, trcpt chdev, fdpr, schedo, schedtune, tunchange, tuncheck, tunrestore, tunsave, tundefault, raso Application emstat, gprof, trpof, truss, probevue, prof, time emstat, gprof, trpof, truss, probevue, prof, time 6 © 2009 IBM Corporation
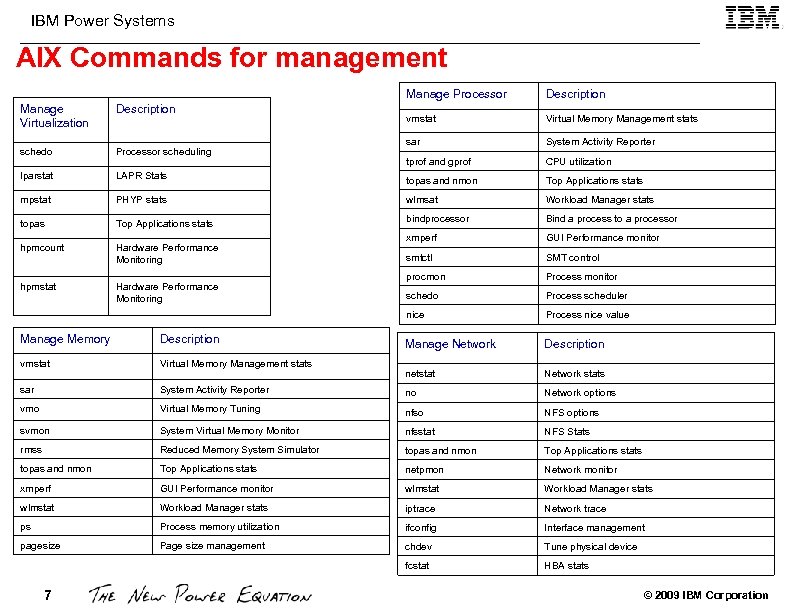
IBM Power Systems AIX Commands for management Manage Processor Description vmstat Virtual Memory Management stats sar System Activity Reporter Manage Virtualization Description schedo Processor scheduling tprof and gprof CPU utilization lparstat LAPR Stats topas and nmon Top Applications stats mpstat PHYP stats wlmsat Workload Manager stats topas Top Applications stats bindprocessor Bind a process to a processor hpmcount Hardware Performance Monitoring xmperf GUI Performance monitor smtctl SMT control hpmstat Hardware Performance Monitoring procmon Process monitor schedo Process scheduler nice Process nice value Manage Network Description netstat Network stats Manage Memory Description vmstat Virtual Memory Management stats sar System Activity Reporter no Network options vmo Virtual Memory Tuning nfso NFS options svmon System Virtual Memory Monitor nfsstat NFS Stats rmss Reduced Memory System Simulator topas and nmon Top Applications stats netpmon Network monitor xmperf GUI Performance monitor wlmstat Workload Manager stats iptrace Network trace ps Process memory utilization ifconfig Interface management pagesize Page size management chdev Tune physical device fcstat HBA stats 7 © 2009 IBM Corporation
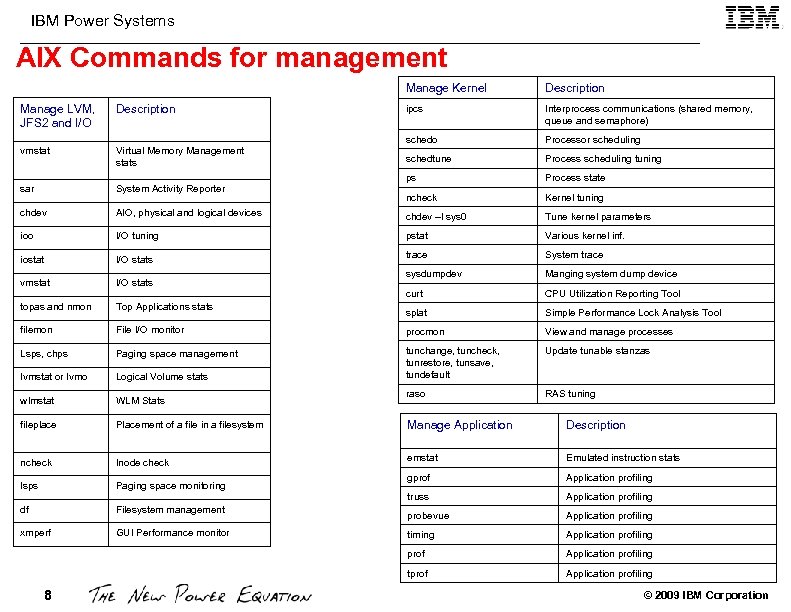
IBM Power Systems AIX Commands for management Manage Kernel Description ipcs Interprocess communications (shared memory, queue and semaphore) schedo Processor scheduling schedtune Process scheduling tuning ps Process state ncheck Kernel tuning Manage LVM, JFS 2 and I/O Description vmstat Virtual Memory Management stats sar System Activity Reporter chdev AIO, physical and logical devices chdev –l sys 0 Tune kernel parameters ioo I/O tuning pstat Various kernel inf. iostat I/O stats trace System trace vmstat I/O stats sysdumpdev Manging system dump device curt CPU Utilization Reporting Tool topas and nmon Top Applications stats splat Simple Performance Lock Analysis Tool filemon File I/O monitor procmon View and manage processes Lsps, chps Paging space management Update tunable stanzas lvmstat or lvmo Logical Volume stats tunchange, tuncheck, tunrestore, tunsave, tundefault wlmstat WLM Stats raso RAS tuning fileplace Placement of a file in a filesystem Manage Application Description ncheck Inode check emstat Emulated instruction stats lsps Paging space monitoring gprof Application profiling truss Application profiling df Filesystem management probevue Application profiling xmperf GUI Performance monitor timing Application profiling prof Application profiling tprof Application profiling 8 © 2009 IBM Corporation
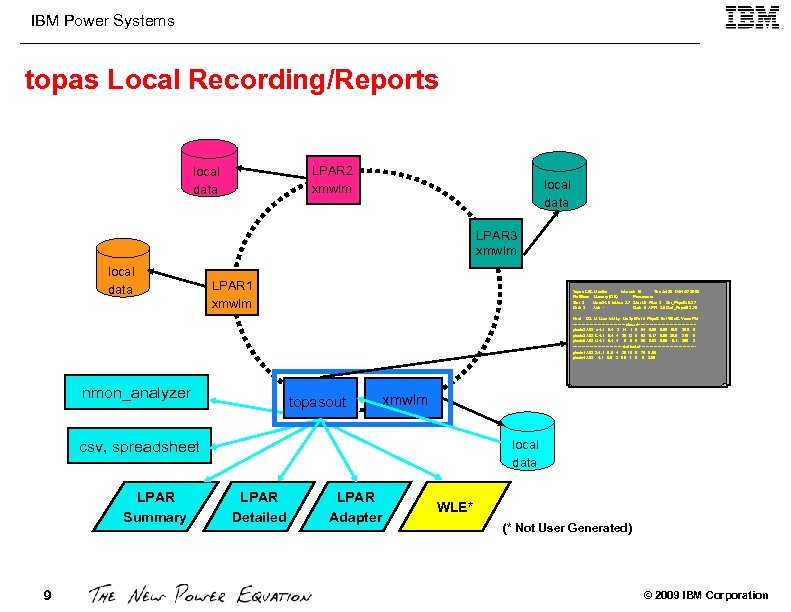
IBM Power Systems topas Local Recording/Reports LPAR 2 xmwlm local data LPAR 3 xmwlm local data LPAR 1 xmwlm Topas CEC Monitor Interval: 10 Thu Jul 28 17: 04: 57 2005 Partitions Memory (GB) Processors Shr: 3 Mon: 24. 6 In. Use: 2. 7 Shr: 1. 5 PSz: 3 Shr_Phys. B: 0. 27 Ded: 3 Avl: - Ded: 5 APP: 2. 6 Ded_Phys. B: 2. 70 Host OS M Mem In. U Lp Us Sy Wa Id Phys. B Ent %Ent. C Vcsw Ph. I --------------------shared----------------------ptools 3 A 53 c 4. 1 0. 4 2 14 1 0 84 0. 08 0. 50 15. 0 208 0 ptools 2 A 53 C 4. 1 0. 4 4 20 13 5 62 0. 17 0. 50 36. 5 219 5 ptools 5 A 53 U 4. 1 0. 4 4 0 0 0 99 0. 02 0. 50 0. 1 205 2 -------------------dedicated---------------------ptools 1 A 53 S 4. 1 0. 5 4 20 10 0 70 0. 60 ptools 4 A 53 4. 1 0. 5 2 99 1 0 0 2. 00 nmon_analyzer topasout xmwlm csv, spreadsheet LPAR Summary 9 local data LPAR Detailed LPAR Adapter WLE* (* Not User Generated) © 2009 IBM Corporation
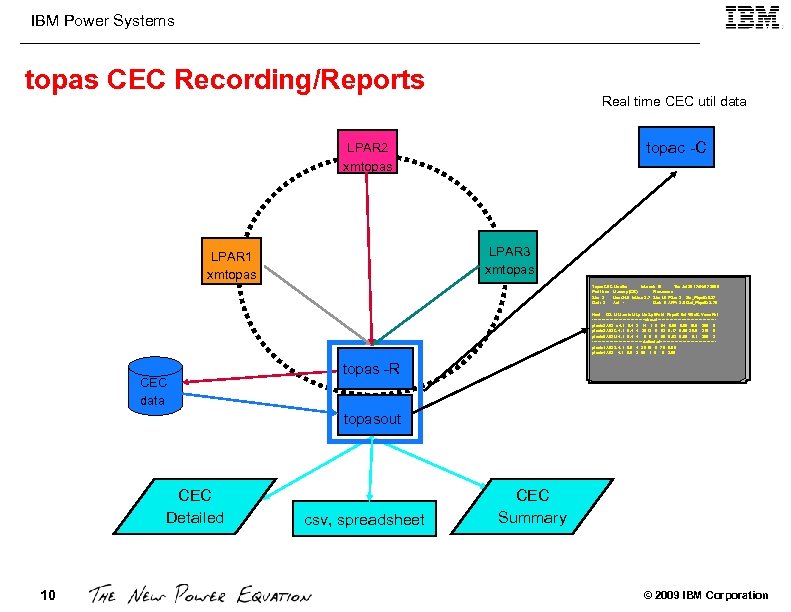
IBM Power Systems topas CEC Recording/Reports Real time CEC util data topac -C LPAR 2 xmtopas LPAR 3 xmtopas LPAR 1 xmtopas Topas CEC Monitor Interval: 10 Thu Jul 28 17: 04: 57 2005 Partitions Memory (GB) Processors Shr: 3 Mon: 24. 6 In. Use: 2. 7 Shr: 1. 5 PSz: 3 Shr_Phys. B: 0. 27 Ded: 3 Avl: - Ded: 5 APP: 2. 6 Ded_Phys. B: 2. 70 Host OS M Mem In. U Lp Us Sy Wa Id Phys. B Ent %Ent. C Vcsw Ph. I --------------------shared----------------------ptools 3 A 53 c 4. 1 0. 4 2 14 1 0 84 0. 08 0. 50 15. 0 208 0 ptools 2 A 53 C 4. 1 0. 4 4 20 13 5 62 0. 17 0. 50 36. 5 219 5 ptools 5 A 53 U 4. 1 0. 4 4 0 0 0 99 0. 02 0. 50 0. 1 205 2 -------------------dedicated---------------------ptools 1 A 53 S 4. 1 0. 5 4 20 10 0 70 0. 60 ptools 4 A 53 4. 1 0. 5 2 99 1 0 0 2. 00 CEC data topas -R topasout CEC Detailed 10 csv, spreadsheet CEC Summary © 2009 IBM Corporation
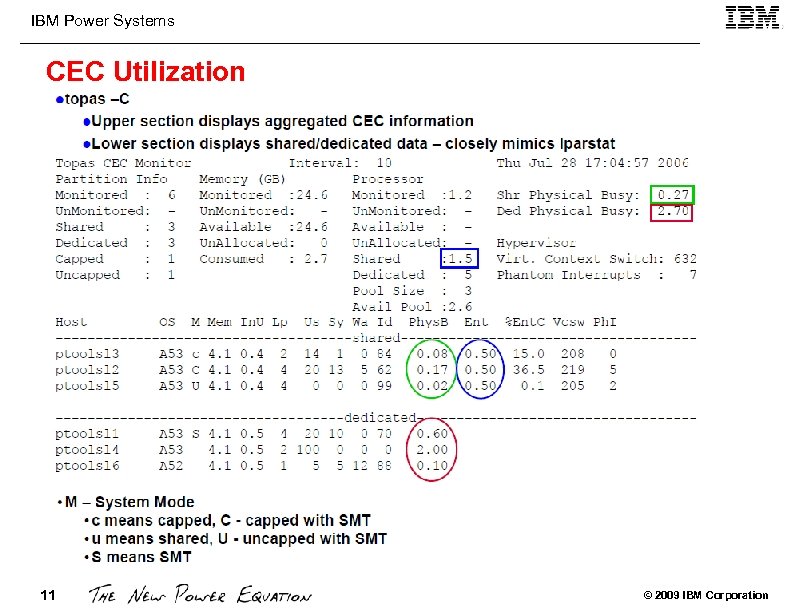
IBM Power Systems CEC Utilization 11 © 2009 IBM Corporation
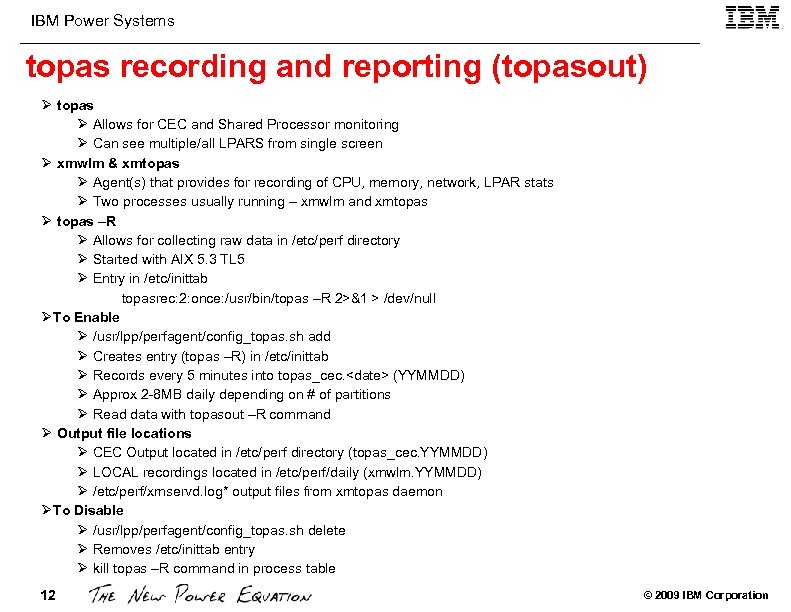
IBM Power Systems topas recording and reporting (topasout) Ø topas Ø Allows for CEC and Shared Processor monitoring Ø Can see multiple/all LPARS from single screen Ø xmwlm & xmtopas Ø Agent(s) that provides for recording of CPU, memory, network, LPAR stats Ø Two processes usually running – xmwlm and xmtopas Ø topas –R Ø Allows for collecting raw data in /etc/perf directory Ø Started with AIX 5. 3 TL 5 Ø Entry in /etc/inittab topasrec: 2: once: /usr/bin/topas –R 2>&1 > /dev/null ØTo Enable Ø /usr/lpp/perfagent/config_topas. sh add Ø Creates entry (topas –R) in /etc/inittab Ø Records every 5 minutes into topas_cec. <date> (YYMMDD) Ø Approx 2 -8 MB daily depending on # of partitions Ø Read data with topasout –R command Ø Output file locations Ø CEC Output located in /etc/perf directory (topas_cec. YYMMDD) Ø LOCAL recordings located in /etc/perf/daily (xmwlm. YYMMDD) Ø /etc/perf/xmservd. log* output files from xmtopas daemon ØTo Disable Ø /usr/lpp/perfagent/config_topas. sh delete Ø Removes /etc/inittab entry Ø kill topas –R command in process table 12 © 2009 IBM Corporation
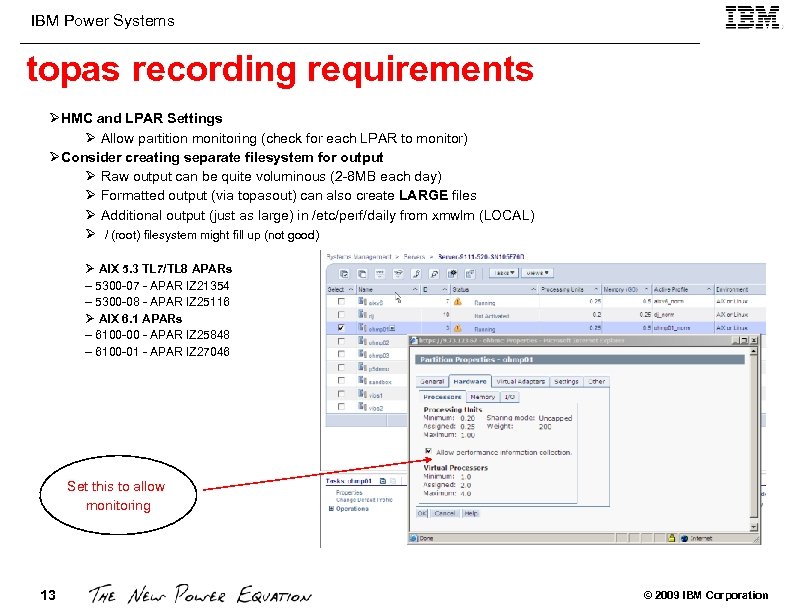
IBM Power Systems topas recording requirements ØHMC and LPAR Settings Ø Allow partition monitoring (check for each LPAR to monitor) ØConsider creating separate filesystem for output Ø Raw output can be quite voluminous (2 -8 MB each day) Ø Formatted output (via topasout) can also create LARGE files Ø Additional output (just as large) in /etc/perf/daily from xmwlm (LOCAL) Ø / (root) filesystem might fill up (not good) Ø AIX 5. 3 TL 7/TL 8 APARs – 5300 -07 - APAR IZ 21354 – 5300 -08 - APAR IZ 25116 Ø AIX 6. 1 APARs – 6100 -00 - APAR IZ 25848 – 6100 -01 - APAR IZ 27046 Set this to allow monitoring 13 © 2009 IBM Corporation
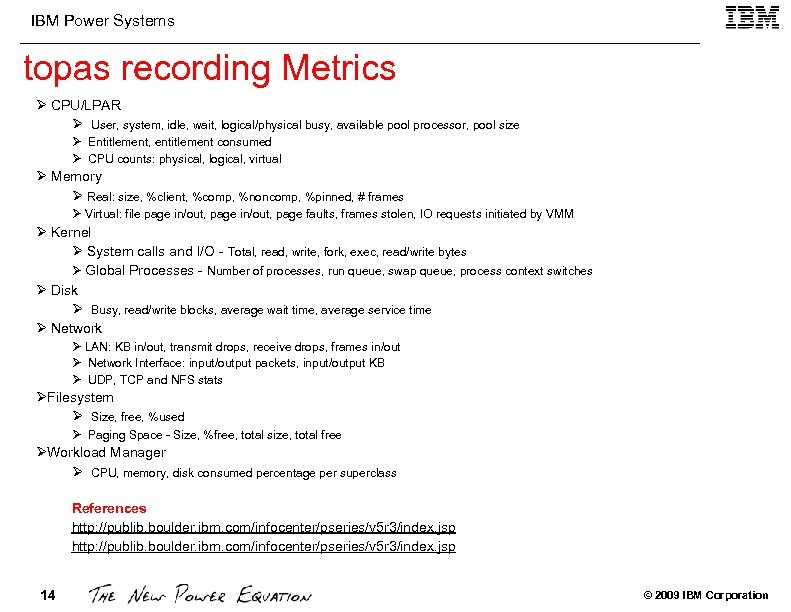
IBM Power Systems topas recording Metrics Ø CPU/LPAR Ø User, system, idle, wait, logical/physical busy, available pool processor, pool size Ø Entitlement, entitlement consumed Ø CPU counts: physical, logical, virtual Ø Memory Ø Real: size, %client, %comp, %noncomp, %pinned, # frames Ø Virtual: file page in/out, page faults, frames stolen, IO requests initiated by VMM Ø Kernel Ø System calls and I/O - Total, read, write, fork, exec, read/write bytes Ø Global Processes - Number of processes, run queue, swap queue, process context switches Ø Disk Ø Busy, read/write blocks, average wait time, average service time Ø Network Ø LAN: KB in/out, transmit drops, receive drops, frames in/out Ø Network Interface: input/output packets, input/output KB Ø UDP, TCP and NFS stats ØFilesystem Ø Size, free, %used Ø Paging Space - Size, %free, total size, total free ØWorkload Manager Ø CPU, memory, disk consumed percentage per superclass References http: //publib. boulder. ibm. com/infocenter/pseries/v 5 r 3/index. jsp 14 © 2009 IBM Corporation
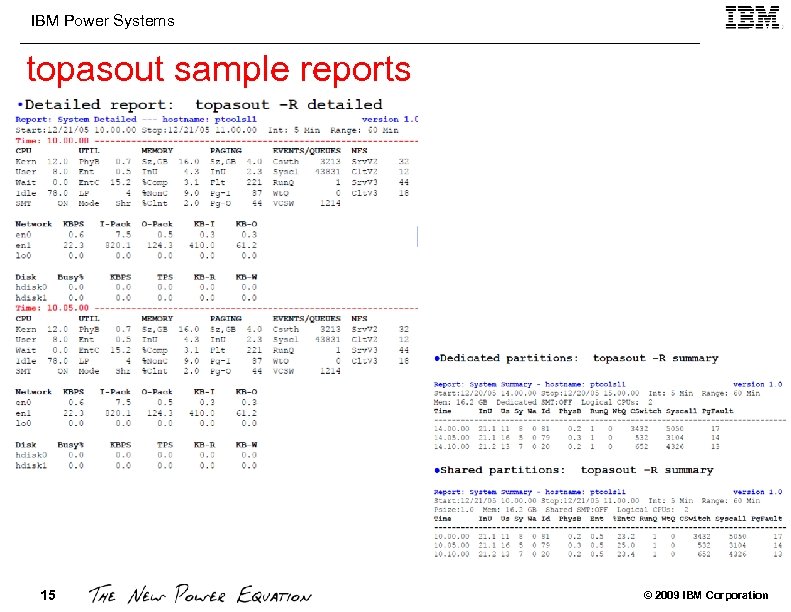
IBM Power Systems topasout sample reports 15 © 2009 IBM Corporation
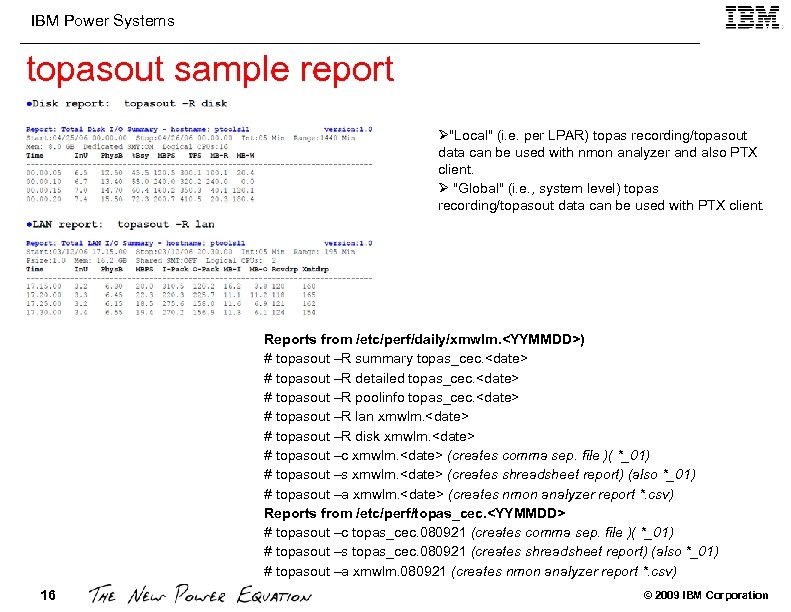
IBM Power Systems topasout sample report Ø"Local" (i. e. per LPAR) topas recording/topasout data can be used with nmon analyzer and also PTX client. Ø "Global" (i. e. , system level) topas recording/topasout data can be used with PTX client. Reports from /etc/perf/daily/xmwlm. <YYMMDD>) # topasout –R summary topas_cec. <date> # topasout –R detailed topas_cec. <date> # topasout –R poolinfo topas_cec. <date> # topasout –R lan xmwlm. <date> # topasout –R disk xmwlm. <date> # topasout –c xmwlm. <date> (creates comma sep. file )( *_01) # topasout –s xmwlm. <date> (creates shreadsheet report) (also *_01) # topasout –a xmwlm. <date> (creates nmon analyzer report *. csv) Reports from /etc/perf/topas_cec. <YYMMDD> # topasout –c topas_cec. 080921 (creates comma sep. file )( *_01) # topasout –s topas_cec. 080921 (creates shreadsheet report) (also *_01) # topasout –a xmwlm. 080921 (creates nmon analyzer report *. csv) 16 © 2009 IBM Corporation
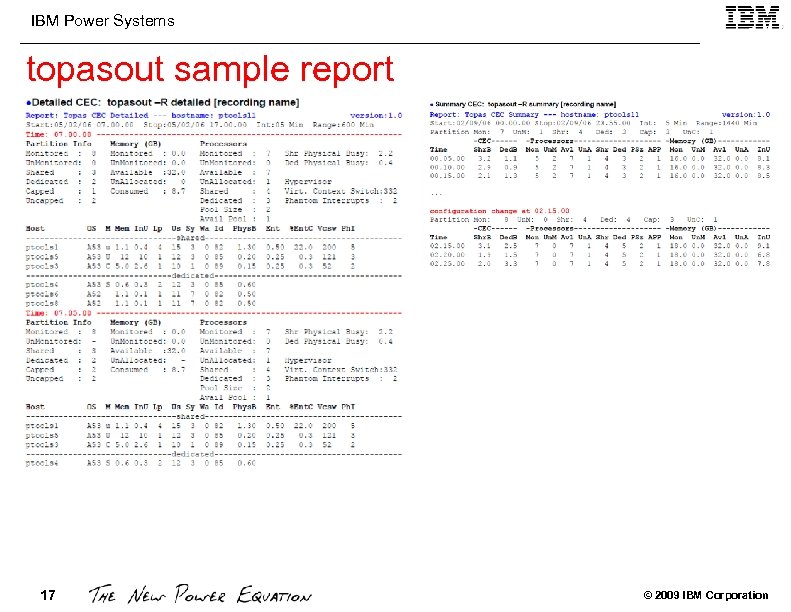
IBM Power Systems topasout sample report 17 © 2009 IBM Corporation
IBM Power Systems 18 © 2009 IBM Corporation
IBM Power Systems 19 © 2009 IBM Corporation
IBM Power Systems 20 © 2009 IBM Corporation
IBM Power Systems NIM for Systems Management Functions Ø Manageability - NIM master stores bootable images, filesets and fixes for installation on the client(s). Ø Central Administration – Installing AIX remotely Ø Scalability – Multiple client installations at the time Ø Usability – CLI or SMIT or Web based GUI Features Ø Installation of AIX, additional software and fixes using network Ø Customization of machines both during and after installation Ø Install or upgrade/migrate OS on alternate disk (cloned rootvg) Ø Maintenance of AIX for upgrade (TL/SP) or migration (Rel/Ver) Ø System recovery Ø Dedicated boot media (CD, DVD) not required for each server/LPAR Ø Supported as a feature in IBM Systems Director Ø SUMA support to update lpp_source with fixes Ø VIOS installation 21 © 2009 IBM Corporation
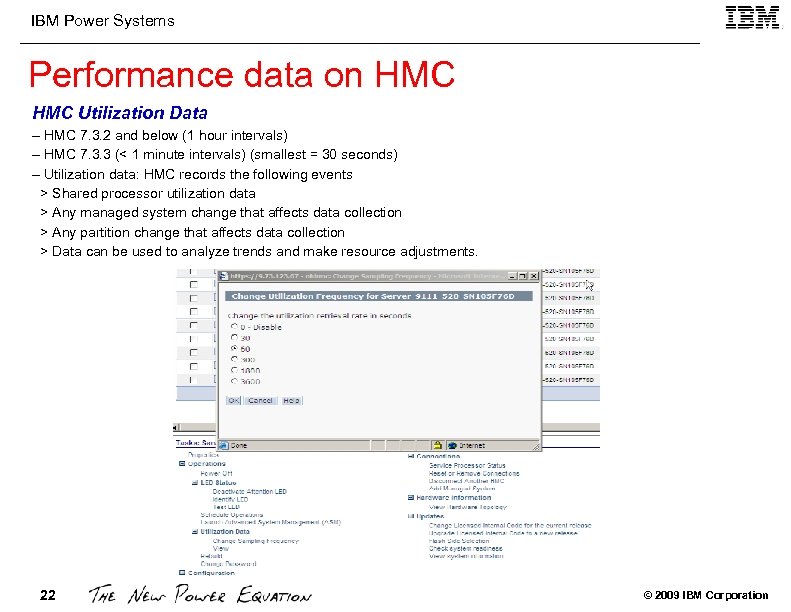
IBM Power Systems Performance data on HMC Utilization Data – HMC 7. 3. 2 and below (1 hour intervals) – HMC 7. 3. 3 (< 1 minute intervals) (smallest = 30 seconds) – Utilization data: HMC records the following events > Shared processor utilization data > Any managed system change that affects data collection > Any partition change that affects data collection > Data can be used to analyze trends and make resource adjustments. 22 © 2009 IBM Corporation
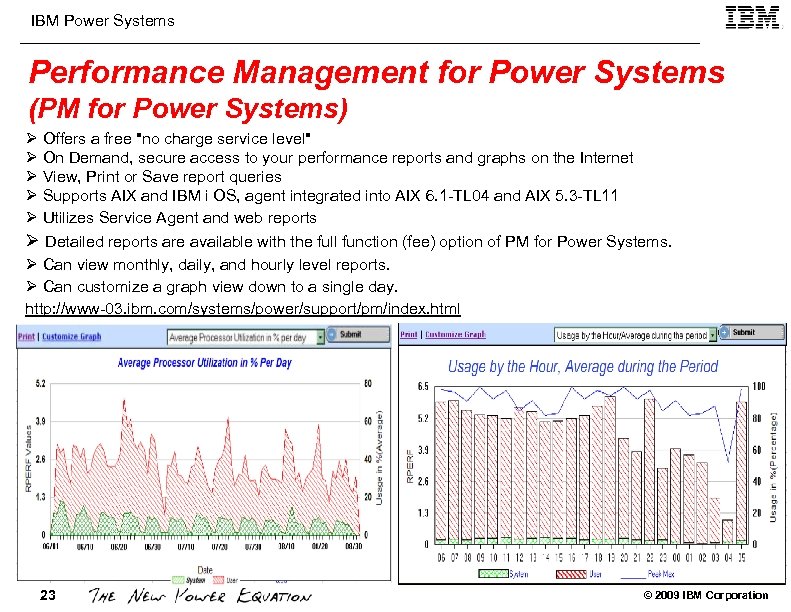
IBM Power Systems Performance Management for Power Systems (PM for Power Systems) Ø Offers a free "no charge service level" Ø On Demand, secure access to your performance reports and graphs on the Internet Ø View, Print or Save report queries Ø Supports AIX and IBM i OS, agent integrated into AIX 6. 1 -TL 04 and AIX 5. 3 -TL 11 Ø Utilizes Service Agent and web reports Ø Detailed reports are available with the full function (fee) option of PM for Power Systems. Ø Can view monthly, daily, and hourly level reports. Ø Can customize a graph view down to a single day. http: //www-03. ibm. com/systems/power/support/pm/index. html 23 © 2009 IBM Corporation
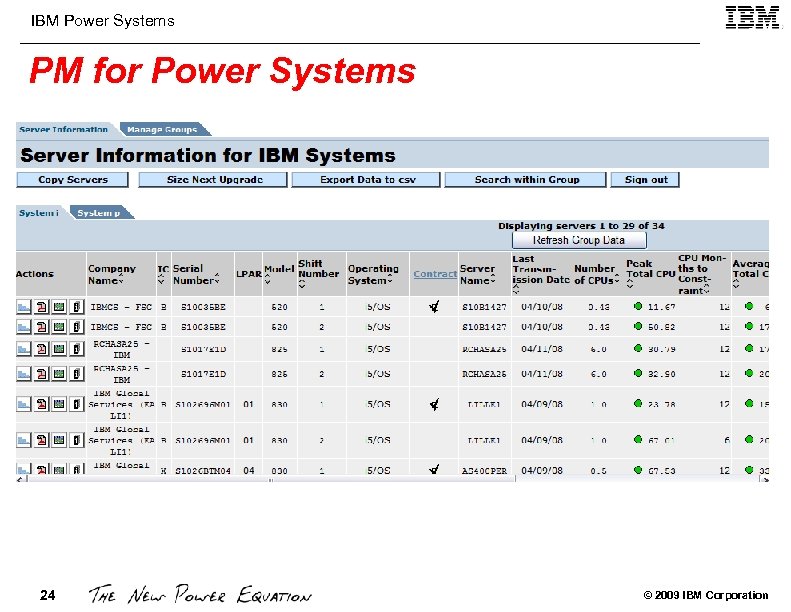
IBM Power Systems PM for Power Systems 24 © 2009 IBM Corporation
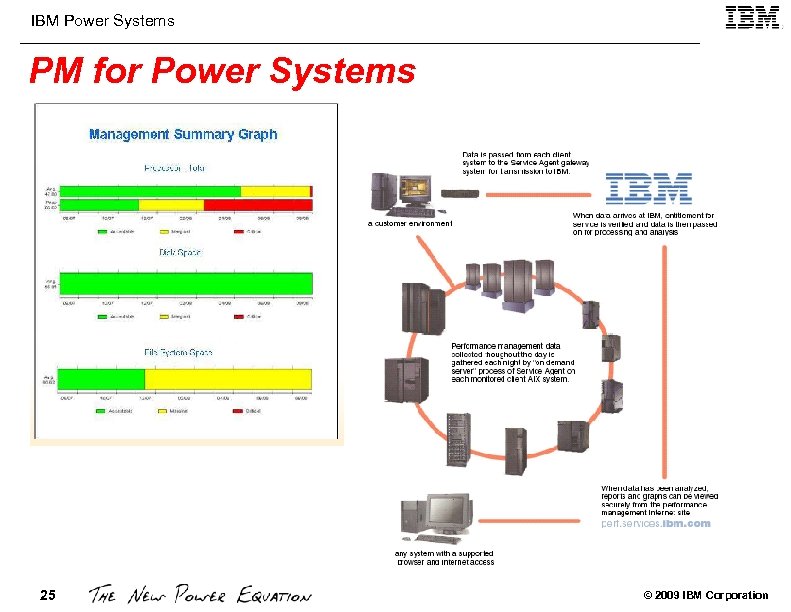
IBM Power Systems PM for Power Systems 25 © 2009 IBM Corporation
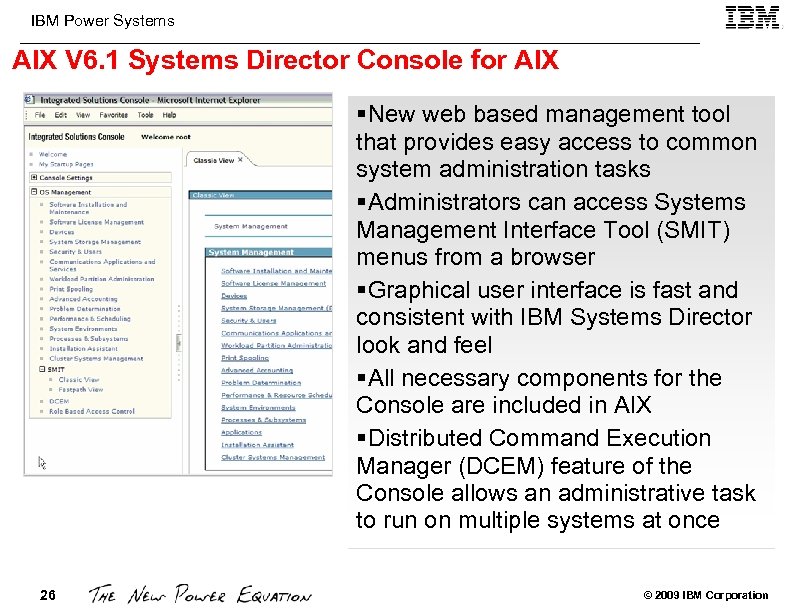
IBM Power Systems AIX V 6. 1 Systems Director Console for AIX §New web based management tool that provides easy access to common system administration tasks §Administrators can access Systems Management Interface Tool (SMIT) menus from a browser §Graphical user interface is fast and consistent with IBM Systems Director look and feel §All necessary components for the Console are included in AIX §Distributed Command Execution Manager (DCEM) feature of the Console allows an administrative task to run on multiple systems at once 26 © 2009 IBM Corporation
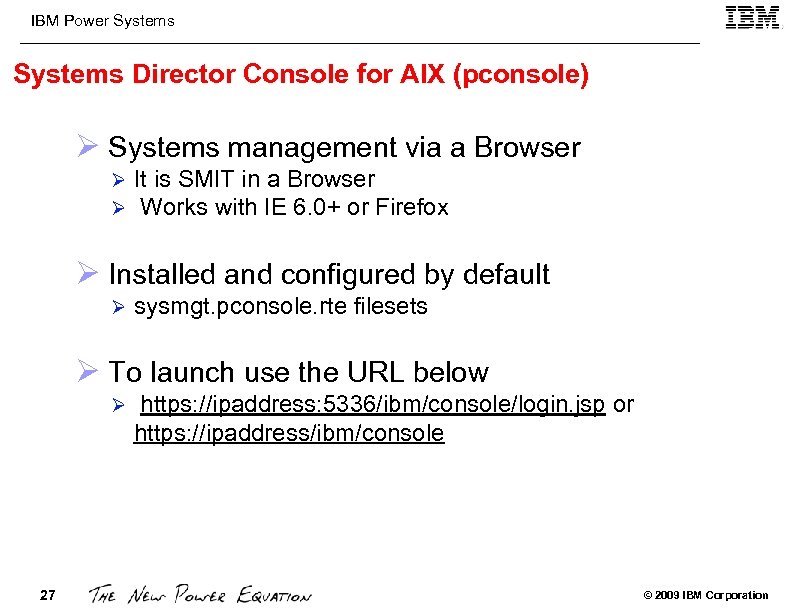
IBM Power Systems Director Console for AIX (pconsole) Ø Systems management via a Browser Ø Ø It is SMIT in a Browser Works with IE 6. 0+ or Firefox Ø Installed and configured by default Ø sysmgt. pconsole. rte filesets Ø To launch use the URL below Ø https: //ipaddress: 5336/ibm/console/login. jsp or https: //ipaddress/ibm/console REFERENCE: Section 5. 7 / AIX 6. 1 Differences Redbook, SG 24 -7559 http: //www. redbooks. ibm. com/abstracts/sg 247559. html? Open 27 © 2009 IBM Corporation
IBM Power Systems Other Management tools Compare_report Ø The AIX compare_report command compares the filesets installed on a system to the contents of a fileset image repository or to a list of available updates that may be downloaded from Fix Central. Ø It produces reports that simplify the process of determining the fixes to install to bring a system to the latest maintenance level or the latest level. Reports that are created using the list of available updates can be uploaded directly to Fix Central to request the exact fixes needed for the system. IBM Electronic Service Tools Electronic Service Agent™: is a no charge client that resides on Customer systems and automatically reports problems to IBM. The client also transmits inventory information to IBM upon installation and as inventory changes. Automatically and electronically sends error information to IBM to aid in problem resolution. Designed to be flexible and proactive: 4 automatically detects and submits hardware problems to IBM support 4 secure transmission via internet 4 clients available for all IBM Systems (x, i, p, z, including HMC, plus DS 8000) 4 communicates securely through gateways to provide customers a single point of exit from the customer site 4 customizable by customer IBM Support Center: analyzes problem details and inventory information and creates an action plan. If an onsite service call is required, the engineer will arrive with the necessary parts to quickly resolve the issue. Customer: Using the IBM ID entered during activation, customers can view system information in the secure “My Systems” category of the Electronic Services website at https: //www-304. ibm. com/support/electronic/portal 28 © 2009 IBM Corporation
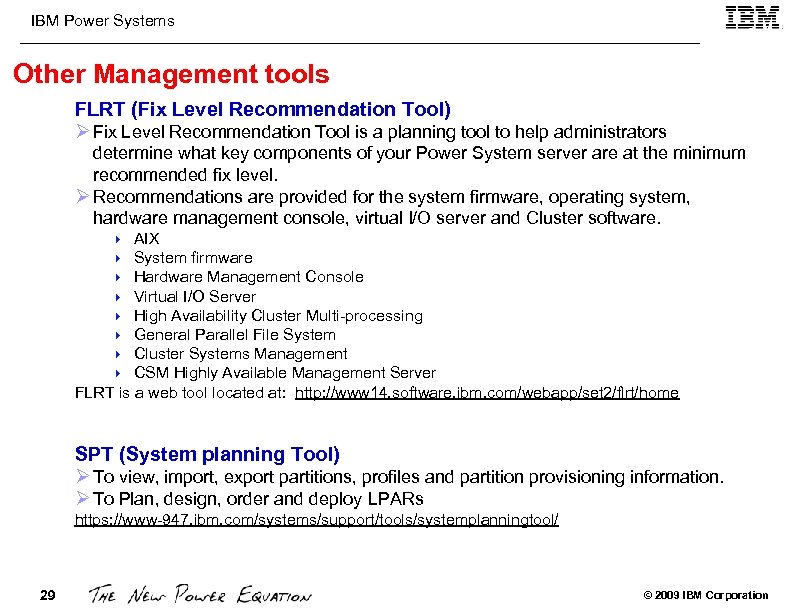
IBM Power Systems Other Management tools FLRT (Fix Level Recommendation Tool) Ø Fix Level Recommendation Tool is a planning tool to help administrators determine what key components of your Power System server are at the minimum recommended fix level. Ø Recommendations are provided for the system firmware, operating system, hardware management console, virtual I/O server and Cluster software. AIX System firmware Hardware Management Console Virtual I/O Server High Availability Cluster Multi-processing General Parallel File System Cluster Systems Management CSM Highly Available Management Server FLRT is a web tool located at: http: //www 14. software. ibm. com/webapp/set 2/flrt/home 4 4 4 4 SPT (System planning Tool) Ø To view, import, export partitions, profiles and partition provisioning information. Ø To Plan, design, order and deploy LPARs https: //www-947. ibm. com/systems/support/tools/systemplanningtool/ 29 © 2009 IBM Corporation
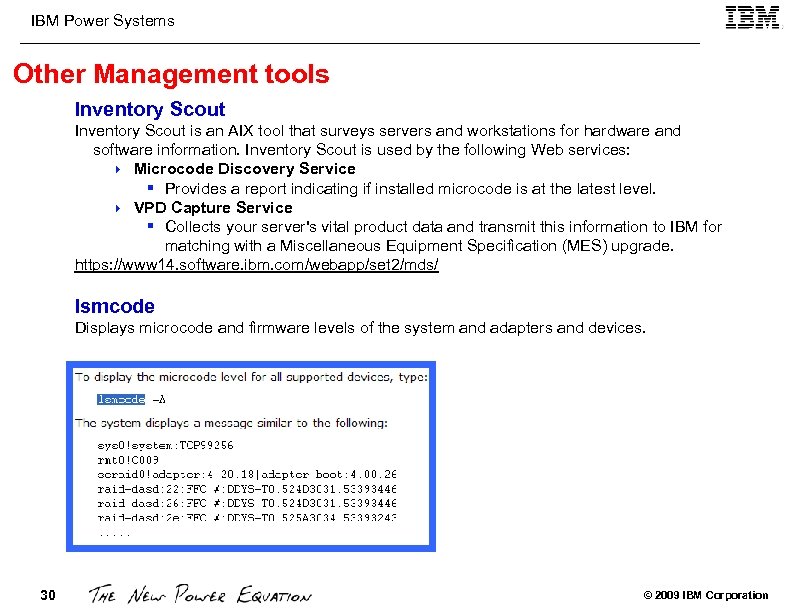
IBM Power Systems Other Management tools Inventory Scout is an AIX tool that surveys servers and workstations for hardware and software information. Inventory Scout is used by the following Web services: 4 Microcode Discovery Service § Provides a report indicating if installed microcode is at the latest level. 4 VPD Capture Service § Collects your server's vital product data and transmit this information to IBM for matching with a Miscellaneous Equipment Specification (MES) upgrade. https: //www 14. software. ibm. com/webapp/set 2/mds/ lsmcode Displays microcode and firmware levels of the system and adapters and devices. 30 © 2009 IBM Corporation
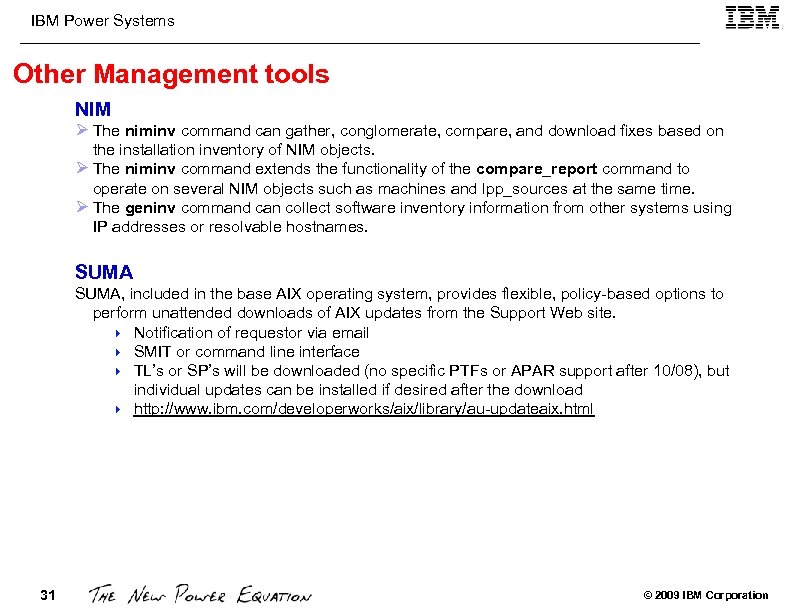
IBM Power Systems Other Management tools NIM Ø The niminv command can gather, conglomerate, compare, and download fixes based on the installation inventory of NIM objects. Ø The niminv command extends the functionality of the compare_report command to operate on several NIM objects such as machines and lpp_sources at the same time. Ø The geninv command can collect software inventory information from other systems using IP addresses or resolvable hostnames. SUMA, included in the base AIX operating system, provides flexible, policy-based options to perform unattended downloads of AIX updates from the Support Web site. 4 Notification of requestor via email 4 SMIT or command line interface 4 TL’s or SP’s will be downloaded (no specific PTFs or APAR support after 10/08), but individual updates can be installed if desired after the download 4 http: //www. ibm. com/developerworks/aix/library/au-updateaix. html 31 © 2009 IBM Corporation
IBM Power Systems developer. Works Tools 32 © 2009 IBM Corporation
IBM Power Systems developer. Works AIX and UNIX Information Mgmt http: //www. ibm. com/developerworks/ Lotus Rational Tivoli Web. Sphere IBM's premier technical resource for software developers and IT professionals for a wide range of tools, code, and education on AIX and UNIX®, Information Management, Lotus®, Rational®, and Web. Sphere®, as well as on open standards technology such as Java™ technologies, Linux®, XML, and more. Java™ technology Linux Open source SOA and Web services Web development XML My developer. Works About d. W Submit content Feedback Build your own My developer. Works @ https: //www. ibm. com/developerworks/mydeveloperworks 33 © 2009 IBM Corporation
IBM Power Systems Tools Ø nmon and nmon consolidator Ø p. Graph Ø lpar 2 rrd Ø Gmon Ø LPARmon Ø Ganglia 34 © 2009 IBM Corporation
IBM Power Systems nmon and nmon consolidator nmon Ø Integrated into AIX with topas command Ø topas -C gives CEC utilization Ø Both nmon and topas include hooks for WPAR monitoring nmon consolidator Ø Can take individual (LPAR) nmon data files and graph them for a global view Ø Graph many older machines and plan the server consolidation on to LPARs http: //www-941. ibm. com/collaboration/wiki/display/Wiki. Ptype/nmonconsolidator 35 © 2009 IBM Corporation
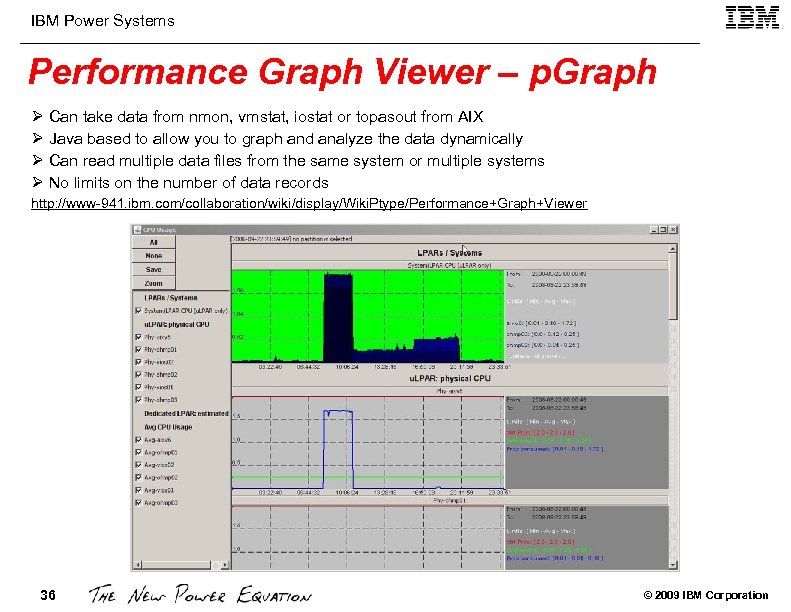
IBM Power Systems Performance Graph Viewer – p. Graph Ø Can take data from nmon, vmstat, iostat or topasout from AIX Ø Java based to allow you to graph and analyze the data dynamically Ø Can read multiple data files from the same system or multiple systems Ø No limits on the number of data records http: //www-941. ibm. com/collaboration/wiki/display/Wiki. Ptype/Performance+Graph+Viewer 36 © 2009 IBM Corporation
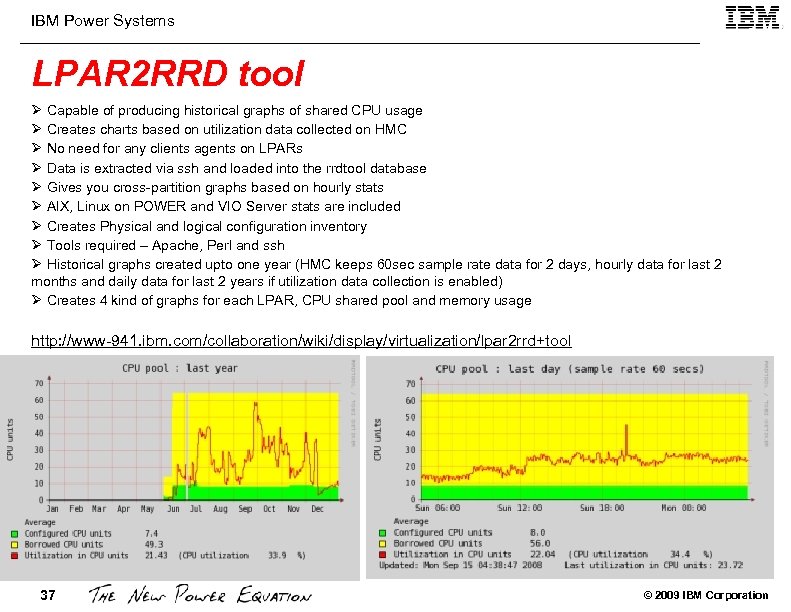
IBM Power Systems LPAR 2 RRD tool Ø Capable of producing historical graphs of shared CPU usage Ø Creates charts based on utilization data collected on HMC Ø No need for any clients agents on LPARs Ø Data is extracted via ssh and loaded into the rrdtool database Ø Gives you cross-partition graphs based on hourly stats Ø AIX, Linux on POWER and VIO Server stats are included Ø Creates Physical and logical configuration inventory Ø Tools required – Apache, Perl and ssh Ø Historical graphs created upto one year (HMC keeps 60 sec sample rate data for 2 days, hourly data for last 2 months and daily data for last 2 years if utilization data collection is enabled) Ø Creates 4 kind of graphs for each LPAR, CPU shared pool and memory usage http: //www-941. ibm. com/collaboration/wiki/display/virtualization/lpar 2 rrd+tool 37 © 2009 IBM Corporation
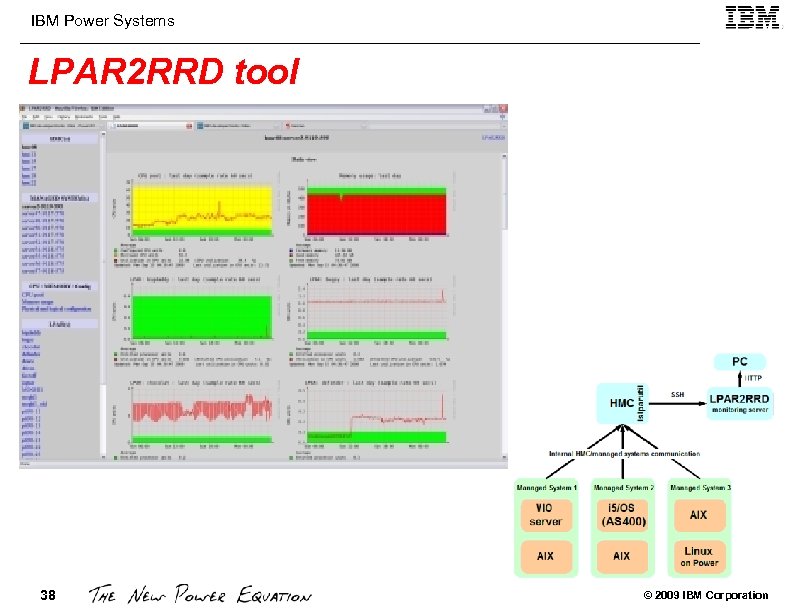
IBM Power Systems LPAR 2 RRD tool 38 © 2009 IBM Corporation
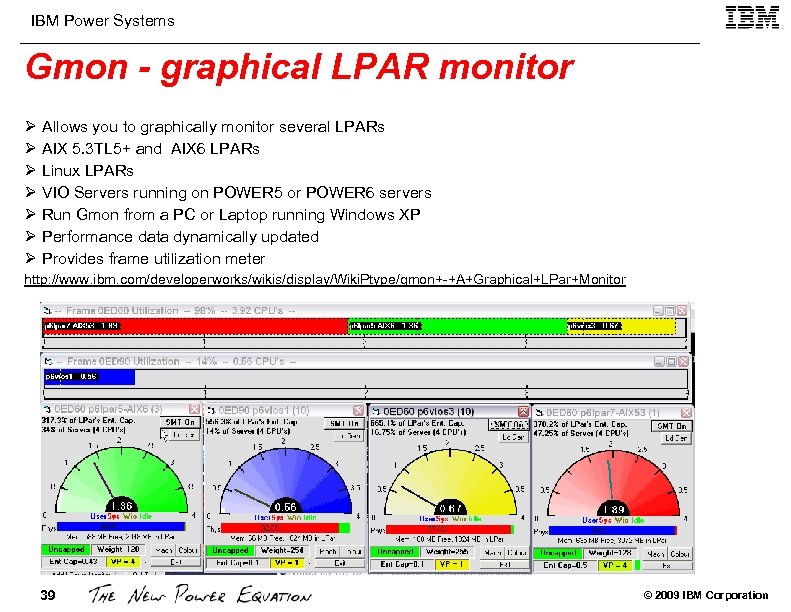
IBM Power Systems Gmon - graphical LPAR monitor Ø Allows you to graphically monitor several LPARs Ø AIX 5. 3 TL 5+ and AIX 6 LPARs Ø Linux LPARs Ø VIO Servers running on POWER 5 or POWER 6 servers Ø Run Gmon from a PC or Laptop running Windows XP Ø Performance data dynamically updated Ø Provides frame utilization meter http: //www. ibm. com/developerworks/wikis/display/Wiki. Ptype/gmon+-+A+Graphical+LPar+Monitor 39 © 2009 IBM Corporation
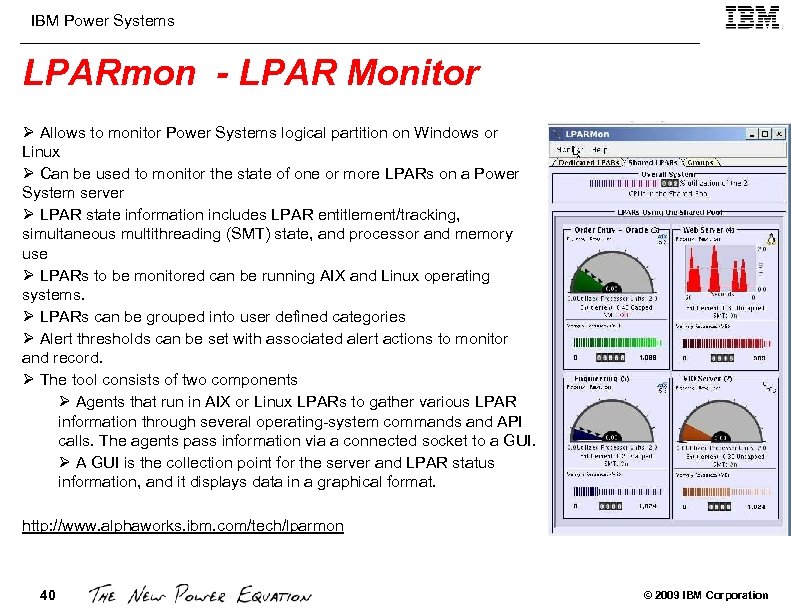
IBM Power Systems LPARmon - LPAR Monitor Ø Allows to monitor Power Systems logical partition on Windows or Linux Ø Can be used to monitor the state of one or more LPARs on a Power System server Ø LPAR state information includes LPAR entitlement/tracking, simultaneous multithreading (SMT) state, and processor and memory use Ø LPARs to be monitored can be running AIX and Linux operating systems. Ø LPARs can be grouped into user defined categories Ø Alert thresholds can be set with associated alert actions to monitor and record. Ø The tool consists of two components Ø Agents that run in AIX or Linux LPARs to gather various LPAR information through several operating-system commands and API calls. The agents pass information via a connected socket to a GUI. Ø A GUI is the collection point for the server and LPAR status information, and it displays data in a graphical format. http: //www. alphaworks. ibm. com/tech/lparmon 40 © 2009 IBM Corporation
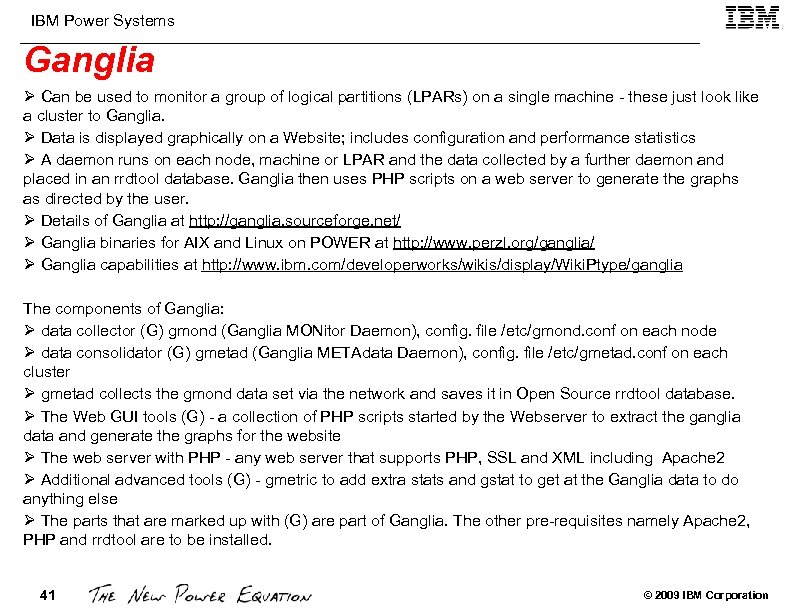
IBM Power Systems Ganglia Ø Can be used to monitor a group of logical partitions (LPARs) on a single machine - these just look like a cluster to Ganglia. Ø Data is displayed graphically on a Website; includes configuration and performance statistics Ø A daemon runs on each node, machine or LPAR and the data collected by a further daemon and placed in an rrdtool database. Ganglia then uses PHP scripts on a web server to generate the graphs as directed by the user. Ø Details of Ganglia at http: //ganglia. sourceforge. net/ Ø Ganglia binaries for AIX and Linux on POWER at http: //www. perzl. org/ganglia/ Ø Ganglia capabilities at http: //www. ibm. com/developerworks/wikis/display/Wiki. Ptype/ganglia The components of Ganglia: Ø data collector (G) gmond (Ganglia MONitor Daemon), config. file /etc/gmond. conf on each node Ø data consolidator (G) gmetad (Ganglia METAdata Daemon), config. file /etc/gmetad. conf on each cluster Ø gmetad collects the gmond data set via the network and saves it in Open Source rrdtool database. Ø The Web GUI tools (G) - a collection of PHP scripts started by the Webserver to extract the ganglia data and generate the graphs for the website Ø The web server with PHP - any web server that supports PHP, SSL and XML including Apache 2 Ø Additional advanced tools (G) - gmetric to add extra stats and gstat to get at the Ganglia data to do anything else Ø The parts that are marked up with (G) are part of Ganglia. The other pre-requisites namely Apache 2, PHP and rrdtool are to be installed. 41 © 2009 IBM Corporation
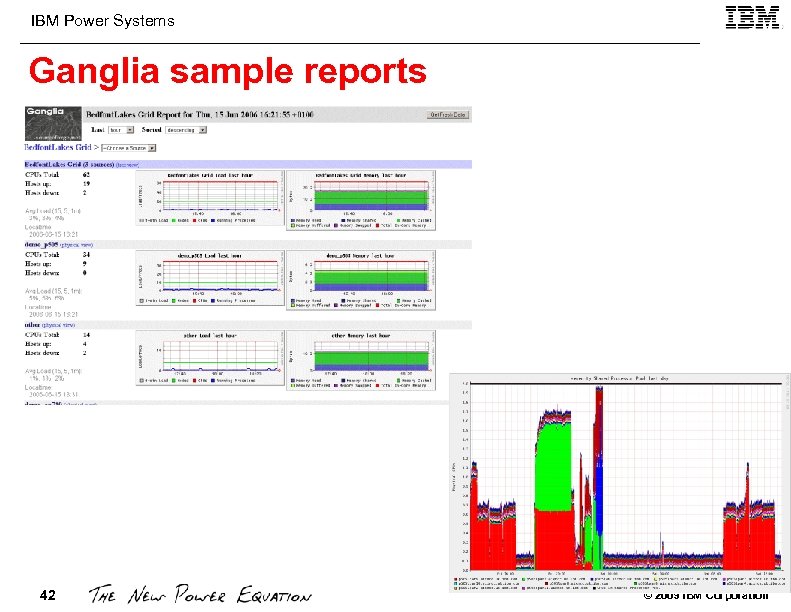
IBM Power Systems Ganglia sample reports 42 © 2009 IBM Corporation
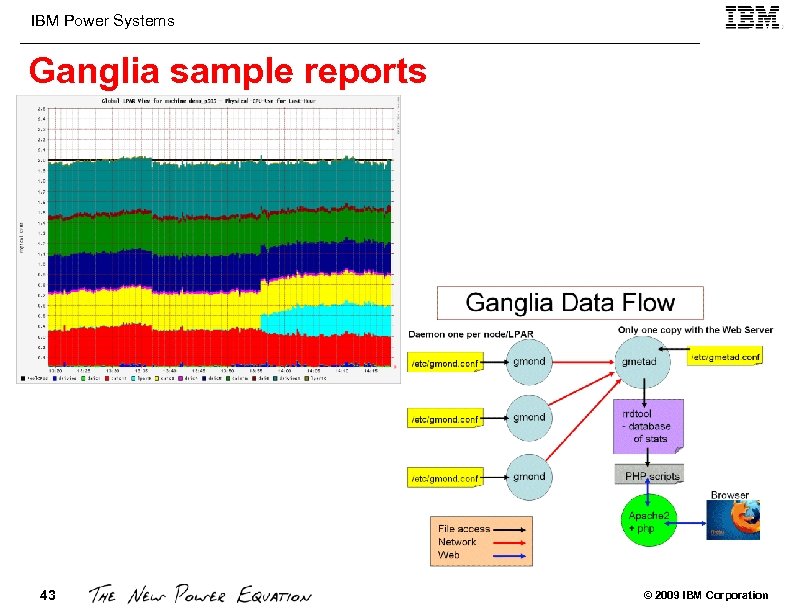
IBM Power Systems Ganglia sample reports 43 © 2009 IBM Corporation
IBM Power Systems Licensed Tools 44 © 2009 IBM Corporation
IBM Power Systems Licensed Tools Ø PM for Power Systems Ø IBM Systems Director Ø Performance Toolbox (PTX) Ø Tivoli Tools Ø AIX Enterprise Edition Ø AIX Management Edition for AIX 5. 3 45 © 2009 IBM Corporation
IBM Power Systems IBM Systems Director 46 © 2009 IBM Corporation
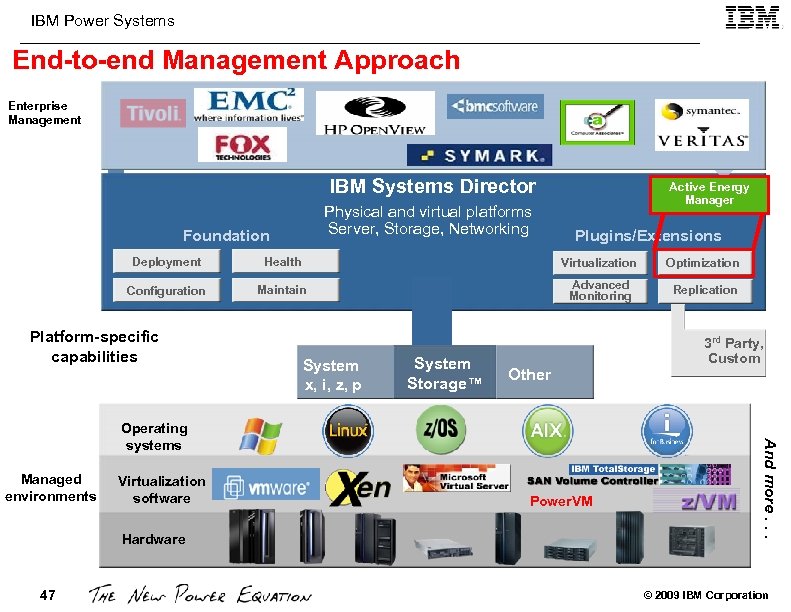
IBM Power Systems End-to-end Management Approach IBM Director Enterprise Management AIX Management IBM Systems Director Physical and virtual platforms Server, Storage, Networking Foundation Active Energy Manager Plugins/Extensions Deployment Health Virtualization Optimization Configuration Maintain Advanced Monitoring Replication Platform-specific capabilities System x, i, z, p System Storage™ Other Managed environments Virtualization software Hardware 47 Power. VM And more. . . Operating systems 3 rd Party, Custom © 2009 IBM Corporation

IBM Power Systems IBM Systems Director for Power Topology IBM Systems Director Console IBM Systems Director Foundation Management Inventory Health Config Physical and virtual platforms Server, Storage, Networking Advanced Management Availability Workload Update Image AIX MM WPAR IBM i WPAR AIX SLES RHEL VIOS AIX SLES RHEL IBM i WPAR PHYP FSP IVM (VIOS) AIX (SMP) JS 21 HS 21 SLES RHEL AIX Win WPAR HMC Energy Mgt POWER 6 System PHYP Blade Center BMC/ FSP PHYP FSP POWER 5 System HMC: Hardware Management Console WPAR: Workload Partition (Container) IVM: Integrated Virtualization Manager PHYP: POWER Hypervisor VIOS: Virtual IO Server (virtual IO and Layer 2 bridge) BMC: Baseboard Management Controller MM: Management Module SMP: Symmetric Multi Processor FSP: Flexible Service Processor 48 © 2009 IBM Corporation
IBM Power Systems Director 6. 1 Power Capabilities - Base § Automatic Discovery and Inventory: § POWER resources and connected storage which includes the collection of both hardware and software inventory. § HMC, CEC, LPAR, AIX, p. Linux, HMC, VIOS, FSP, and Virtual Networking components – bridges and VLANS) § Visualize various POWER resource: § Topologies and relationship across physical server and virtual servers v CEC, HMC, VIOS, LPAR, devices, AIX, p. Linux and Virtual Networking components, virtual disks, logical volumes and associated volume groups. § Discovery and documentation of full system configuration § Physical and virtual IO resources and association/relationship (for configuration recovery – i. e. , System plan). 49 © 2009 IBM Corporation
IBM Power Systems Director 6. 1 Power Capabilities - Base § Monitor Health and Status of Physical and Virtual Servers § HMC and VIOS. § Show Alerts: Hardware failures and system logs from VIOS, HMC and the operating systems. § Base Performance Monitoring § OS Metrics: CPU and memory utilization § File system metrics across hosts and virtual servers. § Historical and OS events monitoring. § View CPU utilization metrics for environments that contain both shared and dedicated processors for both host and virtual servers. 50 © 2009 IBM Corporation
IBM Power Systems Director 6. 1 Power Capabilities - Base § Download, Manage, and apply recommended Updates § AIX, Linux on p (Lo. P), IBM i, HMC and System Firmware § Deployment/Provisioning/Planning § Configure new systems or clone systems using system plans § Deploy OS or VIOS on a LPAR via HMC. § Base Virtualization Management § Support LPAR lifecycle and mobility operations v Within single HMC domain operations. § Consolidated Interface/console § Integration of tasks for Key Power Resource Managers v HMC, IVM/VIOS, AIX and IBM i OS management consoles 51 © 2009 IBM Corporation
IBM Power Systems Director 6. 1 Power Capabilities - Base § Comprehensive CLI interface § Discovery/Health/Update/Deployment, LPAR virtualization lifecycle and mobility, power control and management § Enterprise Integration and Manageability § Integrates with Enterprise Management tools utilizing standard CIM profiles for AIX, p. Linux, IBM i 5, HMC, and VIOS resources http: //www-03. ibm. com/systems/management/director/ 52 © 2009 IBM Corporation
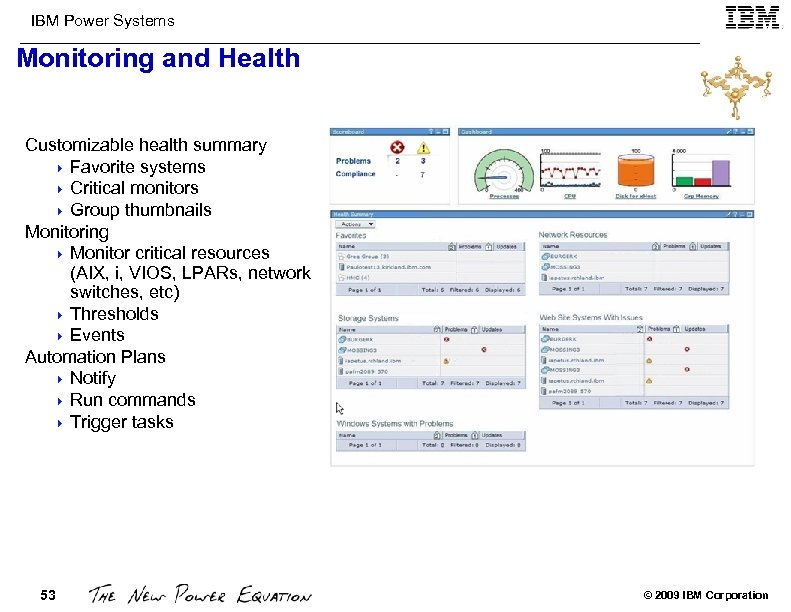
IBM Power Systems Monitoring and Health Customizable health summary 4 Favorite systems 4 Critical monitors 4 Group thumbnails Monitoring 4 Monitor critical resources (AIX, i, VIOS, LPARs, network switches, etc) 4 Thresholds 4 Events Automation Plans 4 Notify 4 Run commands 4 Trigger tasks 53 © 2009 IBM Corporation
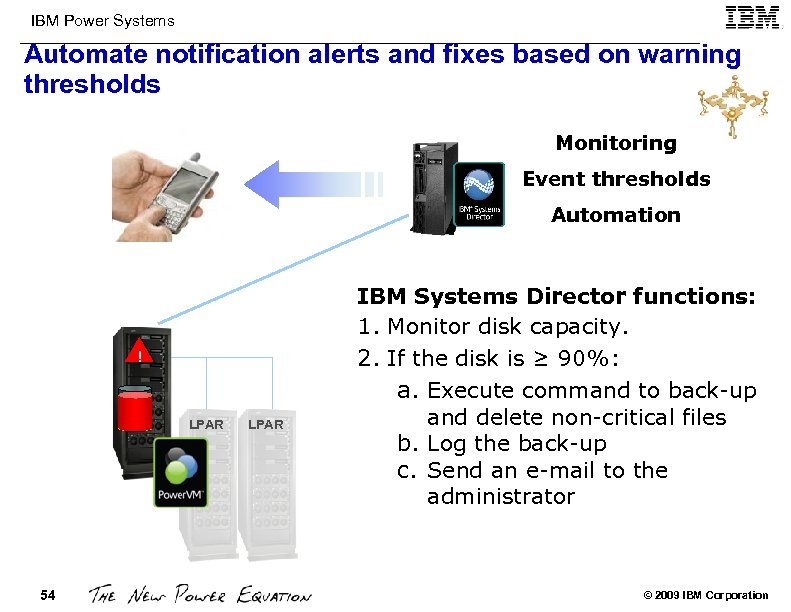
IBM Power Systems Automate notification alerts and fixes based on warning thresholds Monitoring Event thresholds Automation ! LPAR 54 LPAR IBM Systems Director functions: 1. Monitor disk capacity. 2. If the disk is ≥ 90%: a. Execute command to back-up and delete non-critical files b. Log the back-up c. Send an e-mail to the administrator © 2009 IBM Corporation
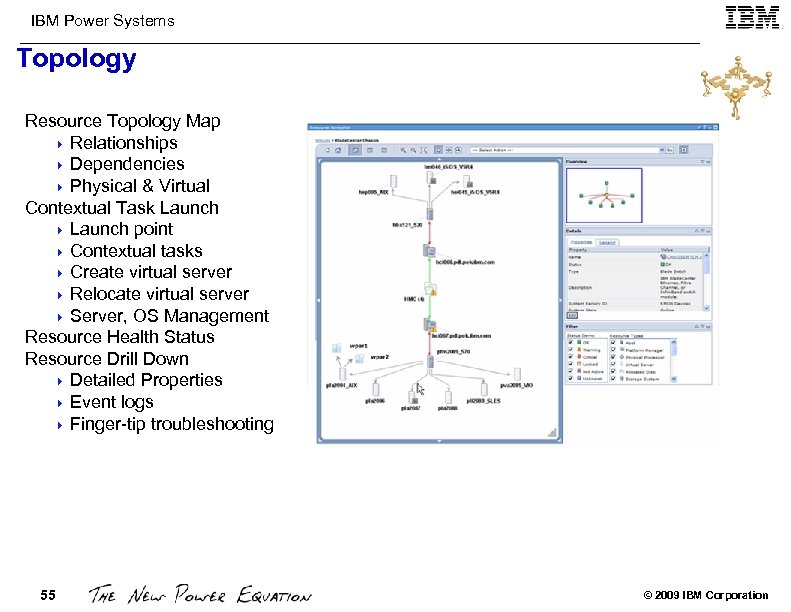
IBM Power Systems Topology Resource Topology Map 4 Relationships 4 Dependencies 4 Physical & Virtual Contextual Task Launch 4 Launch point 4 Contextual tasks 4 Create virtual server 4 Relocate virtual server 4 Server, OS Management Resource Health Status Resource Drill Down 4 Detailed Properties 4 Event logs 4 Finger-tip troubleshooting 55 © 2009 IBM Corporation
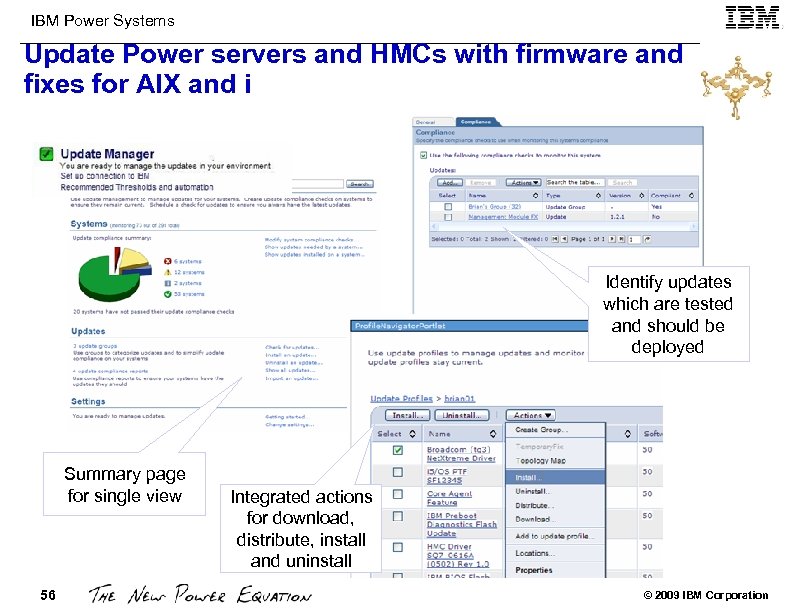
IBM Power Systems Update Power servers and HMCs with firmware and fixes for AIX and i Identify updates which are tested and should be deployed Summary page for single view 56 Integrated actions for download, distribute, install and uninstall © 2009 IBM Corporation
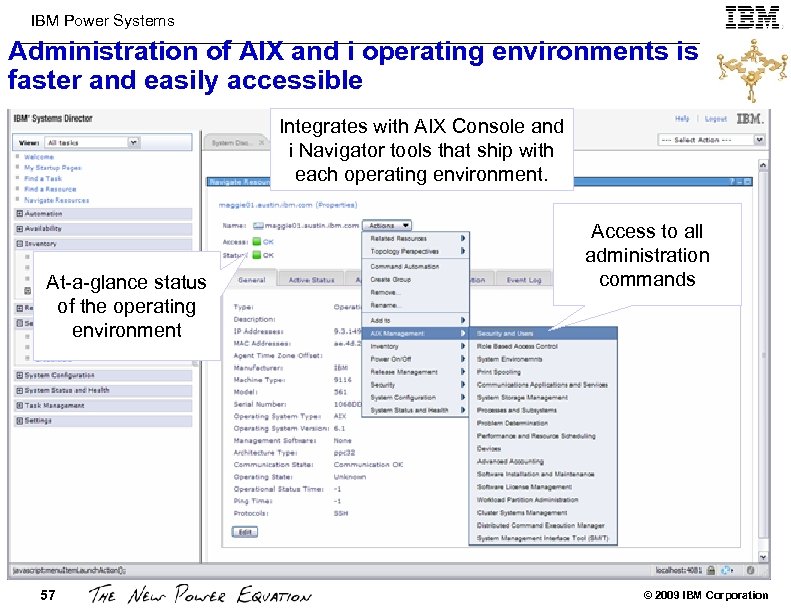
IBM Power Systems Administration of AIX and i operating environments is faster and easily accessible Integrates with AIX Console and i Navigator tools that ship with each operating environment. At-a-glance status of the operating environment 57 Access to all administration commands © 2009 IBM Corporation
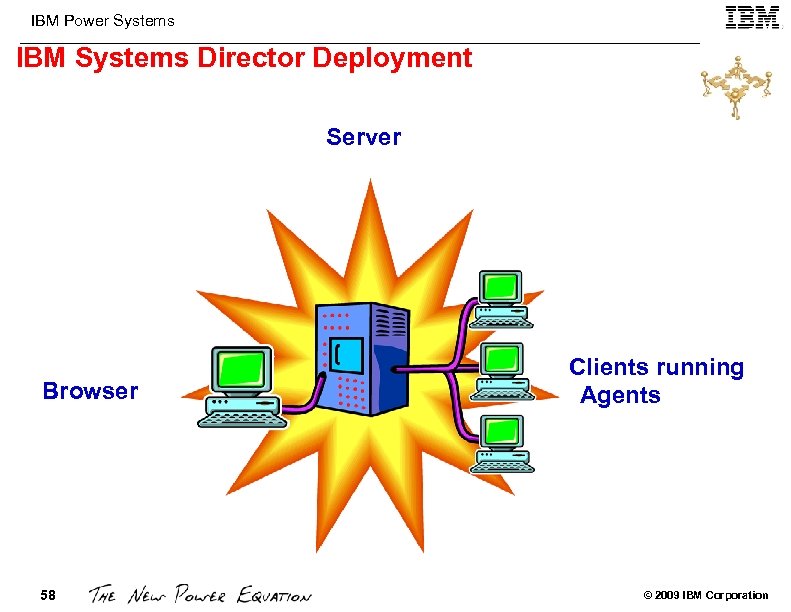
IBM Power Systems IBM Systems Director Deployment Server Browser 58 Clients running Agents © 2009 IBM Corporation
IBM Power Systems IBM Systems Director Agents Common Agent Ø Provides a single agent management system for status reporting and operations 4 Common authentication and credential management using a single agent manager 4 Single, shared incoming port (firewall friendly) for management 4 Increased availability using a watchdog to restart common agent, if needed Ø Single agent run time shared by IBM systems and Tivoli products like Tivoli Provisioning Manager that reduces agent footprint, supports shared credentials and drives discovery, inventory and other common services Ø Provides seamless integration of Platform Agent Ø Provides a subset of Common Agent functions used to communicate with and administer the managed system, including hardware alerts and status information Ø Improved interoperability through open standards, rather than through proprietary technologies Ø Firmware and driver updates and remote deployment Agent-less Management Ø Agent-less managed systems are best for environments that require very small footprints and are used for specific tasks, such as one-time inventory collection, firmware and driver updates and remote deployment. 59 © 2009 IBM Corporation
IBM Power Systems IBM Systems Director Upward Integration IBM Systems Director enables upward integration with these management software solutions: Ø Tivoli Management Framework Ø Tivoli Net. View 7. 1. x (Windows and Linux) Ø Netcool/Precision IP (via SNMP) Ø Netcool/Monitoring, Netcool/ISM Ø Netcool/AEM (via SNMP) Ø CA™ Unicenter® NSM 3. 1 and R 11 (Windows) Ø HP Open. View NNM 7. 0. 1 and 7. 5. 1 (Windows and Linux) Ø HP Open. View Operations for windows 7. 5 x (Windows) Ø Microsoft® Systems Management Server 2003, Microsoft® System Center Operations Manager 2007, and Microsoft® Operations Manager 2005 Ø IBM Systems Director Upward Integration Modules (UIMs) protects your investment in existing management software Ø Adds value to these products by surfacing more detailed hardware information and tools. Ø UIMs provides the same familiar console for management 60 © 2009 IBM Corporation
IBM Power Systems IBM System Director Plugins IBM Systems Director VMControl Ø Simplify the management of virtual environments across multiple virtualization technologies and physical platforms. Ø Delivers leadership heterogeneous virtualization management and enables an infrastructure for cloud computing. IBM Systems Director Active Energy Manager Ø Measures, monitors and manages the energy components built into IBM Systems enabling a cross- platform management solution. Ø Energy management enables a complete view of energy consumption within the datacenter. IBM Systems Director Network Control Ø Discover, monitor, manage, and troubleshoot network hardware devices in the computing environment. Ø Integrates server, storage, and network management for virtualization environments across platforms. IBM Systems Director Service and Support Manager Ø Electronic Service Agent™ is a call home plug-in to IBM Systems Director that monitors events and transmits system service information to IBM. Ø A no-charge call-home extension to IBM Systems Director that automatically reports hardware problems and collects system service information for monitored systems. Ø Can monitor, track, and capture system hardware errors and service information and report them directly to IBM support. IBM Systems Director Migration Tool Version 6. 1 Ø A no-charge tool that enables the migration from a previous version of IBM Director Ø Supports all platforms that IBM Systems Director supports. http: //www-03. ibm. com/systems/management/director/plugins/ 61 © 2009 IBM Corporation
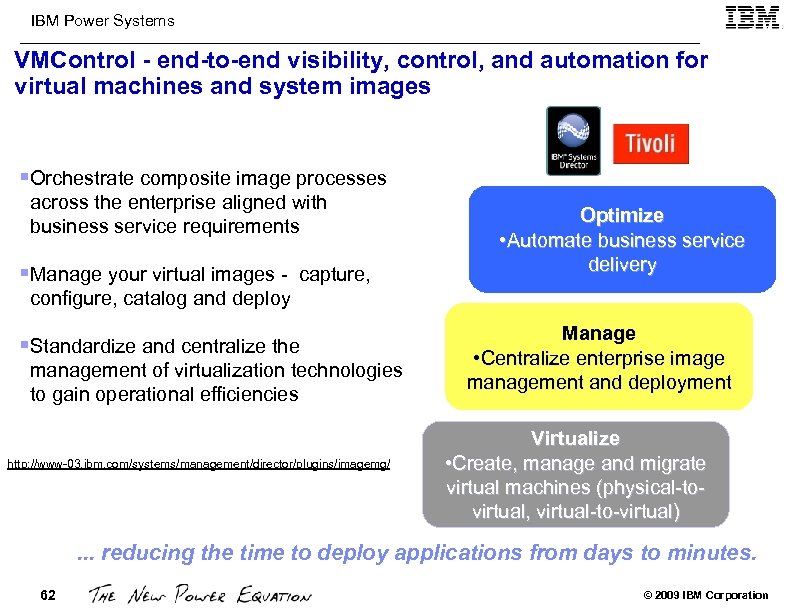
IBM Power Systems VMControl - end-to-end visibility, control, and automation for virtual machines and system images §Orchestrate composite image processes across the enterprise aligned with business service requirements §Manage your virtual images - capture, Optimize • Automate business service delivery configure, catalog and deploy §Standardize and centralize the management of virtualization technologies to gain operational efficiencies http: //www-03. ibm. com/systems/management/director/plugins/imagemg/ Manage • Centralize enterprise image management and deployment Virtualize • Create, manage and migrate virtual machines (physical-tovirtual, virtual-to-virtual) . . . reducing the time to deploy applications from days to minutes. 62 © 2009 IBM Corporation
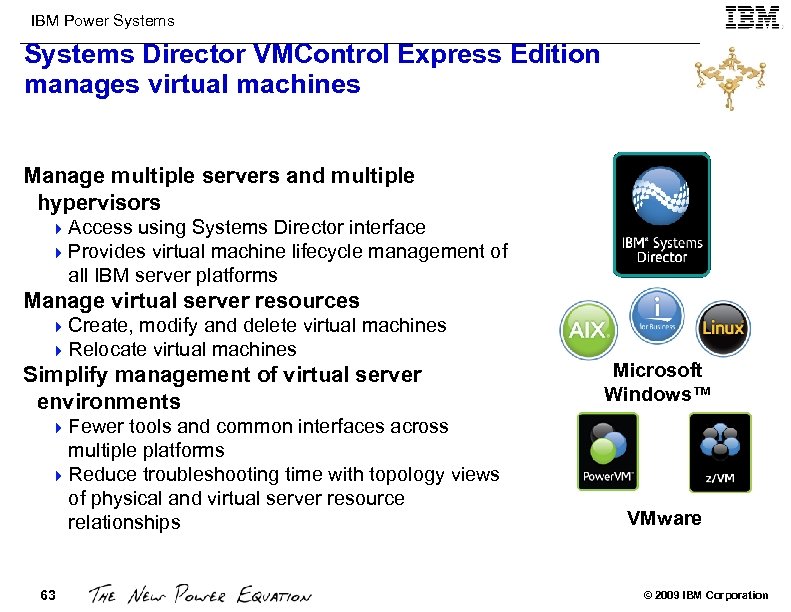
IBM Power Systems Director VMControl Express Edition manages virtual machines Manage multiple servers and multiple hypervisors 4 Access using Systems Director interface 4 Provides virtual machine lifecycle management of all IBM server platforms Manage virtual server resources 4 Create, modify and delete virtual machines 4 Relocate virtual machines Simplify management of virtual server environments Microsoft Windows™ 4 Fewer tools and common interfaces across multiple platforms 4 Reduce troubleshooting time with topology views of physical and virtual server resource relationships 63 VMware © 2009 IBM Corporation
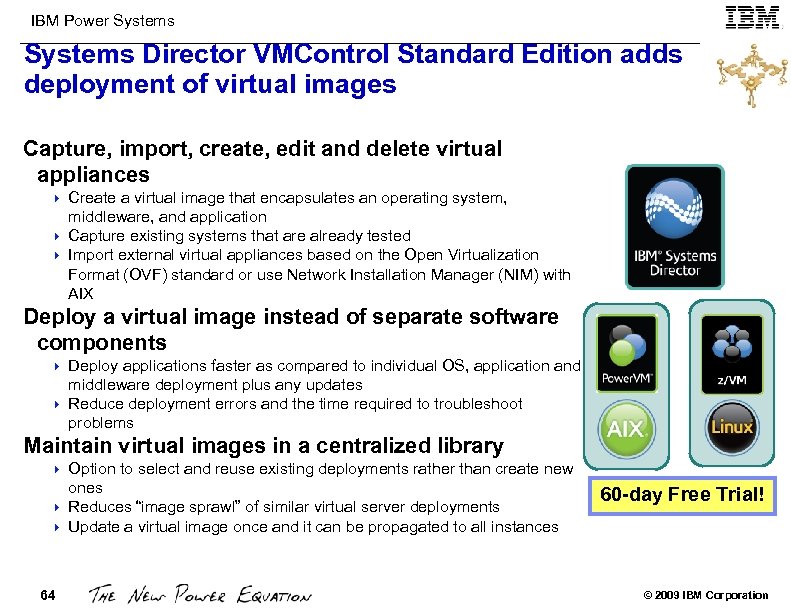
IBM Power Systems Director VMControl Standard Edition adds deployment of virtual images Capture, import, create, edit and delete virtual appliances Create a virtual image that encapsulates an operating system, middleware, and application 4 Capture existing systems that are already tested 4 Import external virtual appliances based on the Open Virtualization Format (OVF) standard or use Network Installation Manager (NIM) with AIX 4 Deploy a virtual image instead of separate software components Deploy applications faster as compared to individual OS, application and middleware deployment plus any updates 4 Reduce deployment errors and the time required to troubleshoot problems 4 Maintain virtual images in a centralized library Option to select and reuse existing deployments rather than create new ones 4 Reduces “image sprawl” of similar virtual server deployments 4 Update a virtual image once and it can be propagated to all instances 4 64 60 -day Free Trial! © 2009 IBM Corporation
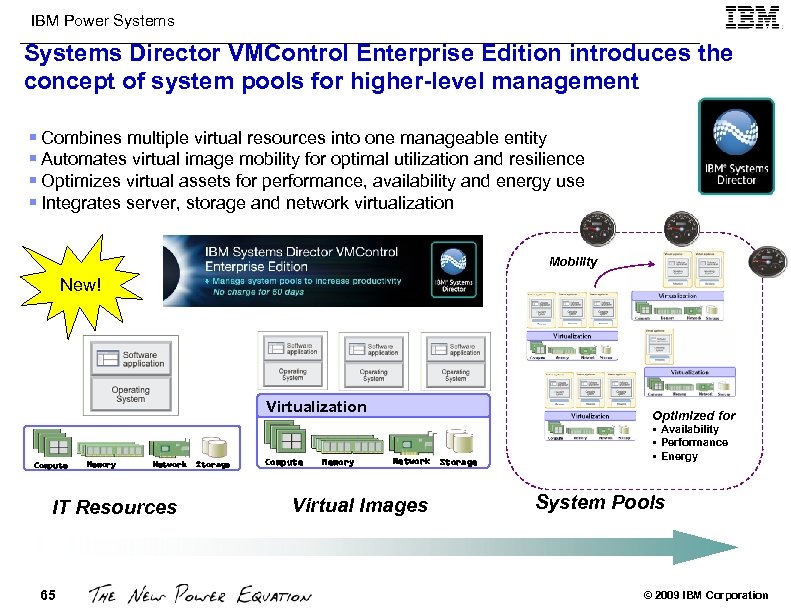
IBM Power Systems Director VMControl Enterprise Edition introduces the concept of system pools for higher-level management § Combines multiple virtual resources into one manageable entity § Automates virtual image mobility for optimal utilization and resilience § Optimizes virtual assets for performance, availability and energy use § Integrates server, storage and network virtualization Mobility New! Virtualization Compute Memory Network IT Resources 65 Storage Compute Memory Optimized for Network Storage Virtual Images § Availability § Performance § Energy System Pools © 2009 IBM Corporation
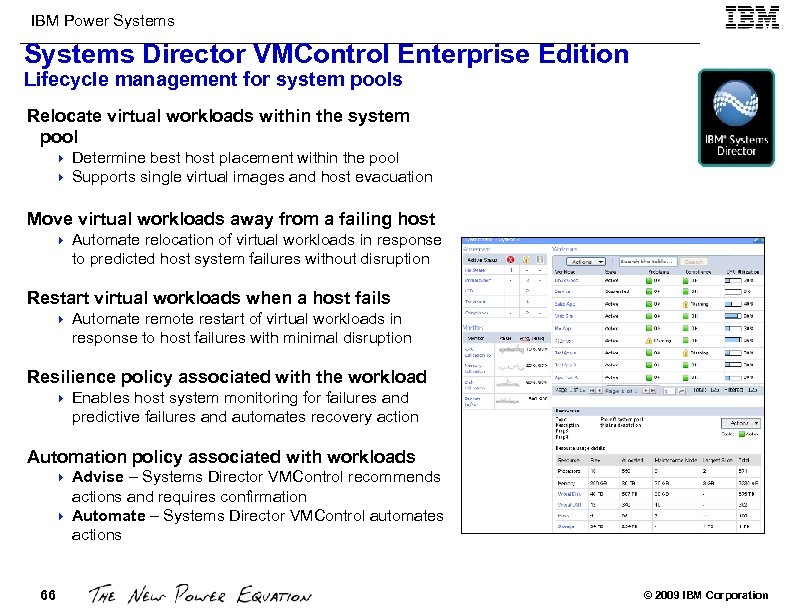
IBM Power Systems Director VMControl Enterprise Edition Lifecycle management for system pools Relocate virtual workloads within the system pool 4 4 Determine best host placement within the pool Supports single virtual images and host evacuation Move virtual workloads away from a failing host 4 Automate relocation of virtual workloads in response to predicted host system failures without disruption Restart virtual workloads when a host fails 4 Automate remote restart of virtual workloads in response to host failures with minimal disruption Resilience policy associated with the workload 4 Enables host system monitoring for failures and predictive failures and automates recovery action Automation policy associated with workloads Advise – Systems Director VMControl recommends actions and requires confirmation 4 Automate – Systems Director VMControl automates actions 4 66 © 2009 IBM Corporation
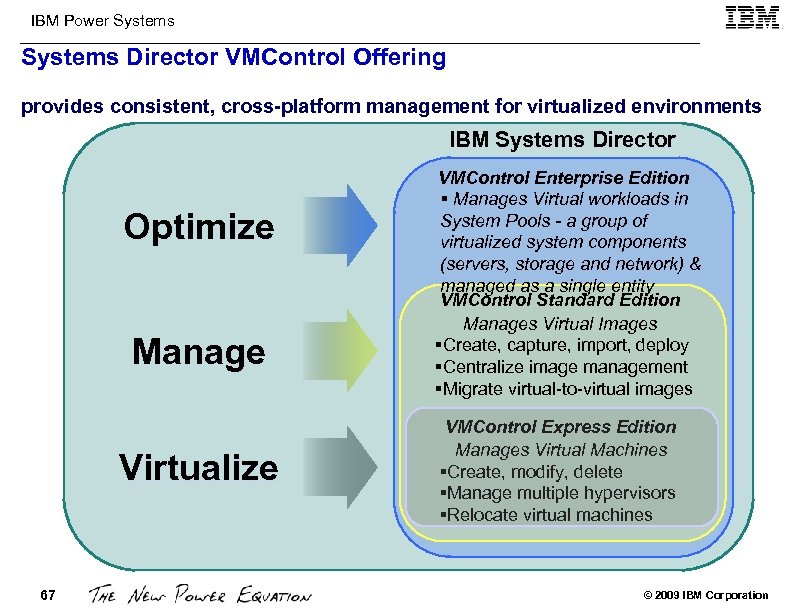
IBM Power Systems Director VMControl Offering provides consistent, cross-platform management for virtualized environments IBM Systems Director Optimize Manage Virtualize 67 VMControl Enterprise Edition § Manages Virtual workloads in System Pools - a group of virtualized system components (servers, storage and network) & managed as a single entity VMControl Standard Edition Manages Virtual Images §Create, capture, import, deploy §Centralize image management §Migrate virtual-to-virtual images VMControl Express Edition Manages Virtual Machines §Create, modify, delete §Manage multiple hypervisors §Relocate virtual machines © 2009 IBM Corporation
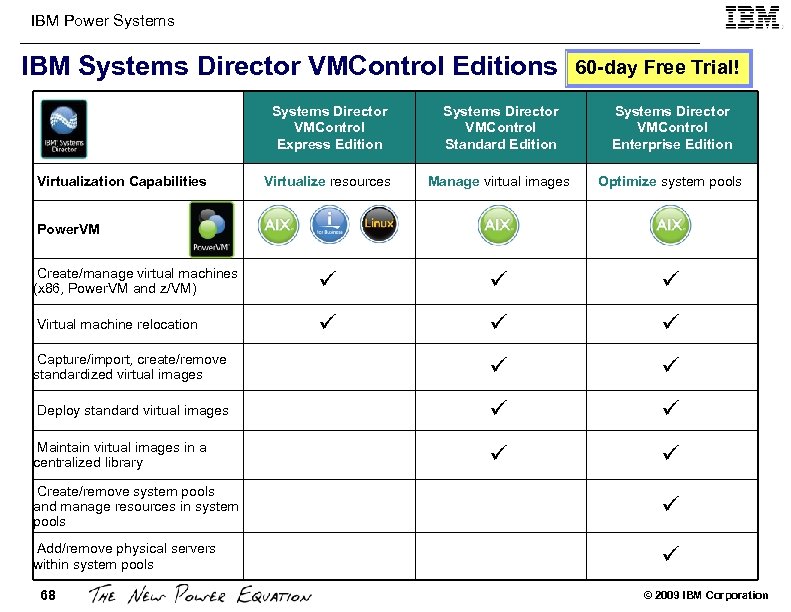
IBM Power Systems IBM Systems Director VMControl Editions 60 -day Free Trial! Systems Director VMControl Express Edition Systems Director VMControl Standard Edition Systems Director VMControl Enterprise Edition Virtualize resources Manage virtual images Optimize system pools Create/manage virtual machines (x 86, Power. VM and z/VM) Virtual machine relocation Capture/import, create/remove standardized virtual images Deploy standard virtual images Maintain virtual images in a centralized library Virtualization Capabilities Power. VM Create/remove system pools and manage resources in system pools Add/remove physical servers within system pools 68 © 2009 IBM Corporation
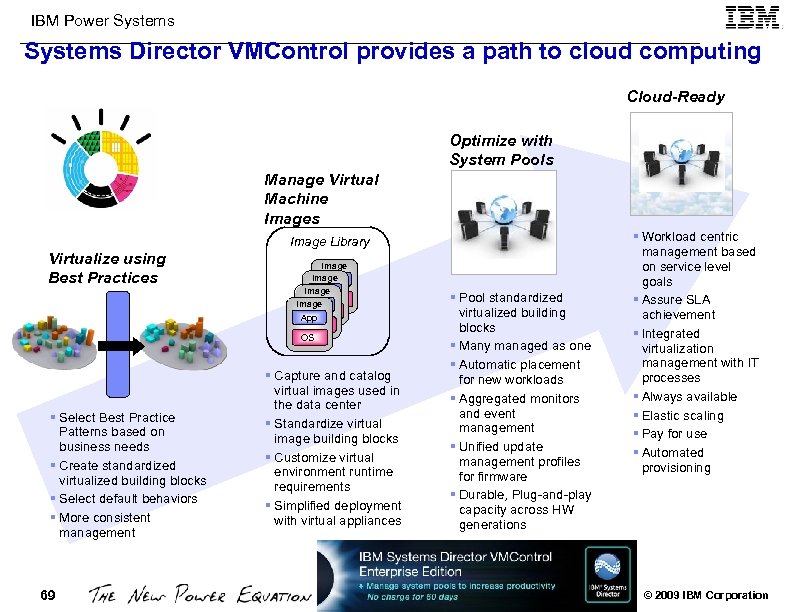
IBM Power Systems Director VMControl provides a path to cloud computing Cloud-Ready Optimize with System Pools Manage Virtual Machine Images Image Library Virtualize using Best Practices § Select Best Practice Patterns based on business needs § Create standardized virtualized building blocks § Select default behaviors § More consistent management 69 69 Image App Image OS Image App OS OS § Capture and catalog virtual images used in the data center § Standardize virtual image building blocks § Customize virtual environment runtime requirements § Simplified deployment with virtual appliances § Pool standardized virtualized building blocks § Many managed as one § Automatic placement for new workloads § Aggregated monitors and event management § Unified update management profiles for firmware § Durable, Plug-and-play capacity across HW generations § Workload centric management based on service level goals § Assure SLA achievement § Integrated virtualization management with IT processes § Always available § Elastic scaling § Pay for use § Automated provisioning © 2009 IBM Corporation
IBM Power Systems IBM Systems Director Active Energy Manager 3. 1 Exploit Energy Scale capabilities in POWER 6 processor-based servers 4 Power Trending 4 Thermal Trending 4 Effective CPU Trending 4 Power Savings 4 Power Capping Support power savings for new POWER 6 processor-based models Discover and monitor legacy and select non-IBM systems through the intelligent Power Distribution Unit (i. PDU) 4 Display trending information per load group 4 Allows management of POWER 6 legacy systems 4 Support low- to mid-range storage devices Enhancements above Power. Executive™ V 2 (Windows®, x. Linux) 4 Support for new x 86 Systems 4 Cross-system monitoring and management support 4 i. PDU support 4 System polling enhancements AEM application supported on: Windows, x 86 Linux, Linux on p 70 © 2009 IBM Corporation
IBM Power Systems Active Energy Manager Monitoring Functions “No Charge” Monitor Functions Power Trending 4 Displays power usage for individual systems over time (in a graph or in table format) to understand power usage trends within and across their systems Thermal Trending 4 Displays information on the inlet and exhaust temperatures for individual systems one at a time to understand thermal characteristics of systems so that temperature adjustments can be made within the IT shop i. PDU (intelligent Power Distribution Units) 4 Enables support for power trending for older systems, low- and mid-range storage devices as well as non-IBM systems. By plugging these systems into an intelligent PDU (a smart power strip) AEM can collect power information from I/O drawers within the i. PDU thereby giving a more complete view of power used within a data center Native Support 4 Extends power management functions such as power trending, thermal trending, and power capping, originally available on System x™, to multiple IBM platforms enabling power management functions on all IBM systems from a single console which reduces complexity 71 © 2009 IBM Corporation
IBM Power Systems Active Energy Manager Management Functions “Priced” Management Functions Power Capping 4 Allocates a maximum power level a system can use without having to worry about power usage above the maximum point 4 AEM will throttle the processor to use less power, which slows down the server, if the system starts to consume more than the maximum level set 4 This feature can come into play if it gets too warm in the data center as setting the cap will ensure that the system will not use more than that cap value thus reducing power and thermal usage Power Savings Mode 4 Enables a system to save up to 30% of normal CPU power usage 4 Power savings is enabled via an on/off switch which can be scheduled during times of low utilization 4 Occurs automatically based on processor utilization if the function is supported on the system 4 Allows management of power usage as work activity shifts across various demands http: //www-03. ibm. com/systems/management/director/plugins/actengmgr/index. html 72 © 2009 IBM Corporation
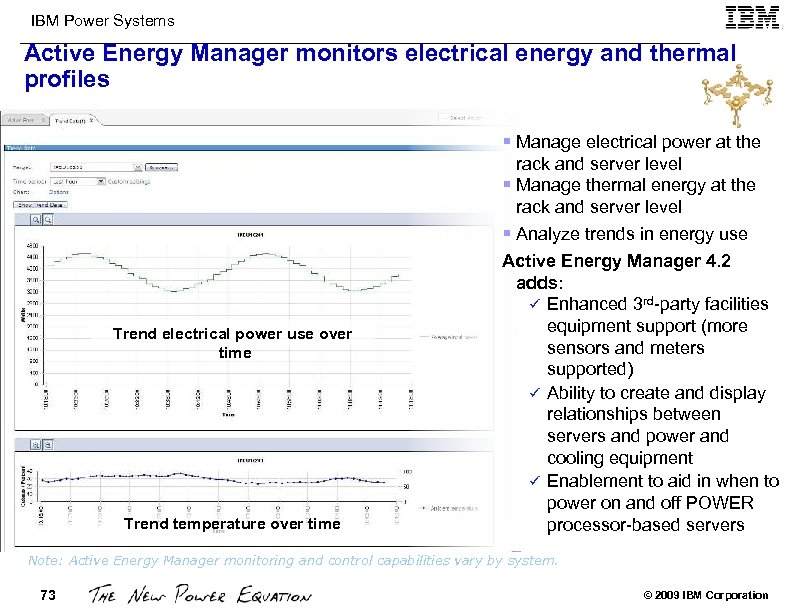
IBM Power Systems Active Energy Manager monitors electrical energy and thermal profiles § Manage electrical power at the rack and server level § Manage thermal energy at the rack and server level § Analyze trends in energy use Trend electrical power use over time Trend temperature over time Active Energy Manager 4. 2 adds: Enhanced 3 rd-party facilities equipment support (more sensors and meters supported) Ability to create and display relationships between servers and power and cooling equipment Enablement to aid in when to power on and off POWER processor-based servers Note: Active Energy Manager monitoring and control capabilities vary by system. 73 © 2009 IBM Corporation
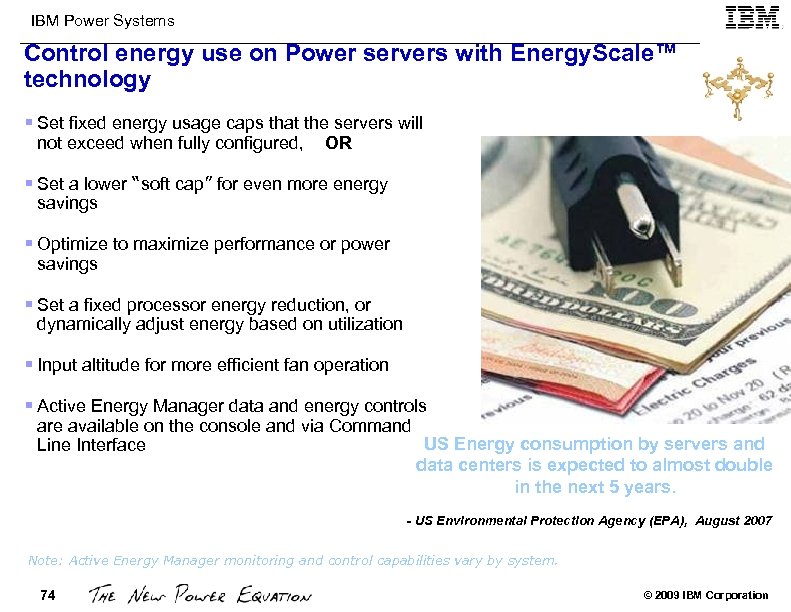
IBM Power Systems Control energy use on Power servers with Energy. Scale™ technology § Set fixed energy usage caps that the servers will not exceed when fully configured, OR § Set a lower “soft cap” for even more energy savings § Optimize to maximize performance or power savings § Set a fixed processor energy reduction, or dynamically adjust energy based on utilization § Input altitude for more efficient fan operation § Active Energy Manager data and energy controls are available on the console and via Command US Energy consumption by servers and Line Interface data centers is expected to almost double in the next 5 years. - US Environmental Protection Agency (EPA), August 2007 Note: Active Energy Manager monitoring and control capabilities vary by system. 74 © 2009 IBM Corporation
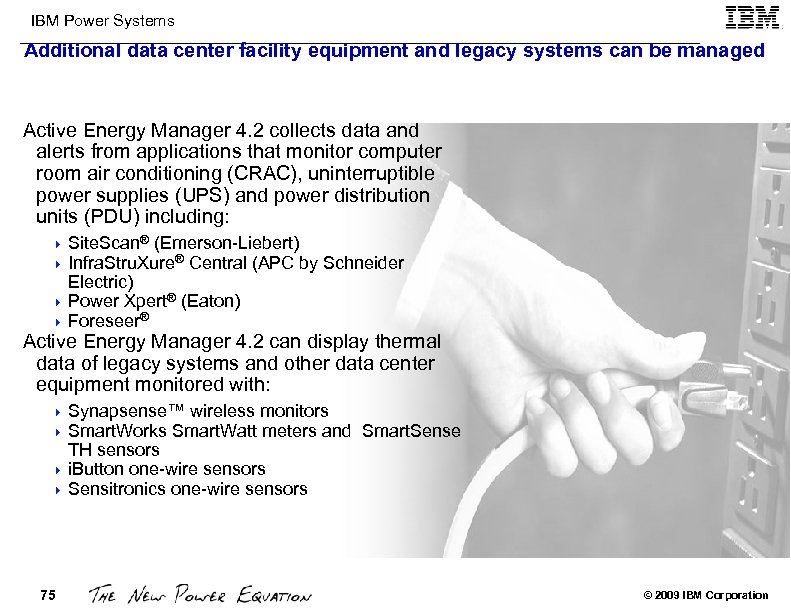
IBM Power Systems Additional data center facility equipment and legacy systems can be managed Active Energy Manager 4. 2 collects data and alerts from applications that monitor computer room air conditioning (CRAC), uninterruptible power supplies (UPS) and power distribution units (PDU) including: 4 Site. Scan® (Emerson-Liebert) 4 Infra. Stru. Xure® Central (APC by Schneider Electric) 4 Power Xpert® (Eaton) 4 Foreseer® Active Energy Manager 4. 2 can display thermal data of legacy systems and other data center equipment monitored with: 4 Synapsense™ wireless monitors 4 Smart. Works Smart. Watt meters and Smart. Sense TH sensors 4 i. Button one-wire sensors 4 Sensitronics one-wire sensors 75 © 2009 IBM Corporation
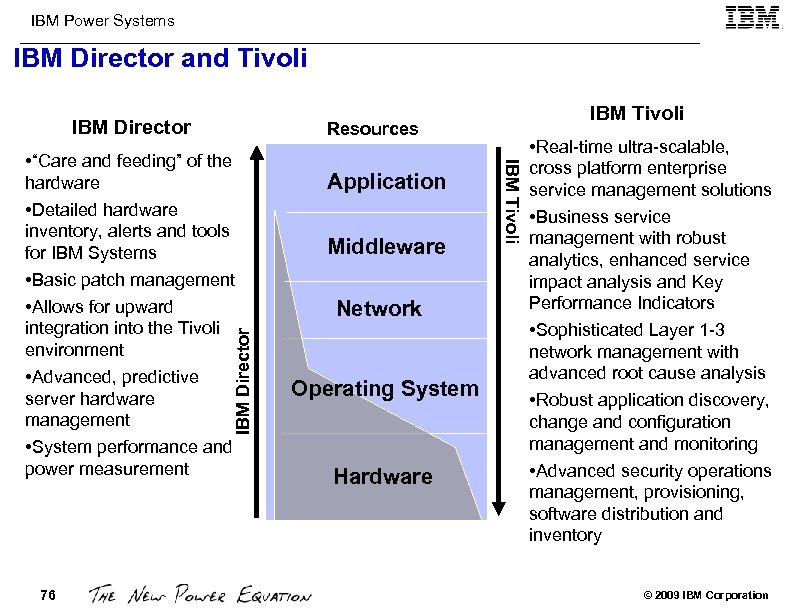
IBM Power Systems IBM Director and Tivoli IBM Director Application Middleware Network Operating System Hardware IBM Tivoli • “Care and feeding” of the hardware • Detailed hardware inventory, alerts and tools for IBM Systems • Basic patch management • Allows for upward integration into the Tivoli environment • Advanced, predictive server hardware management • System performance and power measurement 76 IBM Tivoli Resources • Real-time ultra-scalable, cross platform enterprise service management solutions • Business service management with robust analytics, enhanced service impact analysis and Key Performance Indicators • Sophisticated Layer 1 -3 network management with advanced root cause analysis • Robust application discovery, change and configuration management and monitoring • Advanced security operations management, provisioning, software distribution and inventory © 2009 IBM Corporation
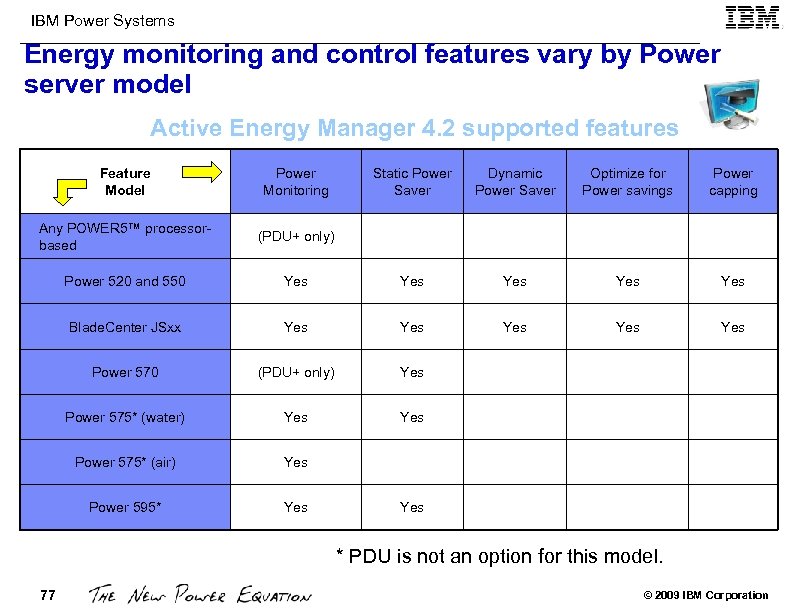
IBM Power Systems Energy monitoring and control features vary by Power server model Active Energy Manager 4. 2 supported features Feature Model Power Monitoring Static Power Saver Dynamic Power Saver Optimize for Power savings Power capping Any POWER 5™ processorbased (PDU+ only) Power 520 and 550 Yes Yes Yes Blade. Center JSxx Yes Yes Yes Power 570 (PDU+ only) Yes Power 575* (water) Yes Power 575* (air) Yes Power 595* Yes * PDU is not an option for this model. 77 © 2009 IBM Corporation
IBM Power Systems Director Library and Download Active Energy Manager, VMControl and Network Control are dependent on IBM Systems Director and have the same hardware and OS requirements as IBM Systems Director. These requirements are available from the IBM Systems Director Information Center at Ø Systems Director Library http: //publib. boulder. ibm. com/infocenter/director/v 6 r 1 x/index. jsp http: //www-03. ibm. com/systems/management/director/downloads/ Ø OS Support http: //publib. boulder. ibm. com/infocenter/director/v 6 r 1 x/index. jsp? topic=/director. plan_6. 1/fqm 0_r_os_supported_by_ibm_ director_611. html Ø H/W Support http: //publib. boulder. ibm. com/infocenter/director/v 6 r 1 x/index. jsp? topic=/director. plan_6. 1/fqm 0_r_supported_hardware_a nd_software_requirements. html ØPlug-ins http: //www-03. ibm. com/systems/management/director/plugins/ http: //www-03. ibm. com/systems/management/director/downloads/plugins/index. html 78 © 2009 IBM Corporation
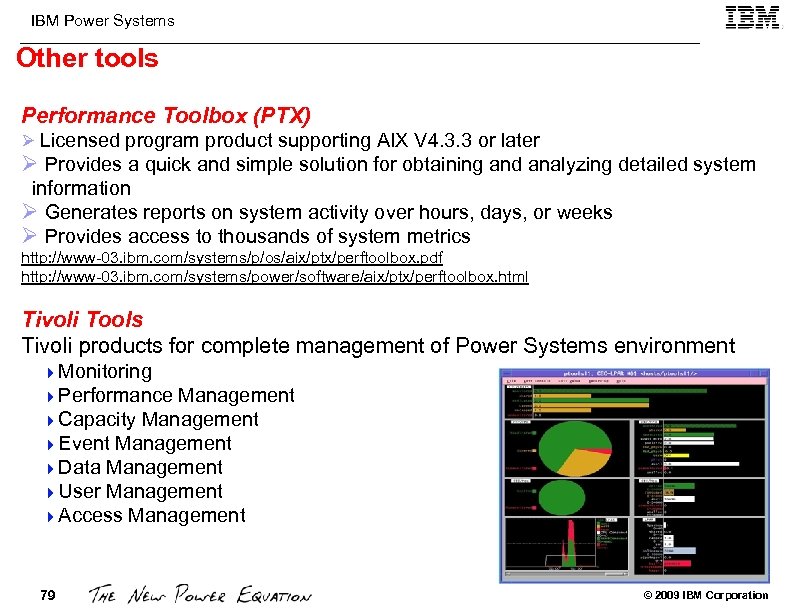
IBM Power Systems Other tools Performance Toolbox (PTX) Ø Licensed program product supporting AIX V 4. 3. 3 or later Ø Provides a quick and simple solution for obtaining and analyzing detailed system information Ø Generates reports on system activity over hours, days, or weeks Ø Provides access to thousands of system metrics http: //www-03. ibm. com/systems/p/os/aix/ptx/perftoolbox. pdf http: //www-03. ibm. com/systems/power/software/aix/ptx/perftoolbox. html Tivoli Tools Tivoli products for complete management of Power Systems environment 4 Monitoring 4 Performance Management 4 Capacity Management 4 Event Management 4 Data Management 4 User Management 4 Access Management 79 © 2009 IBM Corporation
IBM Power Systems AIX Editions 80 © 2009 IBM Corporation
IBM Power Systems AIX Editions…. . AIX 5. 3 Management Edition bundle 4 AIX V 5. 3 4 Tivoli® Application Dependency Discovery Manager 4 IBM Tivoli Monitoring 4 IBM Usage & Accounting Mgr Virtualization Edition for Power Systems http: //www-03. ibm. com/systems/power/software/aix/sysmgmt/me/index. html AIX 6. 1 Enterprise Edition 4 AIX V 6. 1 4 Power. VM AIX Workload Partitions Manager 4 Tivoli® Application Dependency Discovery Manager 4 IBM Tivoli Monitoring 4 IBM Usage & Accounting Mgr Virtualization Edition for Power Systems http: //www-03. ibm. com/systems/power/software/aix/sysmgmt/enterprise/index. html 81 © 2009 IBM Corporation
IBM Power Systems AIX Enterprise Edition Key Features Live Application Mobility 4 Relocate Workload Partitions between systems with almost no client impact Manage WPARs across multiple systems 4 Centralize the creation, replication, and starting of WPARs across multiple systems Automatically discover IT components and their relationships 4 Ideal for managing dynamic virtualized environments Monitor virtualized resources 4 Efficient management begins with comprehensive performance information Provides a visual representation of the components 4 Assists understanding of complex application dependencies Monitor utilization and configuration changes 4 Useful for problem determination and failure analysis Collect and report resource usage 4 Understand IT resource consumption by workload or area 82 © 2009 IBM Corporation
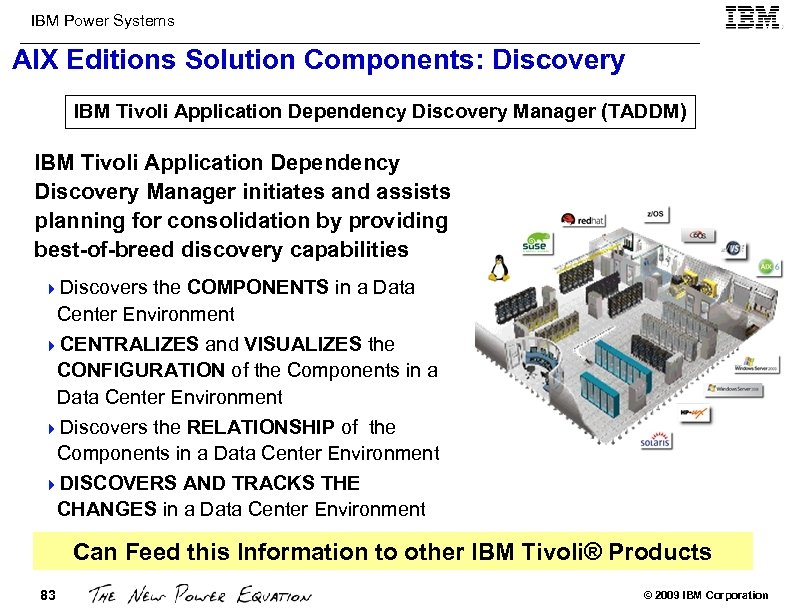
IBM Power Systems AIX Editions Solution Components: Discovery IBM Tivoli Application Dependency Discovery Manager (TADDM) IBM Tivoli Application Dependency Discovery Manager initiates and assists planning for consolidation by providing best-of-breed discovery capabilities 4 Discovers the COMPONENTS in a Data Center Environment 4 CENTRALIZES and VISUALIZES the CONFIGURATION of the Components in a Data Center Environment 4 Discovers the RELATIONSHIP of the Components in a Data Center Environment 4 DISCOVERS AND TRACKS THE CHANGES in a Data Center Environment Can Feed this Information to other IBM Tivoli® Products 83 © 2009 IBM Corporation
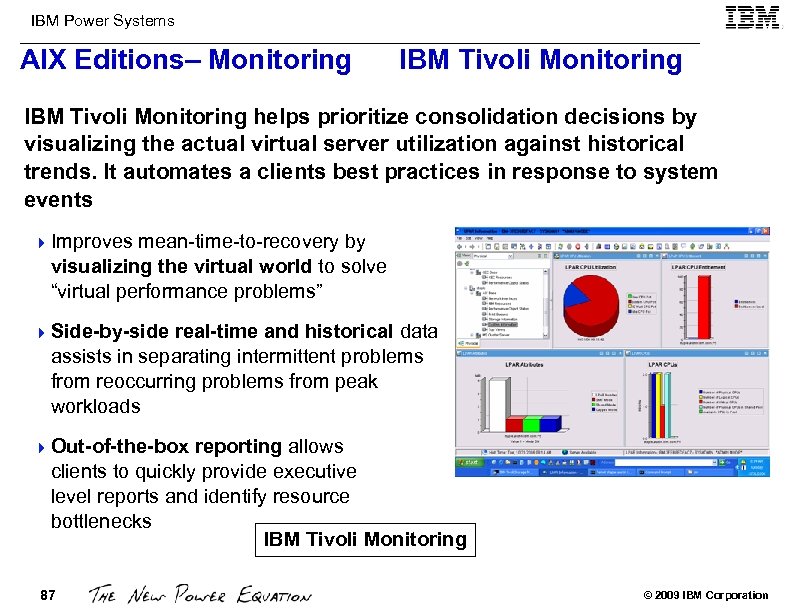
IBM Power Systems AIX Editions– Monitoring IBM Tivoli Monitoring helps prioritize consolidation decisions by visualizing the actual virtual server utilization against historical trends. It automates a clients best practices in response to system events 4 Improves mean-time-to-recovery by visualizing the virtual world to solve “virtual performance problems” 4 Side-by-side real-time and historical data assists in separating intermittent problems from reoccurring problems from peak workloads 4 Out-of-the-box reporting allows clients to quickly provide executive level reports and identify resource bottlenecks IBM Tivoli Monitoring 87 © 2009 IBM Corporation
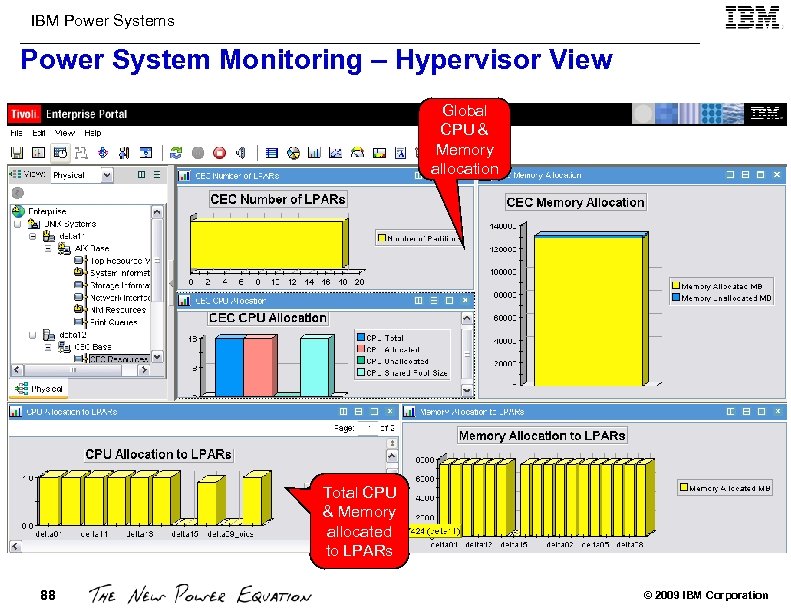
IBM Power Systems Power System Monitoring – Hypervisor View Global CPU & Memory allocation Total CPU & Memory allocated to LPARs 88 © 2009 IBM Corporation
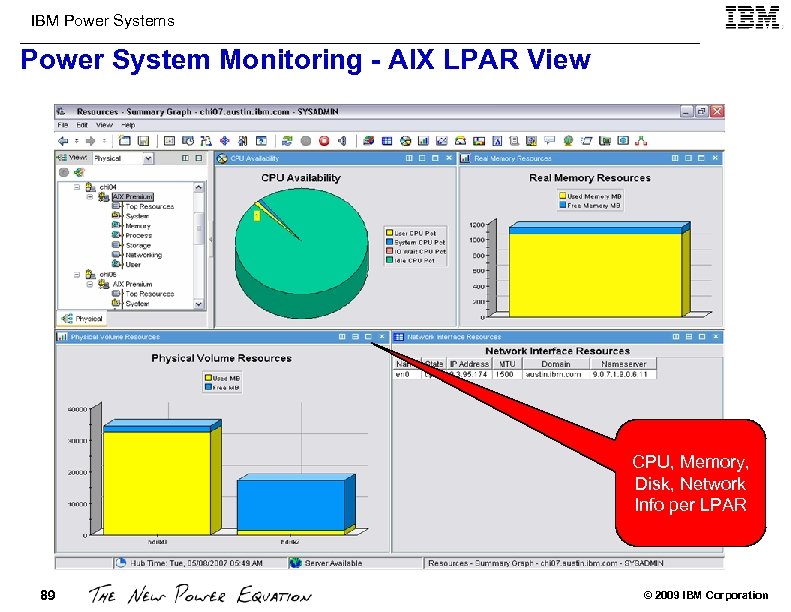
IBM Power Systems Power System Monitoring - AIX LPAR View CPU, Memory, Disk, Network Info per LPAR 89 © 2009 IBM Corporation
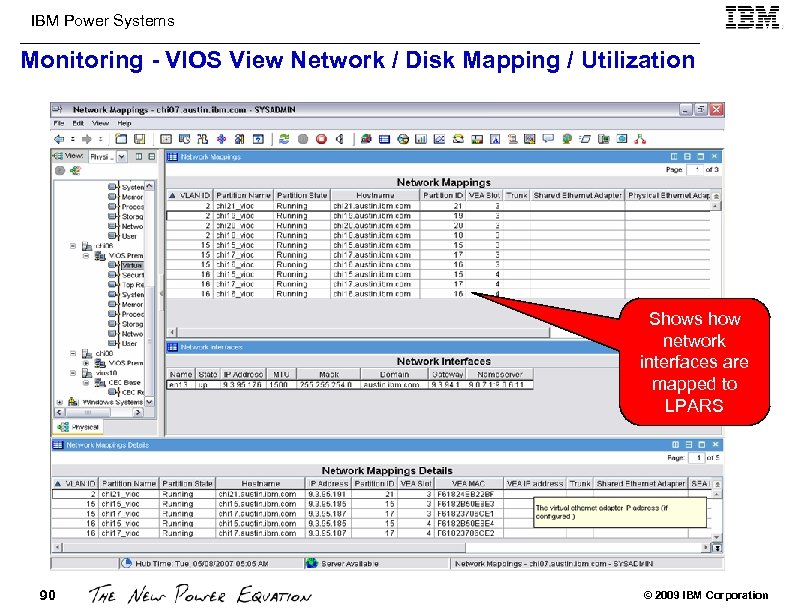
IBM Power Systems Monitoring - VIOS View Network / Disk Mapping / Utilization Shows how network interfaces are mapped to LPARS 90 © 2009 IBM Corporation
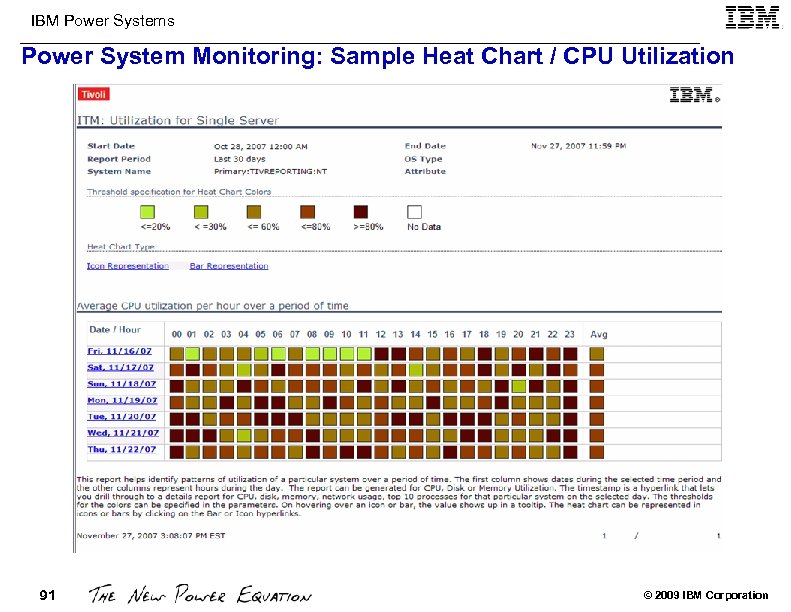
IBM Power Systems Power System Monitoring: Sample Heat Chart / CPU Utilization 91 © 2009 IBM Corporation
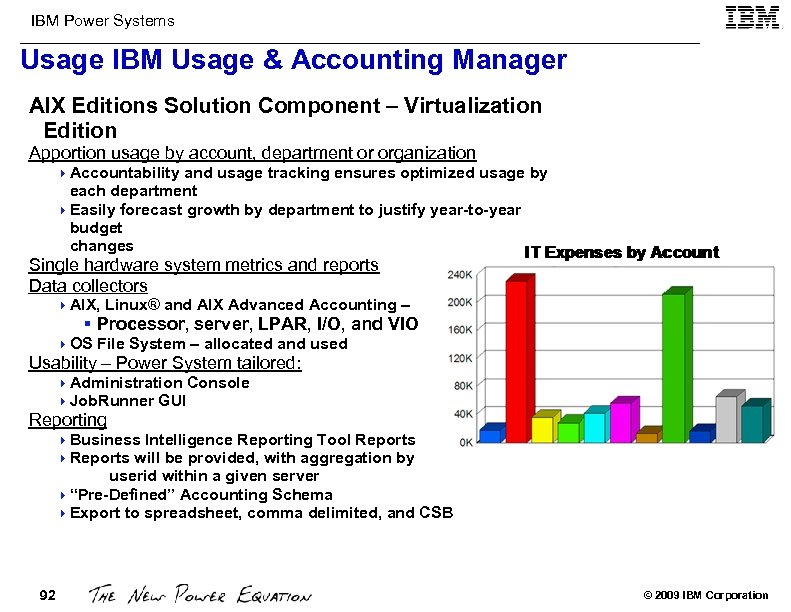
IBM Power Systems Usage IBM Usage & Accounting Manager AIX Editions Solution Component – Virtualization Edition Apportion usage by account, department or organization 4 Accountability and usage tracking ensures optimized usage by each department 4 Easily forecast growth by department to justify year-to-year budget changes Single hardware system metrics and reports Data collectors 4 AIX, Linux® and AIX Advanced Accounting – § Processor, server, LPAR, I/O, and VIO 4 OS File System – allocated and used Usability – Power System tailored: 4 Administration Console 4 Job. Runner GUI Reporting 4 Business Intelligence Reporting Tool Reports 4 Reports will be provided, with aggregation by userid within a given server 4 “Pre-Defined” Accounting Schema 4 Export to spreadsheet, comma delimited, and CSB 92 © 2009 IBM Corporation
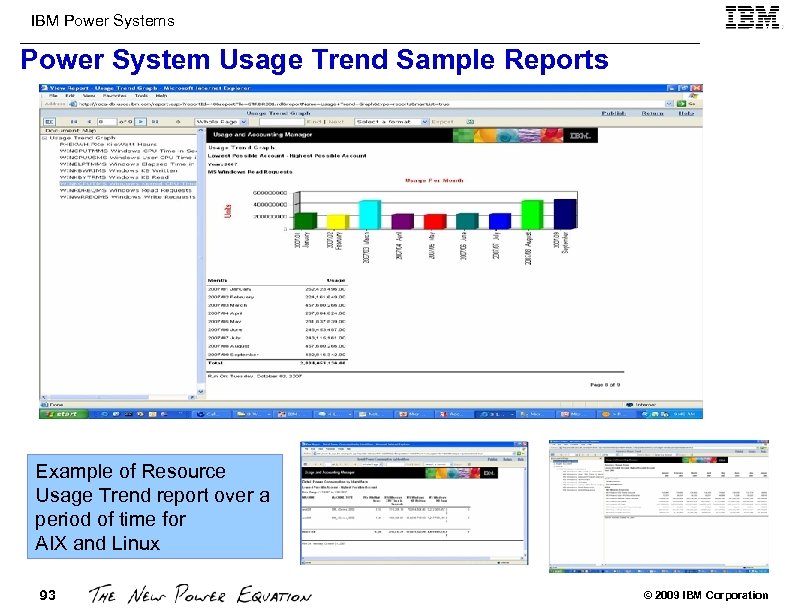
IBM Power Systems Power System Usage Trend Sample Reports Example of Resource Usage Trend report over a period of time for AIX and Linux 93 © 2009 IBM Corporation
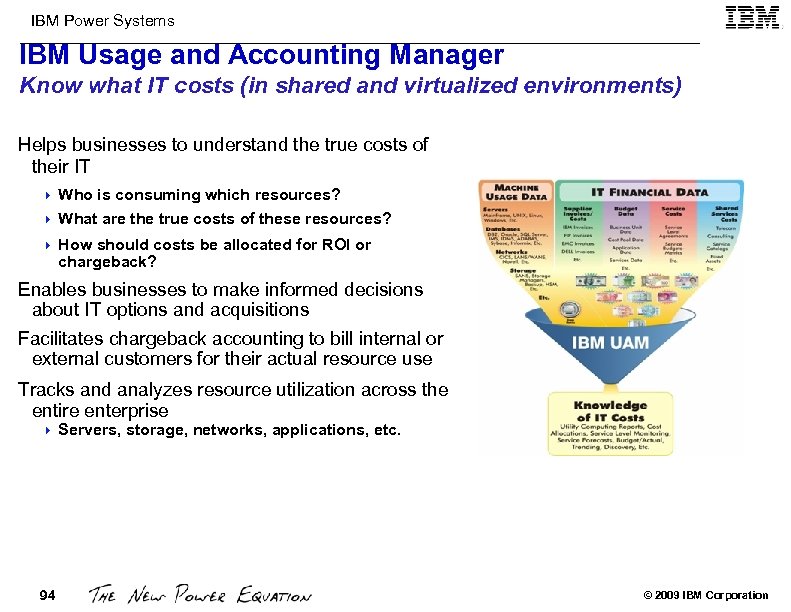
IBM Power Systems IBM Usage and Accounting Manager Know what IT costs (in shared and virtualized environments) Helps businesses to understand the true costs of their IT Who is consuming which resources? 4 What are the true costs of these resources? 4 4 How should costs be allocated for ROI or chargeback? Enables businesses to make informed decisions about IT options and acquisitions Facilitates chargeback accounting to bill internal or external customers for their actual resource use Tracks and analyzes resource utilization across the entire enterprise 4 94 Servers, storage, networks, applications, etc. © 2009 IBM Corporation
IBM Power Systems References 1. Power Systems Technical University Presentations 2. AIX, VIOS and HMC Facts and Features http: //www. ibm. com/support/techdocs/atsmastr. nsf/Web. Index/TD 103130 3. IBM Infocenter http: //www-03. ibm. com/systems/p/support/index. html 4. Business Value of Power Systems http: //w 3. ibm. com/support/techdocs/atsmastr. nsf/Web. Index/PRS 3655 http: //cattail. cambridge. ibm. com/cattail/? source=v#view=rsingh@us. ibm. com 5. AIX Excellence http: //w 3 -03. ibm. com/support/techdocs/atsmastr. nsf/Web. Index/PRS 3764 http: //cattail. cambridge. ibm. com/cattail/? source=v#view=rsingh@us. ibm. com 6. IBM STG Sales Presentations 95 © 2009 IBM Corporation
IBM Power Systems 96 © 2009 IBM Corporation
IBM Power Systems Special Notices This document was developed for IBM offerings in the United States as of the date of publication. IBM may not make these offerings available in other countries, and the information is subject to change without notice. Consult your local IBM business contact for information on the IBM offerings available in your area. Information in this document concerning non-IBM products was obtained from the suppliers of these products or other public sources. Questions on the capabilities of non-IBM products should be addressed to the suppliers of those products. IBM may have patents or pending patent applications covering subject matter in this document. The furnishing of this document does not give you any license to these patents. Send license inquires, in writing, to IBM Director of Licensing, IBM Corporation, New Castle Drive, Armonk, NY 10504 -1785 USA. All statements regarding IBM future direction and intent are subject to change or withdrawal without notice, and represent goals and objectives only. The information contained in this document has not been submitted to any formal IBM test and is provided "AS IS" with no warranties or guarantees either expressed or implied. All examples cited or described in this document are presented as illustrations of the manner in which some IBM products can be used and the results that may be achieved. Actual environmental costs and performance characteristics will vary depending on individual client configurations and conditions. IBM Global Financing offerings are provided through IBM Credit Corporation in the United States and other IBM subsidiaries and divisions worldwide to qualified commercial and government clients. Rates are based on a client's credit rating, financing terms, offering type, equipment type and options, and may vary by country. Other restrictions may apply. Rates and offerings are subject to change, extension or withdrawal without notice. IBM is not responsible for printing errors in this document that result in pricing or information inaccuracies. All prices shown are IBM's United States suggested list prices and are subject to change without notice; reseller prices may vary. IBM hardware products are manufactured from new parts, or new and serviceable used parts. Regardless, our warranty terms apply. Any performance data contained in this document was determined in a controlled environment. Actual results may vary significantly and are dependent on many factors including system hardware configuration and software design and configuration. Some measurements quoted in this document may have been made on development-level systems. There is no guarantee these measurements will be the same on generallyavailable systems. Some measurements quoted in this document may have been estimated through extrapolation. Users of this document should verify the applicable data for their specific environment. Revised September 26, 2006 97 © 2009 IBM Corporation
IBM Power Systems Special Notices (Cont. ) The following terms are registered trademarks of International Business Machines Corporation in the United States and/or other countries: AIX, AIX/L (logo), AIX 6 (logo), alpha. Works, AS/400, Blade. Center, Blue Gene, Blue Lightning, C Set++, CICS/6000, Cluster. Proven, CT/2, Data. Hub, Data. Joiner, DB 2, DEEP BLUE, developer. Works, Direct. Talk, Domino, DYNIX/ptx, e business (logo), e(logo)business, e(logo)server, Enterprise Storage Server, ESCON, Flash. Copy, GDDM, i 5/OS (logo), IBM, IBM (logo), ibm. com, IBM Business Partner (logo), Informix, Intelli. Station, IQ-Link, LANStreamer, Load. Leveler, Lotus Notes, Lotusphere, Magstar, Media. Streamer, Micro Channel, MQSeries, Net. Data, Netfinity, Net. View, Network Station, Notes, NUMA-Q, Open. Power, Operating System/2, Operating System/400, OS/2, OS/390, OS/400, Parallel Sysplex, Partner. Link, Partner. World, Passport Advantage, POWERparallel, Power PC 603, Power PC 604, Power. PC (logo), Predictive Failure Analysis, p. Series, PTX, ptx/ADMIN, Quick Place, Rational, RETAIN, RISC System/6000, RS/6000, RT Personal Computer, S/390, Sametime, Scalable POWERparallel Systems, Secure. Way, Sequent, Server. Proven, Space. Ball, System/390, The Engines of e-business, THINK, Tivoli (logo), Tivoli Management Environment, Tivoli Ready (logo), TME, Total. Storage, TURBOWAYS, Visual. Age, Web. Sphere, x. Series, z/OS, z. Series. The following terms are trademarks of International Business Machines Corporation in the United States and/or other countries: Advanced Micro-Partitioning, AIX 5 L, AIX PVMe, AS/400 e, Calibrated Vectored Cooling, Chiphopper, Chipkill, Cloudscape, Data. Power, DB 2 OLAP Server, DB 2 Universal Database, DFDSM, DFSORT, DS 4000, DS 6000, DS 8000, e-business (logo), e-business on demand, Energy. Scale, Enterprise Workload Manager, e. Server, Express Middleware, Express Portfolio, Express Servers, Express Servers and Storage, General Purpose File System, Giga. Processor, GPFS, HACMP/6000, IBM Systems Director Active Energy Manager, IBM Total. Storage Proven, IBMLink, IMS, Intelligent Miner, i. Series, Micro-Partitioning, NUMACenter, On Demand Business logo, POWER, Power. Executive, Power. VM (logo), Power Architecture, Power Everywhere, Power Family, POWER Hypervisor, Power PC, Power Systems (logo), Power Systems Software (logo), Power. PC Architecture, Power. PC 603 e, Power. PC 604, Power. PC 750, POWER 2 Architecture, POWER 3, POWER 4+, POWER 5, POWER 5+, POWER 6+, pure XML, Quickr, Redbooks, Sequent (logo), Sequent. LINK, Server Advantage, Serve. RAID, Service Director, Smooth. Start, SP, System i, System i 5, System p 5, System Storage, System z 9, S/390 Parallel Enterprise Server, Tivoli Enterprise, TME 10, Total. Storage Proven, Ultramedia, Video. Charger, Virtualization Engine, Visualization Data Explorer, Workload Partitions Manager, X-Architecture, z/9. A full list of U. S. trademarks owned by IBM may be found at: http: //www. ibm. com/legal/copytrade. shtml. The Power Architecture and Power. org wordmarks and the Power and Power. org logos and related marks are trademarks and service marks licensed by Power. org. UNIX is a registered trademark of The Open Group in the United States, other countries or both. Linux is a trademark of Linus Torvalds in the United States, other countries or both. Microsoft, Windows NT and the Windows logo are registered trademarks of Microsoft Corporation in the United States, other countries or both. Intel, Itanium, Pentium are registered trademarks and Xeon is a trademark of Intel Corporation or its subsidiaries in the United States, other countries or both. AMD Opteron is a trademark of Advanced Micro Devices, Inc. Java and all Java-based trademarks and logos are trademarks of Sun Microsystems, Inc. in the United States, other countries or both. TPC-C and TPC-H are trademarks of the Transaction Performance Processing Council (TPPC). SPECint, SPECfp, SPECjbb, SPECweb, SPECj. App. Server, SPEC OMP, SPECviewperf, SPECapc, SPEChpc, SPECjvm, SPECmail, SPECimap and SPECsfs are trademarks of the Standard Performance Evaluation Corp (SPEC). Net. Bench is a registered trademark of Ziff Davis Media in the United States, other countries or both. Alti. Vec is a trademark of Freescale Semiconductor, Inc. Cell Broadband Engine is a trademark of Sony Computer Entertainment Inc. Infini. Band, Infini. Band Trade Association and the Infini. Band design marks are trademarks and/or service marks of the Infini. Band Trade Association. Other company, product and service names may be trademarks or service marks of others. Revised January 15, 2008 98 © 2009 IBM Corporation
IBM Power Systems Notes on Benchmarks and Values The benchmarks and values shown herein were derived using particular, well configured, development-level computer systems. Unless otherwise indicated for a system, the values were derived using external cache, if external cache is supported on the system. Buyers should consult other sources of information to evaluate the performance of systems they are considering buying and should consider conducting application oriented testing. For additional information about the benchmarks, values and systems tested, contact your local IBM office or IBM authorized reseller or access the following on the Web: TPC http: //www. tpc. org Linpack http: //www. netlib. no/netlib/benchmark/performance. ps Pro/E http: //www. proe. com SPEC http: //www. spec. org GPC http: //www. spec. org/gpc Notes. Bench Mail http: //www. notesbench. org Volano. Mark http: //www. volano. com STREAM http: //www. cs. virginia. edu/stream/ Unless otherwise indicated for a system, the performance benchmarks were conducted using AIX V 4. 3 or AIX . IBM C Set++ for AIX and IBM XL FORTRAN for AIX with optimization were the compilers used in the benchmark tests. The preprocessors used in some benchmark tests include KAP 3. 2 for FORTRAN and KAP/C 1. 4. 2 from Kuck & Associates and VAST-2 v 4. 01 X 8 from Pacific-Sierra Research. The preprocessors were purchased separately from these vendors. Other software packages like IBM ESSL for AIX and MASS for AIX were also used in some benchmarks. The following SPEC and Linpack benchmarks reflect microprocessor, memory architecture, and compiler performance of the tested system (XX is either 95 or 2000): –SPECint. XX - SPEC component-level benchmark that measures integer performance. Result is the geometric mean of eight tests comprising the CINTXX benchmark suite. All of these are written in the C language. SPECint_base. XX is the result of the same tests as CINTXX with a maximum of four compiler flags that must be used in all eight tests. –SPECint_rate. XX - Geometric average of the eight SPEC rates from the SPEC integer tests (CINTXX). SPECint_base_rate. XX is the result of the same tests as CINTXX with a maximum of four compiler flags that must be used in all eight tests. –SPECfp. XX - SPEC component-level benchmark that measures floating-point performance. Result is the geometric mean of ten tests, all written in FORTRAN, included in the CFPXX benchmark suite. SPECfp_base. XX is the result of the same tests as CFPXX with a maximum of four compiler flags that must be used in all ten tests. –SPECfp_rate. XX - Geometric average of the ten SPEC rates from SPEC floating-point tests (CFPXX). SPECfp_base_rate. XX is the result of the same tests as CFPXX with a maximum of four compiler flags that must be used in all ten tests. –SPECweb 96 - Maximum number of Hypertext Transfer Protocol (HTTP) operations per second achieved on the SPECweb 96 benchmark without significant degradation of response time. The Web server software is ZEUS v. 1. 1 from Zeus Technology Ltd. –SPECweb 99 - Number of conforming, simultaneous connections the Web server can support using a predefined workload. The SPECweb 99 test harness emulates clients sending the HTTP requests in the workload over slow Internet connections to the Web server. The Web server software is Zeus from Zeus Technology Ltd. –SPECweb 99_SSL - Number of conforming, simultaneous SSL encryption/decryption connections the Web server can support using a predefined workload. The Web server software is Zeus from Zeus Technology Ltd. –SPEC OMP 2001 - Measures performance based on Open. MP applications. –SPECsfs 97_R 1 - Measures speed and request-handling capabilities of NFS (network file server) computers. Revised September 24, 2003 99 © 2009 IBM Corporation
IBM Power Systems Notes on Benchmarks and Values (Cont. ) –SPECj. App. Server 200 X (where X is 1 or 2) - Measures the performance of Java Enterprise Application Servers using a subset of J 2 EE APIs in a complete end-to-end Web application. The Linpack benchmark measures floating-point performance of a system. –Linpack DP (Double Precision) - n=100 is the array size. The results are measured in megaflops (MFLOPS). –Linpack SP (Single Precision) - n=100 is the array size. The results are measured in MFLOPS. –Linpack TPP (Toward Peak Performance) - n=1, 000 is the array size. The results are measured in MFLOPS. –Linpack HPC (Highly Parallel Computing) - solves the largest system of linear equations possible. The results are measured in GFLOPS. STREAM measures sustainable memory bandwidth in high performance computers. Volano. Mark is a 100% pure Java server benchmark that creates long-lasting network client connections in groups of 20 and measures how long it takes for the clients to take turns broadcasting their messages to the group. The benchmark reports a score as the average number of messages transferred by the server per second. –The following Transaction Processing Performance Council (TPC) benchmarks reflect the performance of the microprocessor, memory subsystem, disk subsystem, and some portions of the network: –tpm. C - TPC Benchmark C throughput measured as the average number of transactions processed per minute during a valid TPC-C configuration run of at least twenty minutes. –$/tpm. C - TPC Benchmark C price/performance ratio reflects the estimated five year total cost of ownership for system hardware, software, and maintenance and is determined by dividing such estimated total cost by the tpm. C for the system. –Qpp. H is the power metric of TPC-H and is based on a geometric mean of the 17 TPC-H queries, the insert test, and the delete test. It measures the ability of the system to give a single user the best possible response time by harnessing all available resources. Qpp. H is scaled based on database size from 30 GB to 10 TB. –Qth. H is the throughput metric of TPC-H and is a classical throughput measurement characterizing the ability of the system to support a multiuser workload in a balanced way. A number of query users is chosen, each of which must execute the full set of 17 queries in a different order. In the background, there is an update stream running a series of insert/delete operations. Qth. H is scaled based on the database size from 30 GB to 10 TB. –$/Qph. H is the price/performance metric for the TPC-H benchmark where Qph. H is the geometric mean of Qpp. H and Qth. H. The price is the fiveyear cost of ownership for the tested configuration and includes maintenance and software support. Revised January 9, 2003 100 © 2009 IBM Corporation
IBM Power Systems Notes on Benchmarks and Values (Cont. ) The following graphics benchmarks reflect the performance of the microprocessor, memory subsystem, and graphics adapter: –SPECxpc results - Xmark 93 is the weighted geometric mean of 447 tests executed in the x 11 perf suite and is an indicator of 2 D graphics performance in an X environment. Larger values indicate better performance. –SPECplb results (gra. PHIGS) - PLBwire 93 and PLBsurf 93 are geometric means of literal and optimized Picture Level Benchmark (PLB) tests for 3 D wireframe and 3 D surface tests, respectively. Larger values indicate better performance. –SPECopc results - Viewperf 7 (3 dsmax-01, DRV-08, DX-07, Light-05, Pro. E-01, UGS-01) and Viewperf 6. 1. 2 (AWadvs-04, DRV-07, DX 06, Light-04, med. MCAD-01, Pro. CDRS-03) are weighted geometric means of individual viewset metrics. Larger values indicate better performance. The following graphics benchmarks reflect the performance of the microprocessor, memory subsystem, graphics adapter and disk subsystem. –SPECapc Pro/Engineer 2000 i 2 results - PROE 2000 I 2_2000370 was developed by the SPECapc committee to measure UNIX and Windows workstations in a comparable real-world environment. Larger numbers indicate better performance. The Notes. Bench Mail workload simulates users reading and sending mail. A simulated user will execute a prescribed set of functions 4 times per hour and will generate mail traffic about every 90 minutes. Performance metrics are: –Notes. Mark - transactions/minute (TPM). –Notes. Bench users - number of client (user) sessions being simulated by the Notes. Bench workload. –$/Notes. Mark - ratio of total system cost divided by the Notes. Mark (TPM) achieved on the Mail workload. –$/User - ratio of total system cost divided by the number of client sessions successfully simulated for the Notes. Bench Mail workload measured. Total system cost is the price of the server under test to the customer, including hardware, operating system, and Domino Server licenses. Application Benchmarks –SAP - Benchmark overview information: http: // www. sap-ag. de/solutions/technology/bench. htm; Benchmark White Paper September, 2000; – http: //www. sap-ag. de/solutions/technology/pdf/50020428. pdf –People. Soft - To get information on People. Soft benchmarks, contact People. Soft directly or the People. Soft/IBM International Competency Center in San Mateo, CA. –Oracle Applications - Benchmark overview information: http: //www. oracle. com/apps_benchmark/ –Baan - The Baan benchmark demonstrates the scalability of Baan ERP solutions. The test results provide the number of Baan Reference Users (BRUs) that can be supported on a specific system. BRU is a single on-line user or a batch unit workload. These metrics are consistent with those used internally by both IBM and Baan to size systems. To get information on Baan benchmarks, contact Baan directly or the IBM/Baan International Competency Center in San Mateo, CA. Revised May 28, 2003 –J. D. Edwards Applications - Product overview information at http: //www. jdedwards. com 101 © 2009 IBM Corporation
IBM Power Systems Notes on Performance Estimates r. Perf (Relative Performance) is an estimate of commercial processing performance relative to other p. Series systems. It is derived from an IBM analytical model which uses characteristics from IBM internal workloads, TPC and SPEC benchmarks. The r. Perf model is not intended to represent any specific public benchmark results and should not be reasonably used in that way. The model simulates some of the system operations such as CPU, cache and maximum memory available. However, the model does not simulate disk or network I/O operations. r. Perf estimates are calculated based on systems with maximum memory and the latest levels of AIX and other pertinent software. Actual performance will vary based on configuration details. The p. Series 640 is the baseline reference system and has a value of 1. 0. Although r. Perf may be used to compare estimated IBM UNIX commercial processing performance, actual system performance may vary and is dependent upon many factors including system hardware configuration and software design and configuration. All performance estimates are provided "AS IS" and no warranties or guarantees are expressed or implied by IBM. Buyers should consult other sources of information, including system benchmarks, to evaluate the performance of a system they are considering buying. For additional information about r. Perf, contact your local IBM office or IBM authorized reseller. Revised June 25, 2003 102 © 2009 IBM Corporation
27c778c4c37e707d8e440d10a76dc7ad.ppt