235d3667eb18443e5837622cfeb1deb7.ppt
- Количество слайдов: 41


IBD MEETUP/NORTHRIDGE LET’S MEETUP AND DISCUSS STRATEGY FOR Q 3>Q 4 -2014 AND REVISE OUR WATCHLIST 09/13/2014

DISCLAIMER 1. During the course of this meeting we will review stocks that should be considered as additions to your watch list. 2. These are not trade recommendations. These are candidate trades. Do your own research, keep position sizes modest, and stay diversified. 3. Also past performance is no indication of future stock trends.

TECHNICAL vs FUNDAMENTAL ANALYSIS § Technical Analysis is the study of market action, primarily through the use of charts, for the purpose of forecasting future price trends. Market Action includes: q. Price q. Volume q. Open Interest § Technical Approach is based on 3 premises: q. Market action discounts everything. [cornerstone] q. Prices move in trends. [reflecting supply and demand] • A trend in motion is more likely to continue than to reverse. q. History repeats itself. • Human psychology tends not to change. § Fundamental Analysis examines all the relevant factors influencing Supply and Demand seeking to find Intrinsic Value. If the market is below Intrinsic Value, it is underbought and above it is oversold. § The fundamentalist studies the cause of market movement while the technician studies the effect.

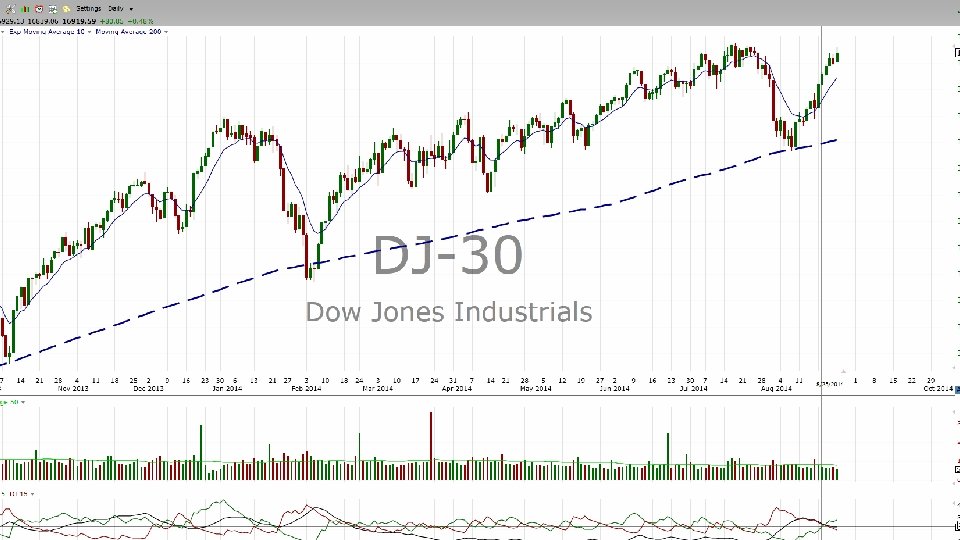
DOW THEORY • An important part of Dow theory is distinguishing the overall direction of the market. To do this, theory uses trend analysis. • Before we can get into the specifics of Dow theory trend analysis, we need to understand trends. • First, it's important to note that while the market tends to move in a general direction, or trend, it doesn't do so in a straight line. • The market will rally up to a high (peak) and then sell off to a low (trough), but will generally move in one direction. • An upward trend is broken up into several rallies, where each rally has a high and a low. • For a market to be considered in an uptrend, each peak in the rally must reach a higher level than the previous rally's peak (HH), and each low in the rally must be higher than the previous rally's low (HL). • A downtrend is the opposite. (LH) & (LL)

PRIMARY TREND • In Dow theory, the primary trend is the major trend of the market, which makes it the most important one to determine. • This is because the overriding trend is the one that affects the movements in stock prices. • The primary trend will also impact the secondary and minor trends within the market. • Dow determined that a primary trend will generally last between one and three years but could vary in some instances. • Regardless of trend length, the primary trend remains in effect until there is a confirmed reversal. • For example, if in an uptrend the price closes below the low of a previously established trough, it could be a sign that the market is headed lower, and not higher. • When reviewing trends, one of the most difficult things to determine is how long the price movement within a primary trend will last before it reverses. • The most important aspect is to identify the direction of this trend and to trade with it, and not against it, until the weight of evidence suggests that the primary trend has reversed.

• SECONDARY, OR INTERMEDIATE, TREND In Dow theory, a primary trend is the main direction in which the market is moving. • Conversely, a secondary trend moves in the opposite direction of the primary trend, or as a correction to the primary trend. For example, an upward primary trend will be composed of secondary downward trends. • This is the movement from a consecutively higher high to a consecutively lower high. In a primary downward trend the secondary trend will be an upward move, or a rally. This is the movement from a consecutively lower low to a consecutively higher low. Right is an illustration of a secondary trend within a primary uptrend. Notice how the short-term highs (shown by the horizontal lines) fail to create successively higher peaks, suggesting that a short-term downtrend is present. • Since the retracement does not fall below the October low, traders would use this to confirm the validity of the correction within a primary uptrend. • In general, a secondary, or intermediate, trend typically lasts between three weeks and three months, while the retracement of the secondary trend generally ranges between one-third to two-thirds of the primary trend's movement. • For example, if the primary upward trend moved the DJIA from 10, 000 to 12, 500 (2, 500 points), the secondary trend would be expected to send the DJIA down at least 833 points (one-third of 2, 500). • Another important characteristic of a secondary trend is that its moves are often more volatile than those of the primary move.

• MINOR TREND The last of the three trend types in Dow theory is the minor trend, which is defined as a market movement lasting less than three weeks. • The minor trend is generally the corrective moves within a secondary move, or those moves that go against the direction of the secondary trend. • Due to its short-term nature and the longer-term focus of Dow theory, the minor trend is not of major concern to Dow theory followers. • But this doesn't mean it is completely irrelevant; the minor trend is watched with the large picture in mind, as these short-term price movements are a part of both the primary and secondary trends. Most proponents of Dow theory focus their attention on the primary and secondary trends, as minor trends tend to include a considerable amount of noise. • If too much focus is placed on minor trends, it can to lead to irrational trading, as traders get distracted by short-term volatility and lose sight of the bigger picture. Stated simply, the greater the time period a trend comprises, the more important the trend.

MAJOR TREND’S THREE PHASES Dow theory -there are three phases to every primary trend – 1. The Accumulation phase (distribution phase)-The first stage of a bull market is referred to as an Accumulation phase, which is the start of the upward trend; the point at which informed investors start to enter the market when the price of the market is at its most attractive level. 2. The public Participation phase-During this phase, negative sentiment dissipates as business conditions - marked by earnings growth and strong economic data – improve permeating the market; more and more investors move back in, sending prices higher. This phase tends to be the longest lasting, and the one with the largest price movement as the new upward primary trend has confirmed itself 3. A Panic phase (excess phase)- the one in which the smart money starts to scale back its positions, selling them off to those now entering the market. ("irrational exuberance“). The perception is that everything is running great and that only good things lie ahead; the time when the last of the buyers start to enter the market buying near the top.

DOW SUMMARY • While the Dow Theory is one of the best systems for determining the market’s trend, do not believe in all-or-nothing market-timing, for several reasons: • The Dow Theory is not infallible, and it is not designed to be a foolproof prediction system. • History suggests that when both the Dow Industrials and Dow Transports are reaching significant highs, stocks are likely to continue rising. When both averages are reaching significant lows, stocks are likely to remain under pressure. But the Dow Theory will nearly always be bullish at the market’s absolute top — and bearish at the bottom. • The Dow Theory should be viewed as a system, not a divining rod. Nothing knows where the market is heading, but Dow Theory in a disciplined, moderate manner can help keep the odds in your favor. • Sometimes, the Dow Theory’s verdict is mixed. The Industrials and Transports do not always align.

CONSUMER SENTIMENT

PUT/CALL RATIO vs VOLATILITY
 is the value of all goods")
KEY ECONOMIC INDICATORS • Gross Domestic Product (GDP) is the value of all goods and services produced in the U. S. • Producer Price Index measures the change in prices received by the original producer at the wholesale level. • Consumer Price Index measures the change in prices paid by consumers for a representative group of products and services. • ISM Purchasing Manager's Index is a gauge of conditions in the manufacturing sector of the economy. (50)

WHAT IS VIX? VIX is not a measure of historical volatility VIX is a measure of implied volatility which is a forward looking measure Historically VIX has had an inverse relationship with price changes in the S&P 500 VIX has drifted lower when the market is in a bullish phase and tends to move higher when the S&P 500 sells off This inverse relationship is a function of how SPX options are used by market participants See the Chart to the right----

WHAT THE VIX CAN TELL US Possibly some really spectacular opportunities in the weeks ahead as we see this market breakout or breakdown. In the short term, as long as the VIX holds 12. 50, bullish momentum will keep going for the week ahead. If the VIX can close below 11. 50, it will confirm that fresh all-time highs for the S&P 500 Index are on the way. If the bears can break 12. 50, then we’ll be at risk of another downtrend a possible breakdown.

S&P 500 vs VIX

WHAT IS MOMENTUM INVESTING? • Momentum investing involves buying and selling stocks that are likely to witness a substantial jump in prices in a short span of time. In other words, the investor buys stocks that are about to soar and sells them at a much higher price. As a momentum investor, one seeks to identify stocks that have the potential to yield spectacular returns within a short to medium holding period, say, 1 -6 months. • When the market rallies, momentum stocks are usually better placed to lead the market and touch new highs. Typically, the strategy involves capitalising on an existing trend. So, one would try to lock in gains by riding hot stocks, those that are already witnessing a surge in prices, or momentum. Alex Mathews, head of research, Geojit BNP Paribas Financial Services, says, "Momentum investing is essentially about betting on stocks that have already gathered momentum. " • This involves monitoring stock prices daily and cashing out within weeks or months of acquiring the asset. However, this is not as easy as it sounds. Momentum play can be highly misleading and frustrating at times. If you get your calculation wrong, the money may just as easily go down the drain. Without the right tools, getting a fix on such stocks is difficult. Hitesh Sheth, head, technical research, Prabhudas Lilladher, says, "Momentum investing can be rewarding if you can master the use of the indicators available. The strategy can work both ways—you can ride the bull markets as well as benefit from market declines. "

HOW TO SPOT MOMENTUM STOCKS • For those keen on making money from this strategy, there are several indicators or tools that can help identify momentum stocks. However, before learning about these indicators, you must understand the logic behind their functioning. • As anyone driving a car knows, he needs to slow down to change the direction. Likewise, the speed at which a stock is moving up or down will reduce before the final turnaround. The momentum indicators help you capture this reduction in speed. However, a stock that is losing momentum need not necessarily result in a turnaround. Just as a car can slow down, but then accelerate again, so should a loss in momentum be considered as an indication of a possible turnaround. Through the following charts, we explain some simple momentum indicators and a few basic rules. You can start keeping track of the performance of some potential momentum stocks using these tools. Over time, you will be able to spot the stocks that can deliver high, double-digit returns in a few months or even weeks. These indicators are readily available for investors on Websites, such as yahoofinance. com.
 indicator is a basic momentum")
RATE OF CHANGE The rate of change (Ro. C) indicator is a basic momentum oscillator, which measures the speed at which the stock price is changing within a defined time period. It calculates the percentage change between the most recent stock price and the price that existed 'n' periods ago. When plotted as a trendline, it forms an oscillator that fluctuates above and below the zero line as the Ro. C moves from positive to negative. A value greater than zero indicates an increase in upward momentum (spike in Ro. C reflects a sharp uptick in price) and a value less than zero suggests an increase in downward pressure (plunge in Ro. C reflects a sharp fall in price). However, this indicator can be misleading if used in isolation. It should be used in combination with other momentum indicators.

VOLUME Trading volume • Another indicator to be considered is the trading activity around the stock, which is represented by its trading volume. • The stocks that are adequately supported by strong volumes can be assured of continued interest, at least in the near term. • Low trading volumes, on the other hand, indicate lack of interest in the security and, therefore, a lack of momentum. • Usually, momentum investors prefer to buy stocks that are rising with high volume and sell stocks that are falling with high volume. • Volume contains the sum total of all fact and opinion translated into action.

• Volume is one of the most important technical analysis tools to learn and understand how to apply to price movements. • Volume increases every time a buyer and seller transact their stock or futures contract. • Volume has two major premises: • When prices rise or fall, an increase in volume is strong confirmation that the rise or fall in price is real and that the price movement had strength. • When prices rise or fall and there is a decrease in volume, then this is interpreted as being a weak price move. VOLUME

ON BALANCE VOLUME • On Balance Volume measures volume flow. When a stock or ETF closes up, volume is added to the line and when a stock closes down, volume is subtracted from the line. A cumulative total of the volume additions and subtractions form the On Balance Volume line. • The theory behind OBV is based on the distinction between smart money – namely, institutional investors – and less sophisticated retail investors. As mutual funds and pension funds begin to buy into an issue that retail investors are selling, volume may increase even as the price remains relatively level. Eventually, volume drives the price upward. At that point, larger investors begin to sell, and smaller investors begin buying.
 combines price and volume to determine whether price")
• On Balance Volume (OBV) combines price and volume to determine whether price movements are strong or are weak and lacking conviction. • On an up day, the volume is added to the previous day's OBV • On a down day, the volume is subtracted from the previous day's OBV. • Volume is usually interpreted as follows: • Increasing or decreasing price with increasing volume, confirms the trend. • Increasing or decreasing price accompanied by decreasing volume, = price move is weak & lacking conviction. • The OBV indicator is used to confirm price trends or warn of potential price reversals when divergences of the price and the OBV indicator. ON BALANCE VOLUME (OBV)

RELATIVE STRENGTH INDEX - RSI The RSI compares the magnitude of recent gains to recent losses. It is calculated by using the formula, RSI=100 -100/(1+RS), where RS is the average price for 'x' days when the stock closes up divided by the average price of 'x' days when it closes down. RSI ranges from 0 to 100 and a stock is considered to be overbought when this value is above 70, and oversold when it is below 30. However, these are not considered as buy or sell signals because the stock may continue to move, taking the RSI to much higher/lower levels. Like other indicators, a signal is generated when a stock loses its momentum and turns around. In this case, RSI crossing the 70 mark from above is considered a a sell signal and crossing the 30 mark from below is considered a buy signal.
 indicator is used to confirm the")
MACD SIGNAL The moving average convergence divergence (MACD) indicator is used to confirm the buy or sell signals for a particular stock, as given by other indicators, such as relative strength. It shows the relationship between two moving averages of stock prices (usually the 26 -day and 12 -day moving averages). The MACD indicator comprises two lines. The first depicts the movement that is the difference between the two moving averages, while the other is the signal line (usually the 9 -day moving average of the MACD), which is plotted on top of the first line, functioning as the trigger for buy and sell signals. When the MACD falls below the signal line, it is a bearish signal, which indicates that it may be time to sell.

MACD DIVERGENCE Traders employ indicators like the MACD, RSI, etc, to identify divergence between the stock price movement and the respective indicator. For example, if a stock touches a new high, but the MACD fails to do so (that is, the recent MACD high is lower than the previous high), it is called negative divergence. This shows that the buying momentum has slowed down in the counter and, therefore, the uptrend in the stock price may be coming to an end. Likewise, positive divergence occurs when a stock makes a new low, but its MACD fails to make one. This implies that selling pressure has receded and that the downtrend in the counter may not continue for long.

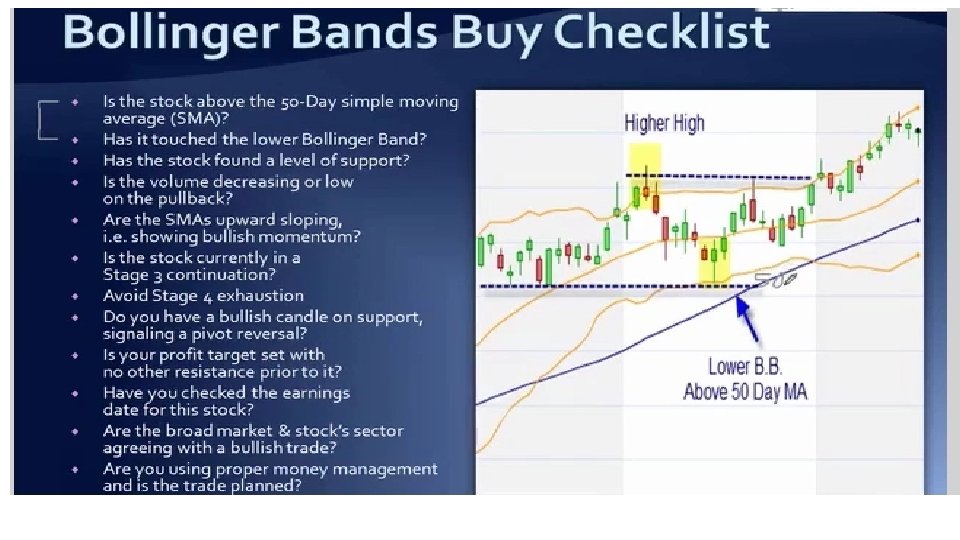
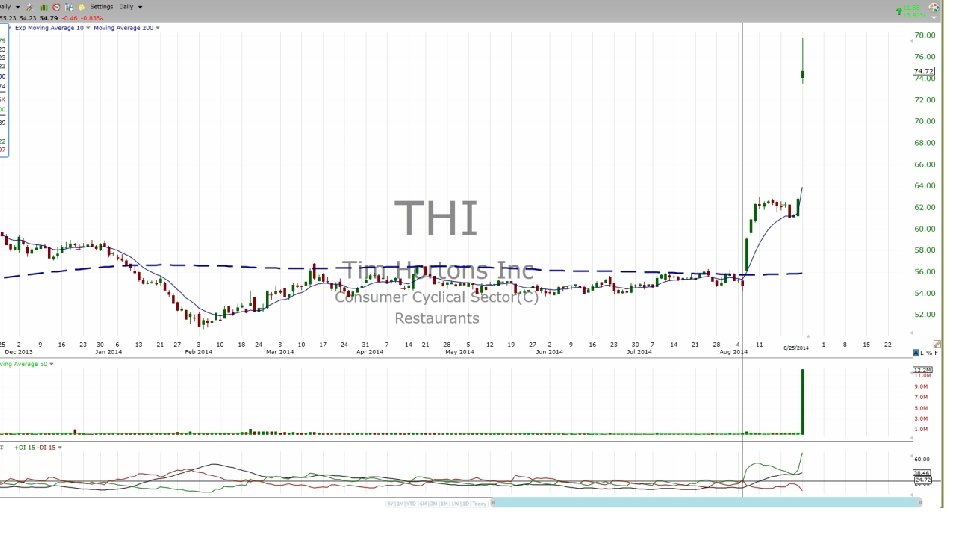
BOLLINGER BAND SIMPLE STRATEGY It has been found that buying the breaks of the lower Bollinger Band® is a way to take advantage of oversold conditions. Usually, once a lower band has been broken due to heavy selling, the price of the stock will revert back above the lower band head toward the middle band. This is the exact scenario this strategy attempts to profit from. The strategy calls for a close below the lower band, which is then used as an immediate signal to buy the stock the next day.

TRADING WITH BOLLINGER BANDS Bollinger upper and lower bands close to each other in the area of white arrows makes a narrow range a breakout that can be the beginning of a big trend. You can easily predict the direction of the breakout with the signals that the market already has shown. Just follow the numbers at the image. The candlestick #1 has a long lower shadow. What does that mean? It means a big Bullish pressure is imposed to the market suddenly. So the price wants to go up. This is the first signal. You could take a long position after this candle but the market would show you some more signals to go long. After candle #1, market becomes slow and Bollinger upper and lower bands become so close to each other. Candle #2 shows a breakdown with the Bollinger lower band but it is closed above it. This candle also has a long lower shadow that reflects the upward pressure. Then the market becomes slow for several candles BUT candle #3 assures you that the range is broken up. So if you didn’t have a long position, you could go long at the close of #3 candle. Then some red candles are appeared but you should know that after a range breakout, the very first reversal signal is not in fact a reversal signal. It is a continuation signal.

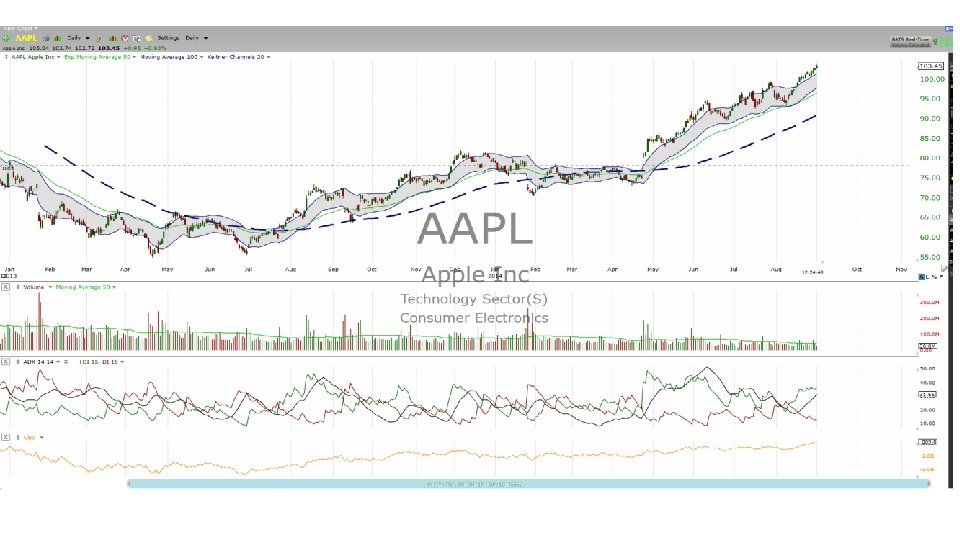
KELTNER CHANNELS • Keltner Channels are volatility-based envelopes set above and below an exponential moving average. • Similar to Bollinger Bands, which use the standard deviation to set the bands, Keltner Channels use the Average True Range (ATR) to set channel distance. • The channels are typically set two Average True Range values above and below the 20 -day EMA. • The exponential moving average dictates direction and the Average True Range sets channel width. • Keltner Channels are a trend following indicator used to identify reversals with channel breakouts and channel direction. • Channels can also be used to identify overbought and oversold levels when the trend is flat. • Trends often start with strong moves in one direction or another. A surge above the upper channel line shows extraordinary strength, while a plunge below the lower channel line shows extraordinary weakness. Such strong moves can signal the end of one trend and the beginning of another.

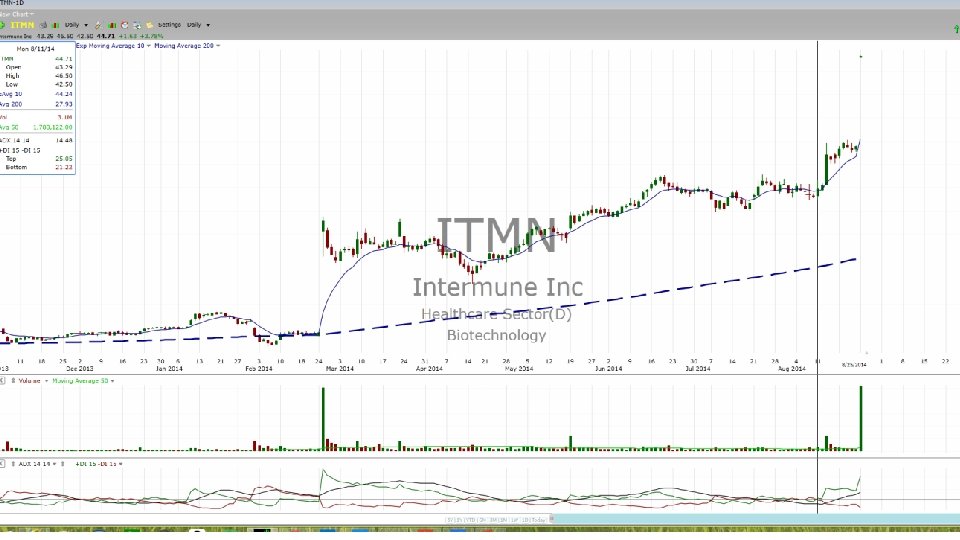
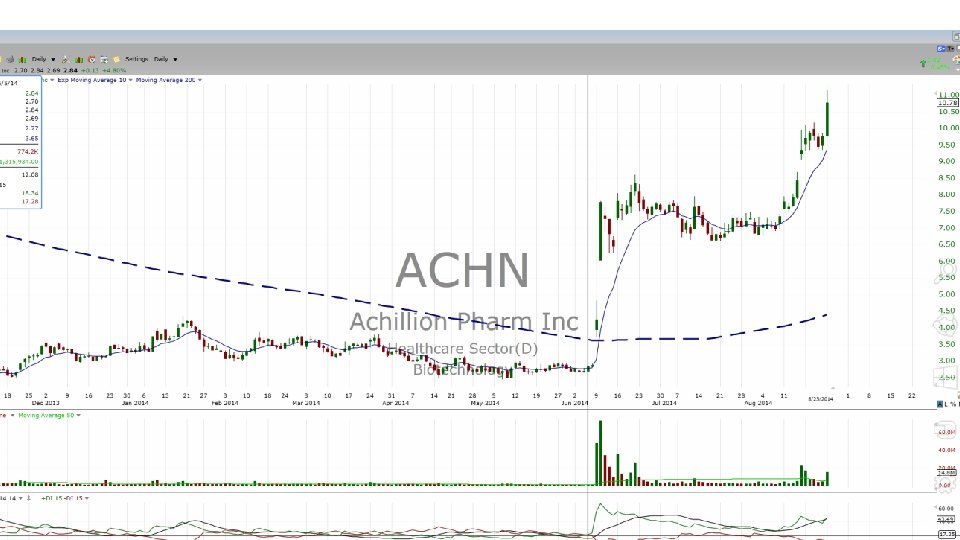
SPRINGBOARD A candlestick buy signal that only Techni. Trader teaches. It is called the springboard and it occurs often in lower priced stocks poised to move up quickly. It is a very reliable candlestick buy signal based on a group of candles forming in a specific way. The volume and institutional accumulation indicators-the bars below confirm there is sufficient energy and buying activity behind the price to move it up for good swing trade profits.

SPRINGBOARD And the stock moves up quickly for swing trade profits.
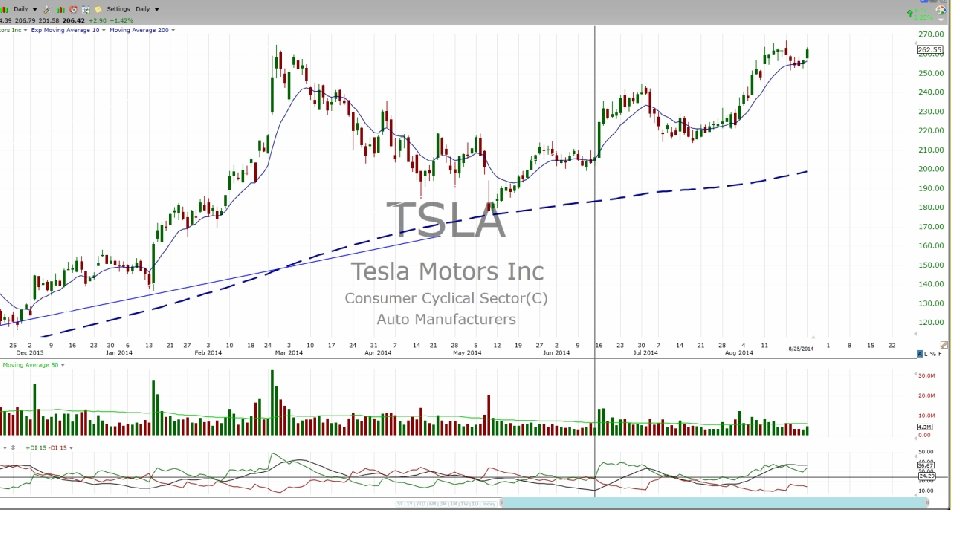

EXAMPLE • As of 8/8/14 TSLA was trading at $250, and you are convinced that TSLA is going to be substantially higher within a year or two. • Buy the stock outright, receiving roughly 80 shares of common stock for $20, 000. • Or leverage TSLA 2 -1 on margin, bringing your total investment to $40, 000 and 160 shares of stock with an offsetting debt of $20, 000. • Or buy 2 LEAP contracts controlling 200 shares; TSLA Jan 16 250 Calls @ $51, $10, 200. • AS OF 9/12/14 – The LEAP calls were at $67. 29 x 200 = $13, 458 -$10, 200 = $3, 258 = 31. 94% in one month.

WATCHLIST AS OF 9/12/14

NEXT MEETING • IBD WILL HOST THE NEXT MEETING OF THE NORTHRIDGE IBD MEETUP. BE SURE TO RESERVE THE DATE, OCTOBER 11, 2014, AND INVITE YOUR FRIENDS TO ATTEND. • JASON D’AMORE WILL DISCLOSE SOME EXCITING NEW TECHNIQUES DEVELOPED BY IBD.
235d3667eb18443e5837622cfeb1deb7.ppt