

ab5f978361d8db1b1c58a2f05ddf8f8e.ppt
- Количество слайдов: 132
 IAAO Mass Appraisal Standard and How Our World Has Changed Presented to: 2011 NCRAAO Annual Conference by George Donatello, CMS Principal Consultant TEAM Consulting Villa Rica, GA and Pete Davis Ratio Study and GIS Manager Kansas Department of Revenue Topeka, KS
 IAAO Mass Appraisal Standard Section 3. 3. 5 – Jurisdictions may employ a set of digital image technology tools to replace a routine cyclical field inspection with a computer assisted office review. This tool set should include: • High-resolution street-view images (at a sub-inch pixel resolution that enables quality grade and physical condition to be verified, updated at least every 6 years) • Orthophoto images (minimum 6” pixel resolution in urban/suburban and 12” resolution in rural areas, updated every 2 years in rapid growth areas, or 6– 10 years in slow growth areas). • Low level oblique images capable of being used for measurement verification (four cardinal directions, minimum 6” pixel resolution in urban/suburban and 12” pixel resolution in rural areas, updated every 2 years in rapid growth areas or, 6– 10 years in slow growth areas). – – Effective tool sets validate CAMA data and incorporate change detection software that compares building dimension data (footprints) in the CAMA system to georeferenced imagery or remote sensing data from sources (such as Li. DAR [light detection and ranging]) and identify potential CAMA sketch discrepancies for further investigation. Changes to interior characteristics may be monitored on a regular and cyclical basis (such as every 6 years). This alternative should be used in conjunction with information obtained through the permitting process, where available. In addition, appraisers should visit assigned areas on an annual basis to observe changes in neighborhood condition, trends and property characteristics. A physical review is recommended when significant construction changes are detected, a property is sold, or an area is affected by catastrophic damage.
 What Does Section 3. 3. 5 Say? “Jurisdictions may employ a set of digital image technology tools to replace a routine cyclical field inspection with a computer assisted office review. ”
 Why was Section 3. 3. 5 needed? 1. Remote sensing 2. Advent of NEW technology 3. Efficiency 4. Work flow 5. Good results 6. Cost, Cost
 Prerequisites and limitations? 1. Must have something to verify 2. Embrace workflow 3. Maintenance plan 4. Don’t try to do to much 5. Still have to do field reviews 6. Interior information is always a problem
 What is Remote Sensing? “Remote sensing is “ the stand-off collection through the use of a variety of devices for gathering information on a given object. ”
 State of the Art Camera Systems
 What are the IMPORTANT remote sensing tools?
 Oblique Image
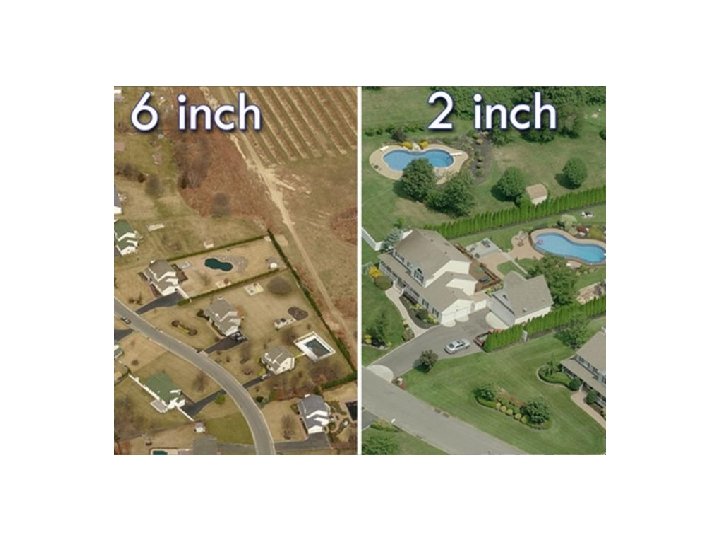
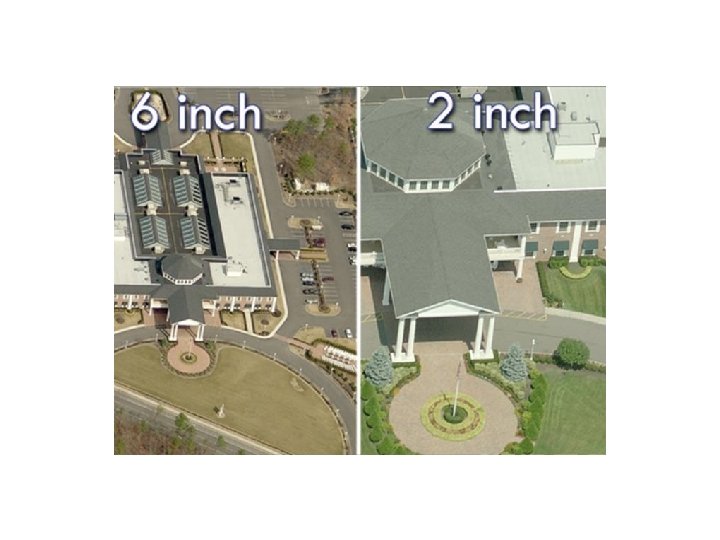
 Ortho Photo • 6” pixel resolution in urban/suburban • 12” resolution in rural areas • updated every 2 years in rapid growth areas (urban areas) • 6– 10 years in slow growth areas (rural areas)
 Change Detection “Effective tool sets validate CAMA data and incorporate change detection software that compares building dimension data (footprints) in the CAMA system to georeferenced imagery or remote sensing data from sources (such as Li. DAR [light detection and ranging]) and identify potential CAMA sketch discrepancies for further investigation. ” IAAO
 Li. DAR Intelligent Surface Model After the ISM process, a Mask version of an ISM showing structure outlines is generated
 Two Change Detection Methodologies in Current Use
 is a process that") Photo to Photo “Change detection for GIS (geographical information systems) is a process that measures how the attributes of a particular area have changed between two or more time periods. Change detection often involves comparing aerial photographs or satellite imagery of the area taken at different times. ” Wikepedia
Photo to Photo “Change detection for GIS (geographical information systems) is a process that measures how the attributes of a particular area have changed between two or more time periods. Change detection often involves comparing aerial photographs or satellite imagery of the area taken at different times. ” Wikepedia
 Change. Findr
 CAMA/Photogrammetric Analysis
 CAMA Sketch Comparison • • • Unique way of looking at assessment data Compare CAMA with today's reality Your sketch and your ortho Base line of information Multiple products Low investment
 The Process • • Sketch is converted to shape file Moved to paracentroid Visually rotated and placed over ortho Anchored and georeferenced Exception noted Returned as a GIS layer Further analysis
 Not a Good Fit
 Yotta Sketch. Right
 Pictometry Change. Findr
 Apex Sketch
 Sketch Validation
 Stats From Geauga Co. OH Project • • • Parcels Matched 13791 96. 0% Minor Problem 293 2. 0% Major Error 107 . 7% Obstructed View 93 . 6% New construction 24 . 2% Questionable 5 . 1% Note: Second time project done in 5 years
") Stats from Pasco Co. FL Project • • • MATCHED 8352 83% UNMATCHED (1) 988 10% OBSTRUCTED VIEW (2) 354 4% QUESTIONABLE 136 1% UNABLE TO PROCESS 242 2% (1) 70 -80% of the unmatched can be solved with obliques and PRC (2) 80% of obstructed view can be solved with oblique image Note. This was a 10, 000 parcel pilot and county gave us the most difficult area to test. Propety Appraiser said that he had perfect data…. no errors!
Stats from Pasco Co. FL Project • • • MATCHED 8352 83% UNMATCHED (1) 988 10% OBSTRUCTED VIEW (2) 354 4% QUESTIONABLE 136 1% UNABLE TO PROCESS 242 2% (1) 70 -80% of the unmatched can be solved with obliques and PRC (2) 80% of obstructed view can be solved with oblique image Note. This was a 10, 000 parcel pilot and county gave us the most difficult area to test. Propety Appraiser said that he had perfect data…. no errors!
 Match w/ Foliage
 No Match
 Obstructed View
 CAMA/Photogrammetric Feature List THIS IS WHAT YOU WANT TO RECEIVE! • • • Viewing software Measure on ortho Exception list Data analysis Report features Shape file
 Metrics 1. Rapid high volume delivery 2. 400 plus parcels per day production 3. 10 -20 % error rate 4. Cost less than ONE Dollar per parcel 5. 1: 5 and HIGHER ROI $$$$$
 Sub Inch Pixel High Resolution Street View Imagery
 Grade and Condition Grade and Condition Harris Co. TX Appraisal Manual “The grade is a factor that is intended to reflect an overall judgment of the quality of workmanship and materials evident in a dwelling. ” “The physical condition is a rating which is intended to reflect a judgment of the overall physical condition of the dwelling relative to its age and considers the level of maintenance that you would normally expect to find in a dwelling of a given age. ”
 Types of Imagery
 Yotta
Yotta
 Ilookabout
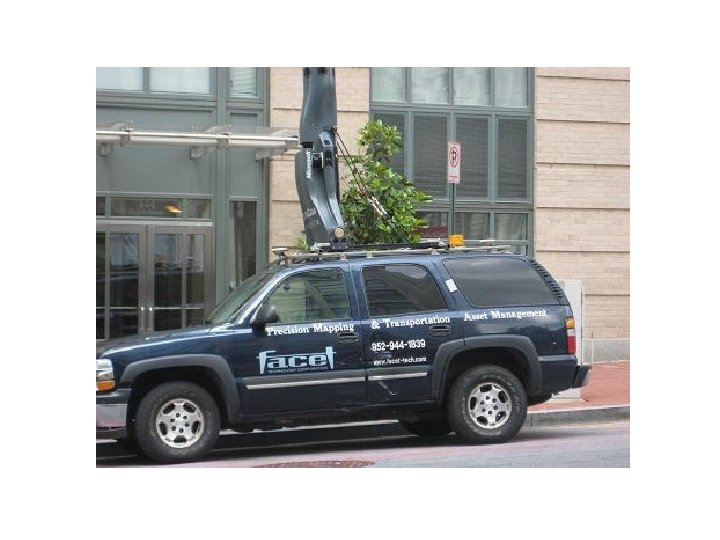
 Facet
Facet
 Pictometry Screen
 Oblique Image
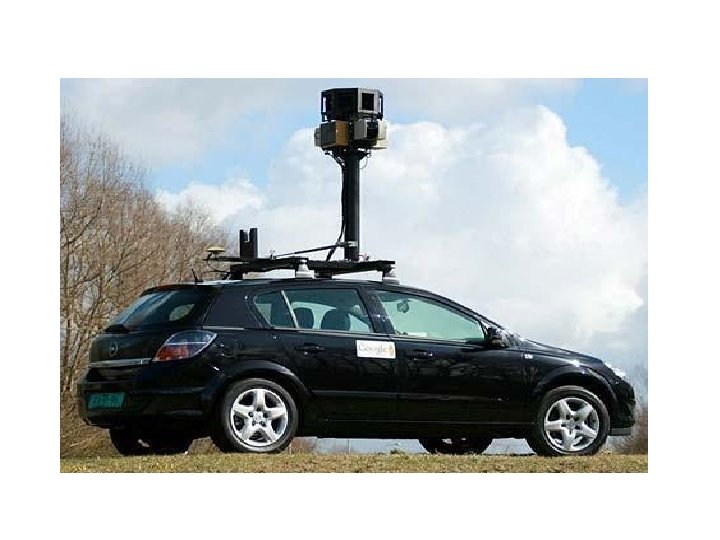
 Image Capture Vehicles
 Street View Imagery 1. Vehicle Stops at Each Structure 2. Address Verified 3. X, Y Coordinate Placed 4. Images are Labeled 5. Attribute Data Added •
 Other Deliverables from Street View Imagery • • • Construction data Yard improvements Address verification Street center line Cadastral review X, Y Coordinate placement • Personal property location • Viewer/analysis
 Address Verification §Site address and street centerline field verified §Collected in NENA or custom format §XY coordinate placed to customers specification Identify / Verify / Corrected Street Name Corrected Land-use Multiple Address Corrected Number Confirmed or Unverified
 Business Personal Property Find New Tax Revenue Unlicensed Businesses Non-Filing Businesses Secondary Addressing for Commercial Parcels Located with XY Coordinate Cross Reference to BPP List Identify for Audit
 Location and ID of Special Structures Billboards – Locate with XY Coordinate, Identify Real Estate or Business Personal Property, and Planning and Zoning Enforcement Cell Towers – Property Tax Administration, Location for Emergency Services and Phase II Wireless Compliance
 Secondary Unit Addressing Washington DC Condominium Complex Multiple Family Addressing Address and XY Coordinate for Each Unit Site Map Obtained from Property Management Map Not Available - Others are Walked to Confirm Mobile Home Park – Each space is collected Commercial – Each street level address
 Highways - Roadway Asset Inventory and Mapping Record & Measure Roadside Assets GASB 34 Implementation 3 D Measurement of Objects Asset Condition Assessment Map - Speed Limits, Number of Lanes, Traffic Signals, Roadway Restrictions Visual Record & Review Tools
 Emergency 911 Planning XY Points for Every Business and Residence Street View Address in NENA Format Address Linked to Centerline Identify Critical Infrastructure
 Frequency of Update “High-resolution street-view images (at a sub-inch pixel resolution that enables quality grade and physical condition to be verified, updated at least every 6 years. ”
 Quality Control Is it or isn’t it? 1. 2. 3. 4. 5. 6. Must be able to see the structure Sun angle Clarity People Front and one side Sub-inch pixel
 How do I Measure Sub Inch Pixel?
 The Calculations • Canon 10 mp camera • 3648 x 2736 pixel screen resolution • Building is 47’ long (from plat) • Building front takes up 80% of screen or 2198 pixels (. 80*3648) • 2198 pixels equal (47’*12’’) 564” • 1 pixel equals. 192” (564”/2198 pix)
 Street View Image Feature List • • Photo Address verification Exception list Viewing software Data analysis Measurement tool Report writer
 What You Must Think About? • • • Cost…. ”You get what you pay for. ” Quality…. . Must be sub-inch pixel You pick and choose Tax payers in image…especially children Foliage, sun, obstructions Additional information • Partners
 Street View Image
 Oblique Imagery “The GAME Changer” “Aerial photography is the taking of photographs of the ground from an elevated position. Photographs taken at an angle are called oblique photographs. ” Wikipedia
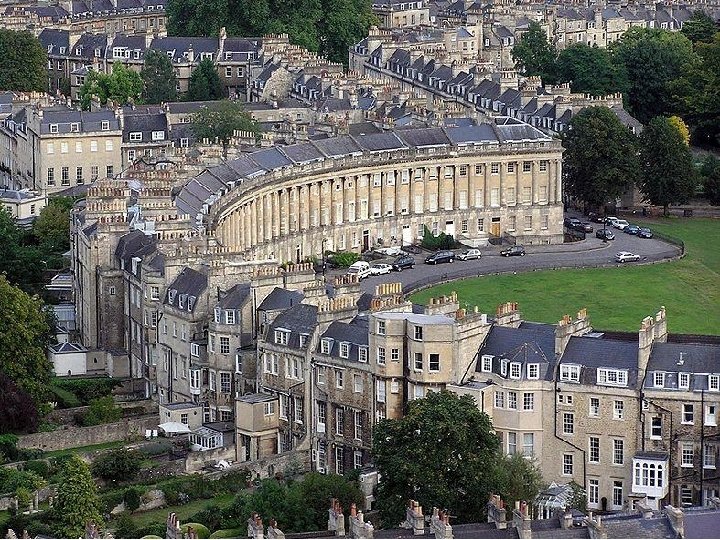
 IAAO Oblique Imagery Requirement • Updated every 2 years in rapid growth areas • Low level oblique images capable of being used for measurement verification (four cardinal directions) • Minimum 6” pixel resolution in urban areas and 12” pixel resolution in rural areas
 “The GAME Changer” 1. 2. 3. 4. 5. Inexpensive High resolution Digital color Readily available Measure, measure, measure!
 Oblique and Ortho Imagery Pictometry International
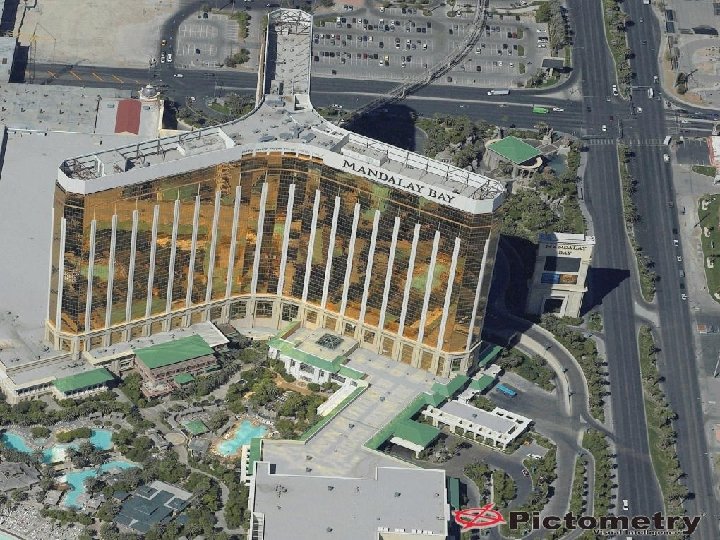
 Oblique Four Cardinal Directions
 Pictometry Measuring Tools
 Commercial Streetview and Oblique
 Commercial Streetview and Oblique
 IAAO Oblique Imagery Requirement • Updated every 2 years in rapid growth areas • Low level oblique images capable of being used for measurement verification (four cardinal directions) • Minimum 6” pixel resolution in 12” pixel resolution in rural areas
 What Constitutes Rapid Growth Areas? “In my OPINION, rapid growth should be defined as five(5) or more times normal growth for the area while taking all factors into consideration. ”
 Official Statement from Pictometry Concerning Accuracy Pictometry provides a visualization system and therefore does not certify image accuracy. However, some Pictometry customers have done their own certification on the Pictometry data after delivery and have shared their results. On average, customers have been seeing better than 1. 0 -meter RMS error at a 95% confidence level (NMAS 1: 1200) for orthogonal imagery over relatively flat terrain or in areas with accurate elevation data, and 2. 0 meter RMS error at a 95% confidence level (NMAS 1: 2400) for more varied terrain or in areas with poor elevation data. However, Pictometry does not guarantee these accuracies and your results may vary.
 Quality Control Measurement Accuracy QC measurement accuracy by comparing photo identifiable feature measurements with the metrics given by the software tools, using a plus or minus three (3) pixel tolerance. Use a football field, baseball diamond, or structures with accurate drawings from CAMA or your GIS file.
 Quality Control Locational Accuracy Locational accuracy is generally based upon the accuracy of the DEM or DTM used to rectify the oblique and pixel size of the imagery. In most cases the oblique provider uses your existing ground control. Compare photo identifiable points with known coordinates with the same point on the oblique. Plus or minus three percent (3%) can be expected.
 Desktop Review Process Bringing It All Together “Ultimate System”
 How Does It All “Come Together”
 DTR is comprised of the following functions: • Sketch Georeference and Verification or “Change Detection” • High Resolution Street View Imagery • Oblique Imagery • Ortho Photography • Field Review and Maintenance Tools
 CAMA DATA
 Street View Image
 Oblique Image
 You all know about opinions…. “In my opinion the ultimate use of the IAAO Standard on Mass Appraisal is the Desktop Review System (DTR)” George Donatello, CMS George D
 Desktop Review Software §Complete desktop review §Review multiple datasets §Verify property characteristics sketch §Confirm features and outbuildings §Create export list for field review
 Data Analysis
 Appraisal Review Software Data and Imagery files are structured for import into CAMA Systems
 Map View Software Map View Data and Imagery files are structured for import into CAMA Systems
 Data Review
 Data Review Screen
 Edit Screen
 Three Screen Configuration
 In Field Review-ADV
 Street View Image
 Mobile Field Review
 CAMA CLOUD PRC Changes GIS") Real-Time DASHBOARD Reporting Automated Data Entry Dynamic Routing (Auto) CAMA CLOUD PRC Changes GIS Photo’s Property Data PROPERTY VISIT Real-Time QC & Questions/Answer SM New Photo’s (Real-Time Sync)
Real-Time DASHBOARD Reporting Automated Data Entry Dynamic Routing (Auto) CAMA CLOUD PRC Changes GIS Photo’s Property Data PROPERTY VISIT Real-Time QC & Questions/Answer SM New Photo’s (Real-Time Sync)
 Bring the Field to the Office “Ultimate System”

 What Does It All Cost? ? Budget Numbers Only 1. Sketch conversion…less than $3 per parcel 2. Change detection… Less than $1 per parcel 2. Street View Image…. $2 -3 per parcel 3. Ortho less than $100 per square mile 4. Oblique Image…. . 12” $150, 4” $400 per square mile
 Literally the Million Dollar Question • • Large Florida county---10:") Return on Investment (ROI) Literally the Million Dollar Question • • Large Florida county---10: 1 Medium-size Texas county---16: 1 Washington DC---11: 1 Small rural Ohio county---7: 1 Small Missouri county---6: 1 Small N. Carolina county---10: 1 Medium-size Kansas county---13: 1
Return on Investment (ROI) Literally the Million Dollar Question • • Large Florida county---10: 1 Medium-size Texas county---16: 1 Washington DC---11: 1 Small rural Ohio county---7: 1 Small Missouri county---6: 1 Small N. Carolina county---10: 1 Medium-size Kansas county---13: 1
 4" Oblique 100 $ 400. 00 1. 5 $ 40, 000 46, 267 $ 0. 60 1 $ 27, 760 Mobile Office 1 $ 10, 000. 00 1 $ 10, 000 Annual Maintenance 1 $ 2, 220. 00 4 $ 8, 880 Software Licenses 4 $ 1, 600. 00 1 $ 6, 400 500 $ 5. 00 4 $ 10, 000 Consulting/Training 5 $ 1, 250. 00 5 $ 31, 250 Hardware 4 $ 3, 000. 00 1 $ 12, 000 Misc. 1 $ 30, 000. 00 1 $ 30, 000 77, 699 $ 2. 20 1 $ 170, 938 Flagler County Cost Sketch Geo-reference Updates Desktop Review Project Carrying Cost (3% annual) $ 77, 782 Total Cost $ 709, 311 Per Parcel Cost $ 1. 83
 Description Number High resolution street level images 46,") Flagler Co. FL (5 yr cost) Description Number High resolution street level images 46, 267 Unit Cost $ 3. 00 Total 1 $ 138, 801 2 $ 145, 500 12" Obliwue and Ortho 485 4" Oblique 100 $ 400. 00 1. 5 $ 40, 000 46, 267 $ 0. 60 1 $ 27, 760 Mobile Office 1 $ 10, 000. 00 1 $ 10, 000 Annual Maintenance 1 $ 2, 220. 00 4 $ 8, 880 Software Licenses 4 $ 1, 600. 00 1 $ 6, 400 500 $ 5. 00 4 $ 10, 000 Consulting/Training 5 $ 1, 250. 00 5 $ 31, 250 Hardware 4 $ 3, 000. 00 1 $ 12, 000 Misc. 1 $ 30, 000. 00 1 $ 30, 000 77, 699 $ 2. 20 1 $ 170, 938 Sketch Geo-reference Updates Desktop Review $ 150. 00 Years Project Carrying Cost (3% annual) $ 77, 782 Total Cost $ 709, 311 Per Parcel Cost $ 1. 83
Flagler Co. FL (5 yr cost) Description Number High resolution street level images 46, 267 Unit Cost $ 3. 00 Total 1 $ 138, 801 2 $ 145, 500 12" Obliwue and Ortho 485 4" Oblique 100 $ 400. 00 1. 5 $ 40, 000 46, 267 $ 0. 60 1 $ 27, 760 Mobile Office 1 $ 10, 000. 00 1 $ 10, 000 Annual Maintenance 1 $ 2, 220. 00 4 $ 8, 880 Software Licenses 4 $ 1, 600. 00 1 $ 6, 400 500 $ 5. 00 4 $ 10, 000 Consulting/Training 5 $ 1, 250. 00 5 $ 31, 250 Hardware 4 $ 3, 000. 00 1 $ 12, 000 Misc. 1 $ 30, 000. 00 1 $ 30, 000 77, 699 $ 2. 20 1 $ 170, 938 Sketch Geo-reference Updates Desktop Review $ 150. 00 Years Project Carrying Cost (3% annual) $ 77, 782 Total Cost $ 709, 311 Per Parcel Cost $ 1. 83
 Flagler County Cost and Revenue Years 1 Single Progress Payment $ 631, 529 $ 631, 529 No Pmt. First Year $ - $ 177, 328 $ 709, 311 $ 70, 931 $ 159, 595 $ 709, 311 Government Capital 2 3 4 5 Total Revenue Enhancement Additional Revenue $ 297, 911 $ 446, 866 $ 496, 518 $ 546, 169 $ 595, 821 Cumulative Additional Revenue $ 297, 911 $ 744, 777 $ 1, 241, 294 $ 1, 787, 464 $ 2, 383, 285
 Some Projects Using Desktop Review • US Jurisdictions – Washington D. C. – Gaston County – North Carolina – Orange County – Florida • Canadian Provinces/Cities – British Columbia

 Washington, D. C. 102
 Washington, D. C. 103
 Washington, D. C. 104
 Washington, D. C. 105
 Washington, D. C. 106
 CAMA Data
 Gaston Co. N. C.
 Gaston County, N. C. • • • Pictometry Mobile Video-Yotta Desktop Review Street Front Images Online Information – field cards Web Integration 109
 Gaston County, N. C. 111

 Orange County, Florida • • Full GIS Integration Pictometry Mobile Video - Yotta Desktop Review WEB Enabled Full Disclosure Many Users of the Data 113
 114
114
 115
115
 116
116
 ROI METRICS 1 Billion @ 20 mills = $20 Million in taxes from a $ 2 Million technology investment, plus there were 100’s of Other benefits: …. . 117
 Summary – U. S. Jurisdictions • • Heavy “Web” Presence GIS Integration Not much for “new data collection” Less Residential Data collected Excellent Reassessment Programs Use all forms of technologies Full disclosure – Web – – Field Cards Comp Sales Revaluation Manuals Formulas 118
 British Columbia
 Street-front Image Comments: • Excellent quality • 10 cm resolution • Used Contractor – “Yotta” • Cost $4. 00 per folio (high / volume) • Additional services (GPS, Georeference etc) • Municipalities have large interest in photos 120
 Desktop Review – The Environment 121
 Technology: The Desktop of the Future 122
 Desktop Review – Geo. Referencing Sketches 123
 Desktop Review – Geo. Referencing Minor/Major Deltas Minor Delta Major Delta 124
 Ortho & Geo-referenced Sketch Image Comments: • Nanaimo = 8, 000 sketch errors 7, 000 folios out of 23, 700 • Yotta did change detection • Yotta will be redoing Geo-ref layer 125
 Key Metrics - Nanaimo Item: Before DTR: Using DTR: Reassessment 14. 2 folios / day 40 folios / day Labour cost $616, 000 $216, 000 Process (labour) cost $25. 89 / folio $9. 75 / folio Total cost $616, 000 $399, 000 Total process cost $25. 89 / folio $16. 78 / folio Cycle time 27. 4 minutes 9. 75 minutes Roll Quality ASR/COD 96. 7% 96. 8% Sketch errors 0 8, 452 # of data changes 0 40, 678 New Construction $0 $121, 000 / 7. 3% / 6. 0% 126
 2010 Pilot - Indian Arm Example / Missing $400 K 127
 BC Conclusions “ More information is available than ever before and we can do more than expected with the DTR (Desktop Review Process) approach to make more accurate and uniform reassessments. ”
 What Else? ? ?
 Oblique's / Orthos – 10 cm Resolution 130
 The Desktop Pieces – Oblique Images 131
 Mobile Office - Desktop Suite: 132
 Mobile Office - Street front 133