80ce881e4858f059b3fc22d196bc0bf4.ppt
- Количество слайдов: 117

HYPERTENSION When, what, co-morbid conditions ? George Mangos DEPARTMENT OF MEDICINE ST GEORGE HOSPITAL www. med. unsw. edu. au/stgrenal UNSW

When to start treatment? • 40 yo male, confirmed Blood Pressure • 144/92 mm. Hg (St 1)? • 160/84 mm. Hg (St 2)? • 136/84 mm. Hg (high(n))?

• • • 61 prospective observational studies of BP (Oxford University) N > 1 000 ! 12. 7 million person-years 56000 vascular deaths Cardiovascular outcomes using original raw data Prospective Studies Collaboration Lancet 2002

Stroke mortality rate in each decade of age versus usual SBP at the start of that decade 11 274 deaths at ages 50 - 89 256 Age at risk: 20 mm. Hg SBP 33% risk 128 70 -79 50% risk 64 60 -69 57% risk 32 50 -59 62% risk 16 (40 -49 64% risk) Stroke mortality (floating absolute risks & 95% CI) 80 -89 8 4 2 1 120 140 160 180 Usual systolic blood pressure (mm. Hg)

Stroke mortality rate in each decade of age versus usual DBP at the start of that decade 11 274 deaths at ages 50 - 89 Stroke mortality (floating absolute risks & 95% CI) 256 Age at risk: 10 mm. Hg DBP 80 -89 37% risk 70 -79 52% risk 60 -69 60% risk 32 50 -59 66% risk 16 (40 -49 65% risk) 128 64 8 4 2 1 70 80 90 100 110 Usual diastolic blood pressure (mm. Hg)

IHD mortality rate in each decade of age versus usual SBP at the start of that decade 33 867 deaths at ages 40 - 89 Age at risk 20 mm. Hg SBP IHD mortality (floating absolute risks & 95% CI) 256 80 -89 31% risk 128 70 -79 40% risk 64 60 -69 46% risk 32 50 -59 50% risk 40 -49 51% risk 16 8 4 2 1 120 140 160 180 Usual systolic blood pressure (mm. Hg)

IHD mortality rate in each decade of age versus usual DBP at the start of that decade 33 867 deaths at ages 40 - 89 IHD mortality (floating absolute risks & 95% CI) 256 32 16 80 -89 30% risk 70 -79 38% risk 60 -69 44% risk 50 -59 48% risk 40 -49 128 64 Age at risk 10 mm. Hg DBP 53% risk 8 4 2 1 70 80 90 100 110 Usual diastolic blood pressure (mm. Hg)

Prospective Studies Collaboration tells us that the risk of hypertension; • Continues through normal BP range • Risk is stronger than originally thought • Reduction in BP 10 / 5 mm. Hg • 40% reduced risk of stroke death • 30 % reduced risk of IHD or other vascular death • Benefit of lower BP extends to 115/75 mm. Hg

PSC Meta-analysis – Summary “incremental increases of 20/10 systolic/diastolic blood pressure beginning with values of 115/75 result in a doubling of cardiovascular risk mortality. ”

Evidence that rising BP and risk is overwhelming • • • Predictive Reproducible Independent Continuous All populations

When to Start Therapy ? High Normal Blood Pressure 136/84 mm. Hg • “Prehypertension” – benefit from treatment with candesartan for 2 years in healthy young males • Lower rates of subsequent hypertension N Engl J Med 2006; 355: 1551 -1562, Oct 12, 2006;

HOPE Study • The Heart Outcomes Prevention Evaluation (HOPE) Study was a multicenter, randomized trial enrolling 9, 297 patients 55 years old with a history of cardiovascular disease, or diabetes plus at least one other cardiovascular risk factor • Patients were treated with ramipril or placebo and vitamin E or placebo for an average of 4. 5 years • Combined primary endpoint was the development of myocardial infarction, stroke, or cardiovascular death • Secondary endpoints were total mortality, admission to hospital for congestive heart failure or unstable angina, complications related to diabetes, and cardiovascular revascularization Yusuf S, et al. N Engl J Med. 2000; 342: 145153. Slide Source Hypertension. Online www. hypertensiononline. org

Events per patient group (%) HOPE Study Outcomes: Events Per Patient Group RR=22% P<0. 001 RR=26% P<0. 001 RR=20% P<0. 001 RR=16% P=0. 005 RR=32% RR=0% P<0. 001 P=NS Combined Primary Outcome* Cardiovascular Death Myocardial Infarction Stroke Non. Total Cardiovascular Mortality Death *The occurrence of myocardial infarction, stroke or cardiovascular death RR=Relative risk reduction Yusuf S, et al. N Engl J Med. 2000; 342: 145 -153. Slide Source Hypertension. Online www. hypertensiononline. org

When to Start Therapy ? HOPE Study • In presence of TOD it is probably beneficial to start ACEI in high risk patients, regardless of blood pressure. Slide Source Hypertension. Online www. hypertensiononline. org

High – Normal BP (130 -139/85 -89 mm. Hg) • No TOD • Lifestyle modifications • TOD • Consider ACEI or ARB

Lifestyle modifications to manage hypertension Modification Recommendation SBP Reduction Weight loss BMI 18. 5 -24. 9 5 -20 mm. Hg/10 kg DASH plan 8 -14 mm. Hg Na reduction < 100 mmol or 6 g salt 2 -8 mm. Hg Physical Activity 30 min/day, most days 4 -9 mm. Hg Moderation Et. OH Max 2/day men, 1/day 2 -4 mm. Hg women JNC VII Report 2003. JAMA 289 2560 -2572

Stage 1 hypertension (140 -159/90 -99 mm. Hg) • Lifestyle Modification for 6 months BUT • Microalbuminuria • Hypertensive retinopathy • e. GFR < 60 • PVD • LVH or IHD • Cerebrovascular disease ØTreatment SHOULD be initiated ØTarget Organ Damage


Stage 2 hypertension • 160/84 mm. Hg • Once confirmed, treatment SHOULD be initiated • Lifestyle modification recommended • Isolated Systolic Hypertension

CHD Death according to SBP and DBP in MRFIT (n=350, 000) Systolic blood pressure Relative risk of CHD mortality Diastolic blood pressure Decile SBP DBP 1 <112 <71 2 3 4 5 6 7 8 11271 - 11876 - 12179 - 12581 - 12984 - 13286 - 13789 - 9 10 142 - >151 92>98 He J, et at. Am Heart J. 1999; 138: 211 -219.

Stroke Death According to SBP and DBP in MRFIT (n=350, 000) Relative risk of stroke death Systolic blood pressure Diastolic blood pressure 1 SBP DBP <112 <71 2 3 4 5 6 7 8 11271 - 11876 - 12179 - 12581 - 12984 - 13286 - 13789 - 9 10 142 - >151 92>98 He J, et at. Am Heart J. 1999; 138: 211 -219.

Isolated Systolic Hypertension and Cardiovascular Disease Risk in Framingham Age-adjusted annual CVD event rate per 1000 2. 5 82 ISH BP 160/<95 mm. Hg BP <140/95 mm. Hg 2. 4 43 33 18 Men Women P<0. 001 for difference between both men and women with ISH and blood pressure (BP) <140/95 mm. Hg Wilking SV et al. JAMA. 1988; 260: 3451 -3455.

CLINICAL PEARL • Systolic hypertension is a more important risk factor than diastolic blood pressure.

How low to treat ?

Is there a J-Curve ? CV Disease k ris 0 mm. Hg Blood Pressure 200 mm. Hg

Is there a J-Curve ? CV Disease k ris 0 mm. Hg Blood Pressure 200 mm. Hg

Evidence for J-curve BP = 0 mm. Hg –> patient is dead “Overwhelming evidence now that our BP targets should be much lower. ”

TREATING TO TARGET How low should our BP targets be ? Do we achieve BP targets in treatment of hypertension ?


HOT - Target blood pressure is an achievable goal DBP mm Hg 105 (% patients reaching target) target £ 80 mm Hg 100 target £ 85 mm Hg 95 target £ 90 mm Hg 90 74% 60% 85 86% 73% 55% 43% 80 0 0 3 6 12 Months 24 36 Final follow-up Hansson et al 1998

Risk of a major cardiovascular event reduced by 30% in the HOT Study 0 105 100 5 10 95 90 85 Achieved DBP 80 mm Hg Optimal DBP reduction in the HOT Study 15 20 25 30 % risk reduction Hansson et al 1998

Significant benefits from intensive blood pressure reduction in diabetics Major CV events/ 1000 patient years 25 20 15 p=0. 005 for trend 10 5 0 £ 90 £ 85 £ 80 mm Hg Target DBP Hansson et al 1998

HOT - Combination therapy needed to achieve target blood pressure Enrolment Final 59% 32% Monotherapy Combination therapy SBP/DBP mm Hg 161/98 £ 90 mm Hg 37% SBP/DBP mm Hg 144/85 142/83 £ 85 mm Hg 32% 142/83 £ 80 mm Hg 26% 140/81 Hansson et al 1998

HOT Study results (1998) n n n No difference in achieved BP between the 3 groups n (85. 2 mm. Hg, 83. 2 mm. Hg, and 81. 1 mm. Hg) No difference in CV outcomes between groups BEST OUTCOMES AT 139/83 mm. Hg No J-curve demonstrated 70 % of patients required 2 or more drugs BP targets achieved in > 50 -80 % subjects HOT Study Group. Lancet. 1998; 351(9118): 1755 -1762.

Heart Foundation Guidelines 2004 Targets • Adults > 65 • All others • Proteinuria > 1 g < 140/90 mm. Hg <130/85 mm. Hg < 125/75 mm. Hg “MOST of your patients will require combined therapy”

ALLHAT 42, 418 High-risk hypertensive patients Randomized Design of ALLHAT BP Trial Consent / Randomize Amlodipine Chlorthalidone Doxazosin Lisinopril Follow until death or end of study (4 -8 years, mean 4. 9 years)

ALLHAT Inclusion Criteria l Men and women aged > 55 years l Seated blood pressure (2 categories): 1) Treated for @ least 2 months. 2) Not on drugs or on drugs < 2 months. l Additional risk factor or target organ damage.

ALLHAT Blood Pressure Control Cushman, et al. J Clinical Hypertens 2002; 4: 393 -404

CLINICAL PEARL #2 • It is often more difficult to control systolic blood pressure than diastolic blood pressure.

ALLHAT Treatment and Blood Pressure Control 1 Drug 3 Drugs 2. 0 Patients (%) 1. 3 6 mos Average # of drugs 1. 7 1. 4 1 yr 3 yr 5 yr Blood pressure controlled <140/90 mm. Hg 49. 8% 55. 2% 62. 3% 65. 6% Cushman WC, et al. J Clin Hypertens. 2002; 4: 393 -405.

Proportion of Uncontrolled ALLHAT Participants Not Stepped Up at Annual Visits Cushman, et al. J Clinical Hypertens 2002; 4: 393 -404


CLINICAL PEARLS #3 -5 • Monotherapy only effective in only 30 -40% patients • Treating down to targets IS possible in most patients • Doctors do not always follow guidelines, even in studies.

Hypertension – Target BP ! (<160/95, *<140/90) 20 % 18 % 16 %* 34 % 9% 2. 5 % 19 % JNC VI. Arch Int Med 1997; 157: 2413 Colhourn et al. J Hypertens 1998; 16: 747 Marques-Vidal et al. J Hum Hypertens 1997; 11: 213

Heart Foundation Guidelines 2004 Targets • Adults > 65 • All others • Proteinuria > 1 g < 140/90 mm. Hg <130/85 mm. Hg < 125/75 mm. Hg “MOST of your patients will require combined therapy”

How do we get blood pressure under control ?

• Non-pharmacological Measures • Pharmacotherapy

Lifestyle modifications to manage hypertension Modification Recommendation SBP Reduction Weight loss BMI 18. 5 -24. 9 5 -20 mm. Hg/10 kg DASH plan 8 -14 mm. Hg Na reduction < 100 mmol or 6 g salt 2 -8 mm. Hg Physical Activity 30 min/day, most days 4 -9 mm. Hg Moderation Et. OH Max 2/day men, 1/day 2 -4 mm. Hg women JNC VII Report 2003. JAMA 289 2560 -2572

Dietary Approaches to Stop Hypertension (DASH) Study • • • Published 1997 NEJM N=459 DBP 80 -95 mm. Hg SBP < 160 mm. Hg 8 weeks

DASH Study - design control diet v ‘fruit/vegetable rich diet’ v ‘combination diet’

Results – (n=133)

DASH – Results (n=133) • BP was controlled in 70 % of Stage 1 hypertensives (140 -159/90 -95) with combination diet • No weight loss, no change Na+ or Ca++ intake • Increased K and Mg intake in combination diet group • ? Long term sustainability • ? CV endpoints

Lifestyle modifications to manage hypertension Modification Recommendation SBP Reduction Weight loss BMI 18. 5 -24. 9 5 -20 mm. Hg/10 kg DASH plan 8 -14 mm. Hg Na reduction < 100 mmol or 6 g salt 2 -8 mm. Hg Physical Activity 30 min/day, most days 4 -9 mm. Hg Moderation Et. OH Max 2/day men, 1/day 2 -4 mm. Hg women JNC VII Report 2003. JAMA 289 2560 -2572

Which Drugs to Use?

ALLHAT Mean Systolic and Diastolic Blood Pressure During Follow-up Amlodipine Lisinopril Compared to chlorthalidone: SBP significantly higher in amlodipine (~1 mm. Hg) and lisinopril (~2 mm. Hg) groups. 0 1 2 3 4 5 Diastolic BP (mm. Hg) Chlorthalidone Amlodipine Systolic BP (mm. Hg) Chlorthalidone 6 0 1 Follow-up, yrs Compared to chlorthalidone: DBP significantly lower in amlodipine group (~1 mm. Hg). 2 3 4 5 6 ALLHAT Research Group. JAMA. 2002; 288: 2981 -2997.

Cumulative Fatal CHD and Nonfatal MI event rate (%) ALLHAT Primary Outcome – Cumulative fatal CHD and non-fatal MI Chlorthalidone Amlodipine Lisinopril 0 1 2 3 4 5 Time to event (yrs) 6 7 ALLHAT Research Group. JAMA. 2002; 288: 2981 -2997.

Cumulative event rate (%) ALLHAT Stroke by Treatment Group Chlorthalidone Amlodipine Lisinopril 0 1 2 3 4 5 Time to event, yrs 6 7 ALLHAT Research Group. JAMA. 2002; 288: 2981 -2997.

Cumulative event rate (%) ALLHAT Heart Failure by Treatment Group Chlorthalidone Amlodipine P<0. 001 for chlorthalidone vs amlodipine and chlorthalidone vs lisinopril Lisinopril 0 1 2 3 4 5 Time to event, yrs 6 7 ALLHAT Research Group. JAMA. 2002; 288: 2981 -2997.

Special Groups • JNC VII

ANPB 2 – ACEI v thiazide • • • 65 -84 yrs both sexes > 160 systolic OR > 90 diastolic mm. Hg Few previous cardiovascular events 6000 patients followed for average 4. 1 years ACEI or HCTZ 1 st line • CCB, - or -blocker added to achieve target. • Target: > 20 sys. and > 10 dias. fall to < 160/90 (140/80 mm. Hg if tolerated) • Family practices Wing L et al 2003 NEJM

ANBP 2 - BP after Randomisation

ANBP 2 – Results • 5 yrs - BP decreased by 26/12 mm Hg both groups • monotherapy - 65 % ACEI gp - 67 % diuretic gp àTarget not tight. • 60 % of subjects continued with initial treatment

ANBP 2 – Primary endpoints

ANBP 2 – Conclusions • Cardiac - ACEI > diuretics • Stroke - diuretics > ACEI • Death - similar both agents “ACE-inhibitor-based therapy resulted in an outcome advantage over a diuretic-based regimen, despite similar reductions in blood pressure. . ”

Blood Pressure Lowering Treatment Triallists Collaboration • N=162, 341 • Overview of 29 RCTs • Effects of Different Blood Pressure Lowering Regimens on Major Cardiovascular Events • Trials including ACEI, CCBs, ARBs, bblockers, diuretics BPLTTC Lancet 2002. 362: 1537 -35

BPLTTC Trials • Active v placebo • HOPE, PART 2, PROGRESS, QUIET, SCAT • CCB v placebo • IDNT, NICOLE, PREVENT, SYST-EUR • More v Less • AASK, ABCD, HOT, UKPDS • ARB v control • IDNT, RENAAL, SCOPE, LIFE • Different Drug Classes • ACEI - AASK, ALLHAT, ANBP 2, CAPPP, STOP 2 • CCB – AASK, CONVINCE, ELSA, INSIGHT, NICS, NORDIL, SHELL, STOP-2 • ACE v CCB – AASK, ABCD, ALLHAT, JMIC-B, STOP-2

RESULTS ACEI and CCB v placebo • More Rx better than less for stroke and CV events • CCBs show no benefit for CCF BPLTTC Lancet 2003

ARBs v Placebo • Benefits of ARBs observed in stroke, CCF and major CV events. • ARBs probably now treatment of choice in type 2 DM with microalbuminuria (IRMA) or overt proteinuria (RENAAL/IDNT)

STUDIES COMPARING DRUG CLASSES Stroke • Borderline significance ? ACEI inferior to D/BB and CCB CHD • No difference between ACEI, D/BB and CCB CHF • ACEI and D/BB superior to CCB Major CV Events • No differences CV Death • No differences Total Mortality • No differences


Dual Blockade of the RAS with ARBs and ACEI • CALM Study (2000) – candesartan + lisinopril well tolerated and lower BP • Jacobsen et al (2003) – irbesartan + enalapril lower BP and proteinuria in T 1 DM • Rossing et al (2002) – candesartan + ACEI lower BP and proteinuria • Hard endpoints lacking

How to achieve target BP • CONTRACT with the patient in the first or second visit • Education, literature • Understanding of rationale of treatment • Multiple drug therapy LIKELY • Patient involved in decision making • Lifestyle factors • The outcome is NOT being on treatment rather identifying the problem (HT) and the target BP and using means the get there.

VALUE Study Valsartan Antihypertensive Long-Term Use Evaluation 2004

VALUE: Significance • First trial to compare a modern angiotensin II receptor blocker (ARB), valsartan, to the most widely used third-generation calcium channel blocker, amlodipine • Designed to evaluate effectiveness of a valsartan-based regimen vs an amlodipinebased regimen on overall cardiac outcomes • N=15, 000 Mann J, Julius S. Blood Press. 1998; 7: 176– 183.

Effects of Angiotensin II at AT 1 and AT 2 Receptors AT 1 AT 2 Blocked by ARBs - Vasoconstriction Aldosterone release Oxidative stress Vasopressin release SNS activation Inhibits renin release Renal Na+ and H 2 O reabsorption Cell growth and proliferation Siragy H. Am J Cardiol. 1999; 84: 3 S– 8 S. - Vasodilation Antiproliferation Apoptosis Natriuresis Bradykinin production NO release

VALUE: Systolic Blood Pressure in Study Sitting SBP by Time and Treatment Group mm. Hg 155 Valsartan (N= 7649) 150 145 140 135 Baseline 1 2 3 4 6 12 18 24 30 36 42 48 54 60 66 Months mm. Hg Amlodipine (N = 7596) 5. 0 4. 0 3. 0 2. 0 1. 0 0 – 1. 0 (or final visit) Difference in SBP Between Valsartan and Amlodipine 1 2 3 4 6 Julius S et al. Lancet. June 2004; 363. 12 18 24 30 36 42 48 54 60 66 Months (or final visit)

VALUE: Diastolic Blood Pressure in Study mm. Hg Sitting DBP by Time and Treatment Group 90 Valsartan (N= 7649) 85 Amlodipine (N = 7596) 80 75 Baseline 1 2 3 4 6 12 18 24 30 36 42 48 54 60 66 mm. Hg Months 5. 0 4. 0 3. 0 2. 0 1. 0 0 – 1. 0 (or final visit) Difference in DBP Between Valsartan and Amlodipine 1 2 3 4 6 Julius S et al. Lancet. June 2004; 363. 12 18 24 30 36 42 48 54 60 66 Months (or final visit)

Proportion of Patients With First Event (%) 14 VALUE: Primary Composite Cardiac Endpoint Valsartan-based regimen 12 Amlodipine-based regimen 10 8 6 4 HR = 1. 03; 95% CI = 0. 94– 1. 14; P = 0. 49 2 0 0 6 12 18 24 30 36 42 48 54 60 66 Time (months) Number at risk Valsartan 7649 7459 7407 7250 7085 6906 6732 6536 6349 5911 3765 1474 Amlodipine 7596 7469 7424 7267 7117 6955 6772 6576 6391 5959 3725 1474 Julius S et al. Lancet. June 2004; 363.

VALUE: Fatal and Non-fatal Stroke 6 Proportion of Patients With First Event (%) Valsartan-based regimen 5 Amlodipine-based regimen 4 3 2 1 0 Number at risk HR = 1. 15; 95% CI = 0. 98– 1. 35; P = 0. 08 0 6 12 18 24 30 36 42 48 54 60 66 Time (months) Valsartan 7649 7494 7448 7312 7170 7022 6877 6692 6515 6093 3859 1516 Amlodipine 7596 7499 7455 7334 7195 7055 6918 6744 6587 6163 3846 1532 Julius S et al. Lancet. June 2004; 363.

Proportion of Patients With First Event (%) 7 VALUE: Fatal and Non-Fatal Myocardial Infarction Valsartan-based regimen 6 Amlodipine-based regimen 5 4 3 2 1 0 HR = 1. 19; 95% CI = 1. 02 -1. 38; P = 0. 02 0 6 12 18 24 30 36 42 48 54 60 66 Time (months) Number at risk Valsartan 7649 7499 7458 7319 7177 7016 6853 6680 6504 6078 3864 1520 Amlodipine 7596 7497 7458 7332 7205 7065 6905 6727 6562 6141 3840 1532 Julius S et al. Lancet. June 2004; 363.

VALUE: Heart Failure Hospitalisation for HF or death from HF 9 Proportion of Patients With First Event (%) 8 Valsartan-based regimen 7 Amlodipine-based regimen 6 5 4 3 2 HR = 0. 89; 95% CI = 0. 77 -1. 03; P = 0. 12 1 0 Number at risk 0 6 12 18 24 30 36 42 48 54 60 66 Time (months) Valsartan 7649 7485 7444 7312 7169 7012 6852 6671 6498 6072 3860 1513 Amlodipine 7596 7486 7444 7312 7176 7033 6874 6702 6534 6100 3823 1511 Julius S et al. Lancet. June 2004; 363.

VALUE: Incidence of New-onset Diabetes 18 New-Onset Diabetes (% of patients in treatment group) 16 23% Risk Reduction With Valsartan P < 0. 0001 14 12 10 8 6 16. 4% 13. 1% 4 2 0 Valsartan-based Regimen (n = 5254) Julius S et al. Lancet. June 2004; 363. Amlodipine-based Regimen (n = 5168)

VALUE: Other Results • Incidence of stroke was lower, but not significantly, in the amlodipine group • Incidence of non-fatal MI was significantly lower in the amlodipine group • There was a positive trend in favour of valsartan for less heart failure but this did not reach significance • There was a highly significant lower rate of new-onset diabetes in the valsartan group Julius S et al. Lancet. June 2004; 363.

ONTARGET Study • ONgoing Telmisartan Alone and in Combination with Ramipril Global Endpoint Trial • to determine if the combination of the ARB telmisartan and the ACE inhibitor ramipril is more effective than ramipril alone • If telmisartan is at least as effective as ramipril. • n=25, 000, HOPE-like patients • Recruitment completed July 2003 • Follow up 3. 5 -5 yrs

TRANSCEND Study • The Telmisartan Randomized Assessme. Nt Study in a. CE i. Ntolerant subjects with cardiovascular Disease (TRANSCEND) • determine if telmisartan is superior to placebo in patients who are intolerant of ACE inhibitors. • HOPE like patients • N=5700 (/6000) • Follow up 3. 5 -5 yrs

Causes of Secondary Hypertension • • Renal Artery Stenosis Phaeochromocytoma Primary Aldosteronism Alcohol Excess Obesity** Cushing’s Disease Low Aldo / Low Renin syndromes

New screening tests for hypertension • Sensitivity – ability of a test to detect a true positive • Specificity – ability of a test to detect true negative

New screening tests for hypertension • Positive Predictive Value – probability that a positive test is a true positive (ie detects true disease) • Negative Predictive Value – probability that a negative test is a true negative (ie excludes disease

Renal Artery Stenosis • Atherosclerotic RAS • Fibromuscular Hyperplasia • Takayasu’s Arteritis • 19% of patients with CAD have RAS • Rates of progression of RAS low • 31% over 3 years • Intervention studies have failed to reliably show benefit of angioplasty+stenting of a-s RAS Zierler 2003 Mayo Proceedings

Doppler US diagnosis of RAS • Papers generally by radiologists • Sensitivity 95% (60 -80%) • Specificity 90% • Problems described • Training operators • Operator dependent • Study takes 1 hour • Body habitus influences technical success • Accessory renal arteries not visualized • 20 -27% population Rabbia 2003

Doppler US diagnosis of RAS • Attractive • Cheap (and subsidised) • Non-invasive • ‘add-on’ when imaging the kidneys • Anyone can order test

Contrast enhanced sonography in the diagnosis of renal artery stenosis Argalie et al Radiologica Medica 2004 • 51 patients with suspected RAS • 11 excluded because “renal artery not well visualised” • DSA showed RAS in 16/40 pts (40%) • Sensitivity 75% (colour doppler) 100% (power doppler) • Specificity 79% and 88%

Contrast enhanced sonography in the diagnosis of renal artery stenosis Argalie et al Radiologica Medica 2004 • Correcting for excluded patients • Sensitivity 50% (colour doppler) 80% (power doppler)

Captopril Renal Scan • Sensitivity 84 -100% • Specificity 62 -100% • Strengths • Functional Test • Relatively Non-Invasive • Weaknesses • Less sensitive if CRF present • Can’t be taking an ARB or ACEI

CT Angiography • Sensitivity > 90 % • Specificity > 90 % • Problems • Contrast (often > 100 mls) • Accessory arteries not well seen • Ca++ affects stenosis interpretation • Compared favourably to US (Halpern 1998) • Sensitivity 96 v 63%

MR Angiography • Sensitivity 97% (c/w 69% US) • Specificity > 95% (Qanadli 2001) • Problems • Availability & cost • Metallic implants • Co-operation, breath-holding and claustraphobia

RAS Summary • DSA remains gold standard for diagnosis • Screening for atherosclerotic disease has problems; • Non-invasive tests unreliable • Percutaneous interventions unproven • Morbidity of angioplasty significant • US/CT/captopril tests may be useful in patients with high pre-test probability

Phaeochromocytoma tests • • 24 hr urinary VMA 24 hr urinary catecholamines Plasma catecholamines 24 hr total urinary metanephrines (spectrophotometry) Recently (liquid chromatography) • 24 hr urinary fractionated metanephrines • Plasma free metanephrines (continuous leak from tumour cells)

Catecholamine metabolism

Test Comparisons Test Plasma Metanephrines 24 hr U total metanephrines + catecholamines Sensitivity Specificity 97 % 85 % 90 % 98 % Sawka et al, JCEM, 2003

Test Comparisons (hypertensives prevalence = 0. 5%) Test Plasma Metanephrines 24 hr U total metanephrines + catecholamines Positive Negative Predictive Value 3% 99. 98 % 23 % 99. 95 % Sawka et al, JCEM, 2003

Testing for Phaeochromocytoma Plasma Metanephrines ? Met <0. 4 Normet <0. 7 Met 0. 4 -1. 2 Normet 0. 7 -2. 2 Met > 1. 2 Normet > 2. 2 Very low likelihood of phaeochromocytoma Small tumour possible (familial) False positive (sporadic) High likelihood of phaeochromocytoma • Drugs (β & α blockers, symnpathomimetics, TCA • Repeat after overnight fast + • Measure 24 hr urine metanephrines and catecholamines

Metanephrine Summary • Tumours usually show levels > x 3 -4 normal • Specificity about 85%, 15% false positives (usually < x 3 -4 normal) • Increase with age (? Age corrections) • If low positive, repeat after overnight fast and avoid drugs • Urine metanephrines have very high specificity (good to exclude false positive) • Less variability in response to external factors • Urine catecholamines provide little extra information

“Rule of 10’s” • Phaeochromocytoma • 10% extraadrenal • 10% extraabdominal • 10% malignant • 10% bilateral • 10% hereditary Dluhy RG, 2002, NEJM

Familial Phaeochromocytoma • 24% of patients with sporadic phaeochromocytoma had a germ-line mutation of one of 4 phaeo-predisposing genes; • VHL gene • RET proto-oncogene • SDHD • SDHB Neumann et al 2002 NEJM.

Autosomal Dominant Phaeochromocytomapredisposing Syndromes Syndrome Phenotype Risk of Phaeo. Mutated Germ-Line Gene MEN 2 A MTC, HPTH 50 % RET MEN 2 B MTC, marfanoid, mucosal neuromas, HPTH 50 % RET 1% NF 1 Neurofibromato- Neurofibromas, café au sis type 1 lait spots VHL disease Retinal angioma, CNS haemangioblastomas, renal cysts & Ca 10 -20 % VHL Familial Paraganglioma Syndrome Carotid body tumours (chemodectoma) 20 % SDHD, SDHB Dluhy RG, 2002, NEJM

THANK YOU Dr Peter Campbell & team Daya Naidoo (SEALS)

www. med. unsw. edu. au/stgrenal
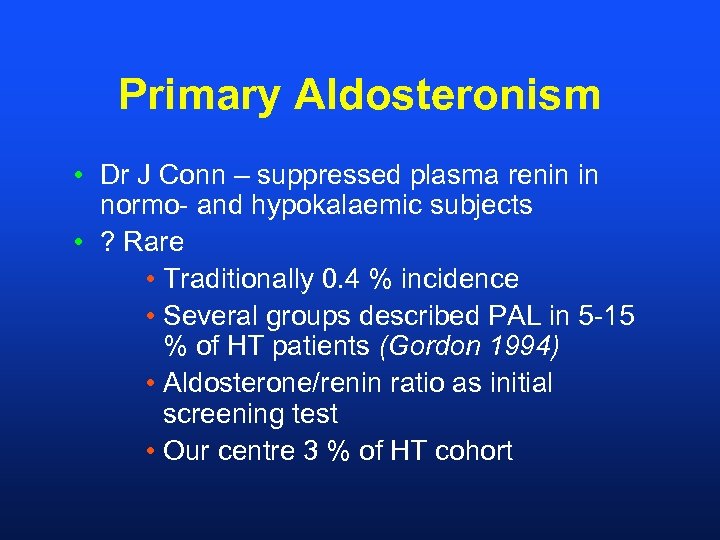
Primary Aldosteronism • Dr J Conn – suppressed plasma renin in normo- and hypokalaemic subjects • ? Rare • Traditionally 0. 4 % incidence • Several groups described PAL in 5 -15 % of HT patients (Gordon 1994) • Aldosterone/renin ratio as initial screening test • Our centre 3 % of HT cohort
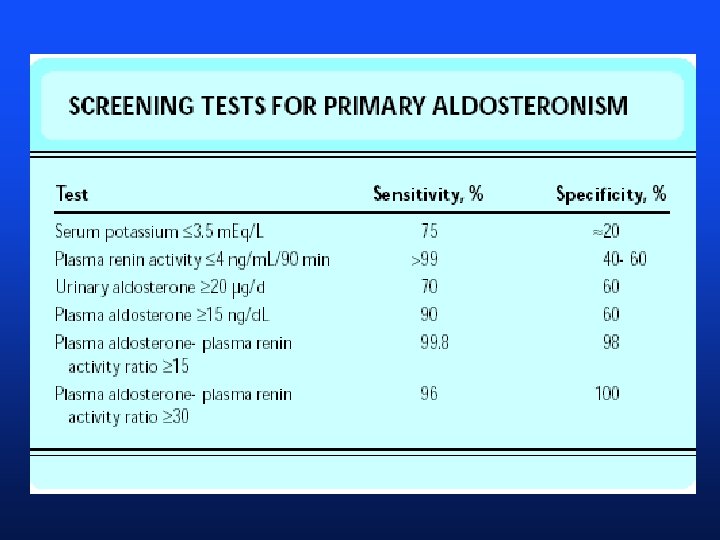
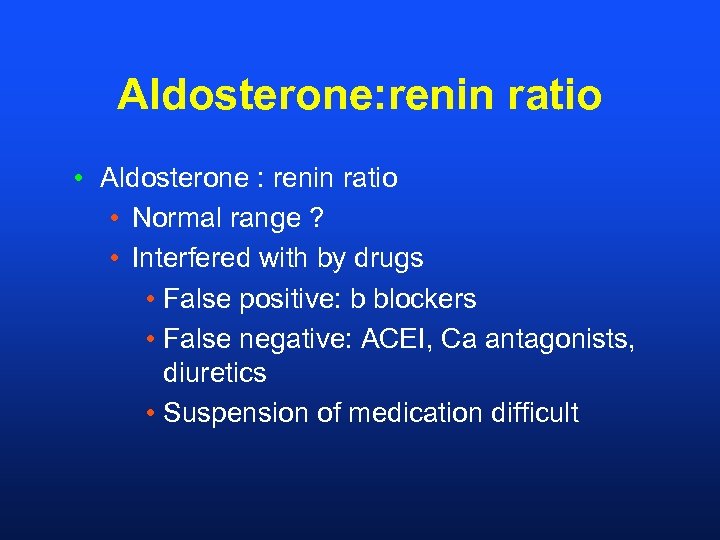
Aldosterone: renin ratio • Aldosterone : renin ratio • Normal range ? • Interfered with by drugs • False positive: b blockers • False negative: ACEI, Ca antagonists, diuretics • Suspension of medication difficult
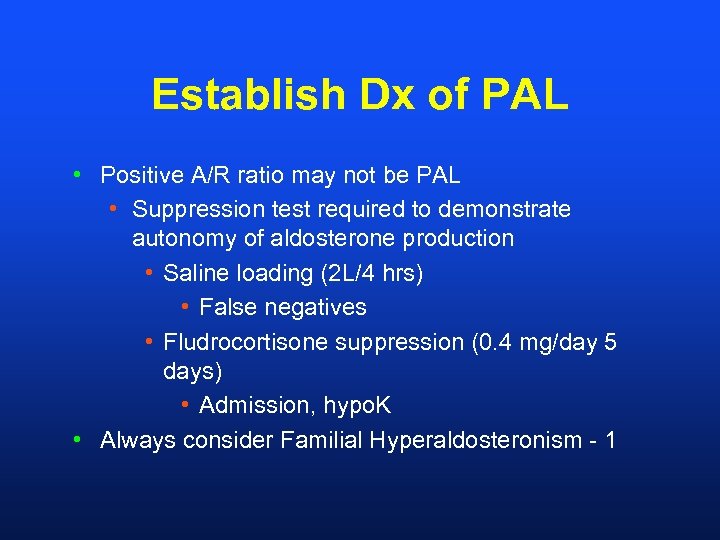
Establish Dx of PAL • Positive A/R ratio may not be PAL • Suppression test required to demonstrate autonomy of aldosterone production • Saline loading (2 L/4 hrs) • False negatives • Fludrocortisone suppression (0. 4 mg/day 5 days) • Admission, hypo. K • Always consider Familial Hyperaldosteronism - 1
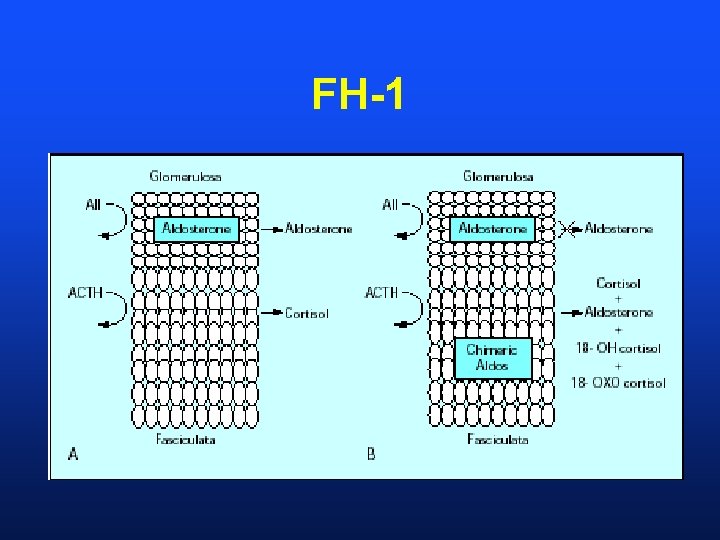
FH-1
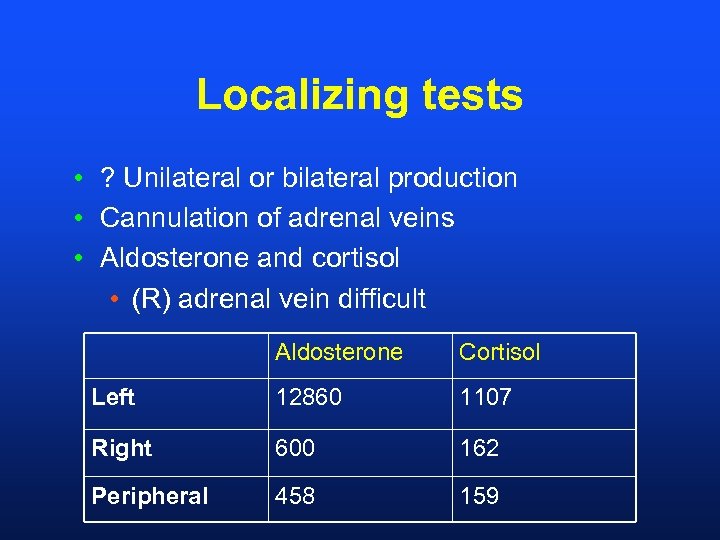
Localizing tests • ? Unilateral or bilateral production • Cannulation of adrenal veins • Aldosterone and cortisol • (R) adrenal vein difficult Aldosterone Cortisol Left 12860 1107 Right 600 162 Peripheral 458 159
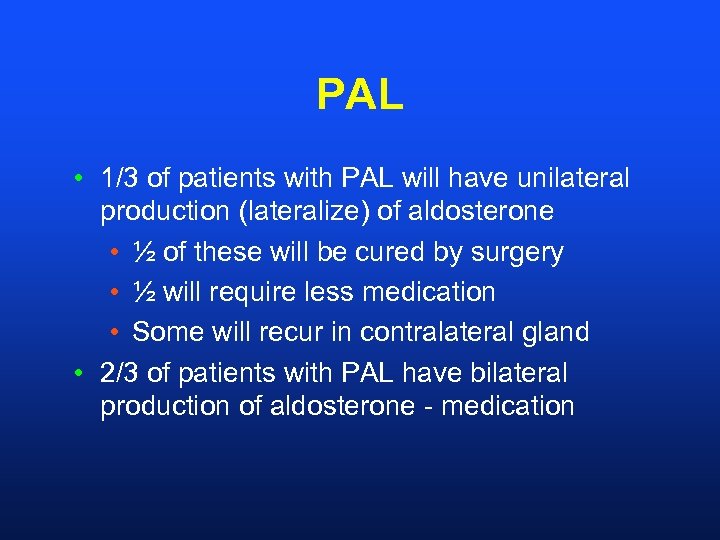
PAL • 1/3 of patients with PAL will have unilateral production (lateralize) of aldosterone • ½ of these will be cured by surgery • ½ will require less medication • Some will recur in contralateral gland • 2/3 of patients with PAL have bilateral production of aldosterone - medication
80ce881e4858f059b3fc22d196bc0bf4.ppt