

5d0e0fb12d2d0b632adcd105ba0aa0ad.ppt
- Количество слайдов: 47
 Hydrological Survey for Development of HEPP P M V Subbarao Professor Mechanical Engineering Department Determination of Techno-economical Viable Hydro Project Capacity …….
 Methodology of HEPP Development • • • Site Survey: Hydrological & geological Survey. Estimation of Potential Regulations & Environmental Concerns Feasible Supply Turbine Selection Costing and Payback.
 Hydrological Survey: Flow Duration Curve • To measure the flow-rate vs time at a given site. • Direct Measurement of the flow rate. • The more robust option is to find out the flow-rate by working out the volume of water that was entering the river. • This uses the rainfall data from met office.
 Hydrological Cycle
 Catchment Area
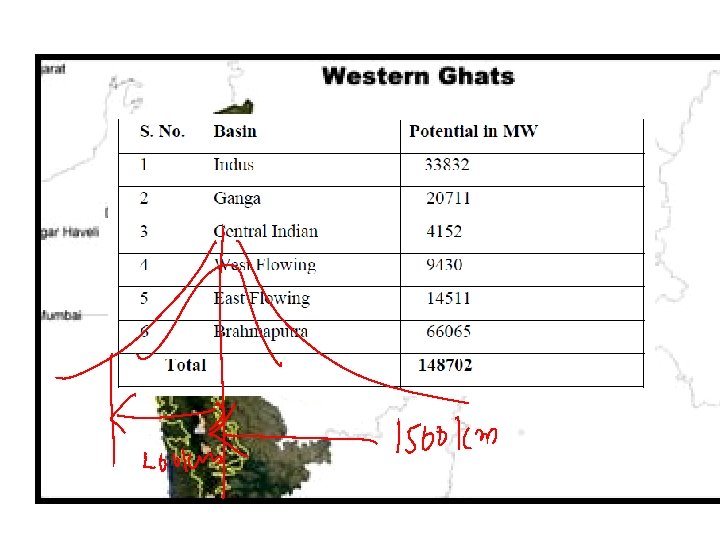
 The Western Ghats
 East Flowing River : The Krishna
 East Flowing River : The Krishna Catchment Area: 2, 58, 958 Sq. km Annual Yield: 57, 000 M. cum
 The West Flowing River: The Sharavathi The river Sharavathi originates at a height of 730 m near Ambuthirtha, in Shimoga district. It flows in a north-west direction, in its long, 132 -km journey.
 Rain Fall Data : Hydrograph
 Flow Duration Curve
 Discharge, Cumecs Average Flow duration Curve Mean of 10 – 30 years Q 50% Qm Q 95% Q 100% % of time
 Estimation of Hydro Power Potential • Mean potential power • The annual mean discharge is the value that equalizes the area of the annual flow duration curve. • The average of mean flow is understood as the arithmetic mean of annual mean discharges for a period of 10 to 30 years. • Minimum potential power, or theoretical capacity of 100%, is the term for the potential computed from the minimum flow observed. Np 100 • Small potential power. The theoretical capacity of 95% can be derived from the discharge of 95% duration as indicated by the average flow duration curve. Np 95. • Median or average potential power. The theoretical capacity of 50% can be computed from the discharge of 50% duration as represented by the average flow duration curve. Np 50.
 Determination of storage capacity & Submergence of Catchment Area
 Creation of Reservoir
 Reservoirs • A reservoir is a manmade lake or structure used to store water. • A reservoir with dam has an uncontrolled inflow but a largely controlled outflow. • The water available for storage is totally a function of the natural stream flow. • Reservoir capacity is the max. volume of water that can be stored in the particular reservoir. • It is the normal maximum pool level behind a dam. • This can be calculated by using a topographic map of the region.
 Mass Flow Analysis Cum. Discharge Cum. Reservoir Draft month Discharge 1 296 -259. 917 1 -259. 92 2 386 682 -169. 917 2 -429. 83 3 504 1186 -51. 9167 3 -481. 75 4 714 1900 158. 083 4 -323. 67 5 810 2710 254. 083 5 -69. 58 6 1154 3864 598. 083 6 528. 50 7 746 4610 190. 083 7 718. 58 8 1158 5768 602. 083 8 1320. 67 9 348 6116 -207. 917 9 1112. 75 10 150 6266 -405. 917 10 706. 83 11 223 6489 -332. 917 11 373. 92 12 182 6671 -373. 917 12 0. 00 555. 9167
 Cumulative Discharge curve : Reservoir capacity Feeding Flow Storage Capacity Annual Mean Discharge
 Mass Flow Analysis Cum. Discharge Reservoir Draft month Cum. Reservoir Draft month Discharge 1 296 -259. 917 1 -259. 92 2 386 682 -169. 917 2 -429. 83 3 504 1186 -51. 9167 3 -481. 75 4 714 1900 158. 083 4 -323. 67 5 810 2710 254. 083 5 -69. 58 6 1154 3864 598. 083 6 528. 50 7 746 4610 190. 083 7 718. 58 8 1158 5768 602. 083 8 1320. 67 9 348 6116 -207. 917 9 1112. 75 10 150 6266 -405. 917 10 706. 83 11 223 6489 -332. 917 11 373. 92 12 182 6671 -373. 917 12 0. 00 555. 9167
 Cumulative Draft Reservoir Draft for Power Generation Reservoir Volume = 1800 X 106 m 3
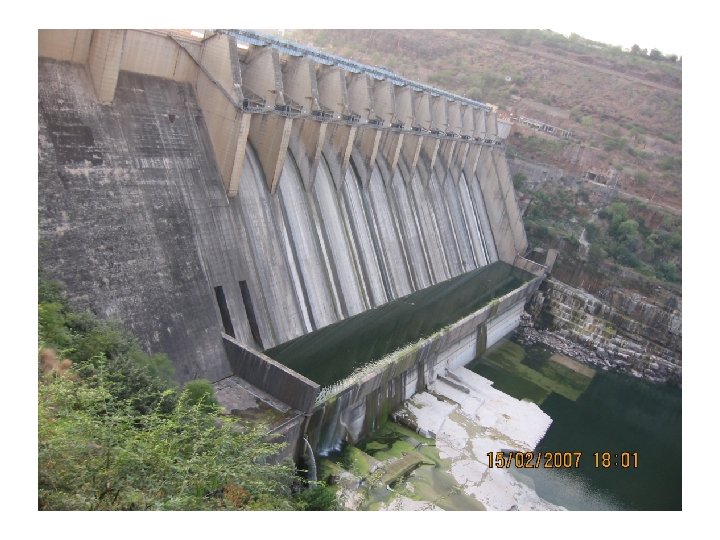
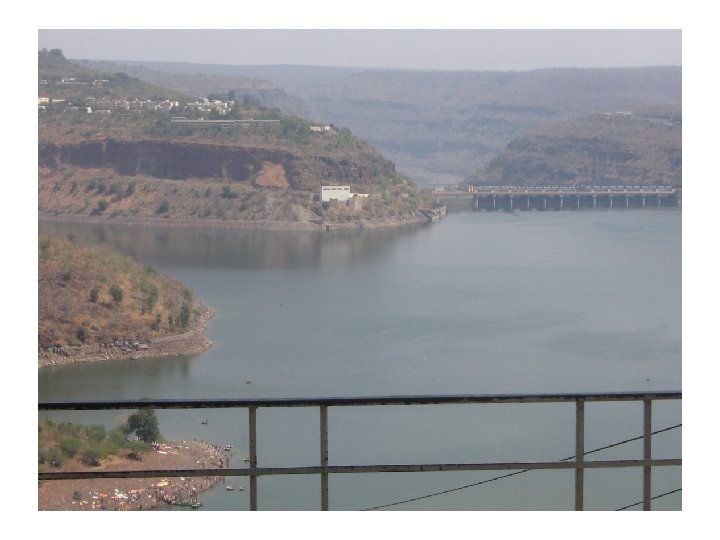
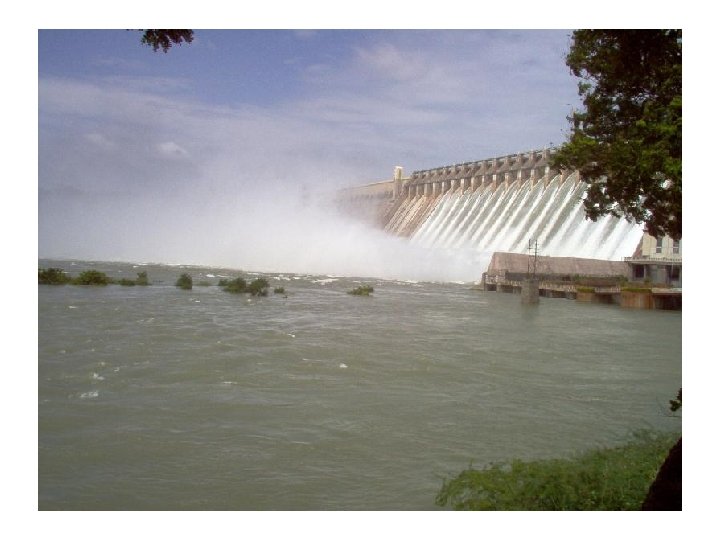
 Creation of Reservoir : Srisailam Height of Dam: 143. 90 m Maximum Depth of Reservoir : 214. 76 m Capacity of the Reservoir: 8, 700 M cum
 Case Studies Kalinadi Hydro Electric Project
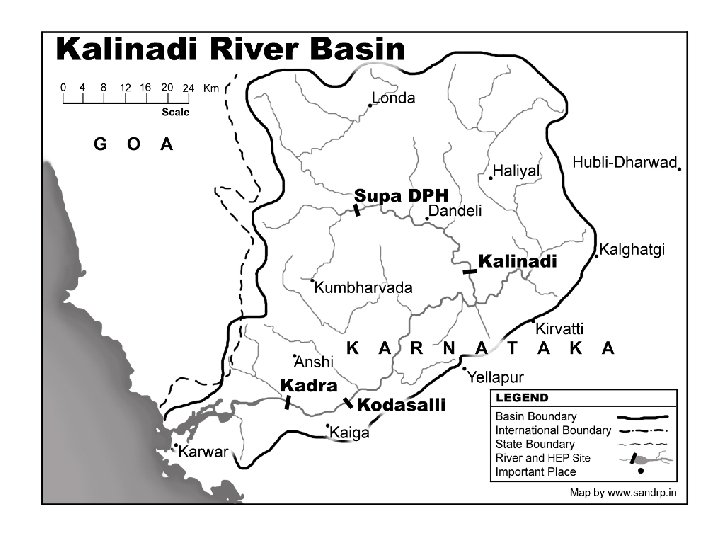
 Kalinadi Hydro Electric Project • The Kali River or Kalinadi is a river flowing through Karwar, Uttara Kannada district Karnataka state in India. • The river takes its birth at diggi in Western Ghats, a small village in Uttar Kannada district. • The river is the lifeline to some 4 lakh people in the Uttara Kannada district. • Supports livelihoods of tens of thousands of people including fishermen on the coast of Karwar. • There are many dams built across this river for the generation of electricity. • One of the important Dams build across Kali river is the Supa Dam in Ganeshgudi. • The river extends to 184 kilometers before joining Arabian Sea.
 KHEP Project Flow Chart
 KHEP Project Flow Chart – Part 1
 Supa Dam Power House • Concrete Dam • Dimensions: 101 Mtrs high and 332 Mtrs long concrete gravity dam is built across the Kalinadi river in Joida Taluk of Uttara Kannada District. • Catchment area of 1057 Sq. Kms • Gross Storage Capacity : 4178 M cum. • Live Storage Capacity: 4115. 2 M cum. • Design Head: 72 m • Design Discharge: 154 cumecs. • Type turbine : Vertical Francis : 2 × 50 MW • Rated Speed : 200 rpm
 KHEP Project Flow Chart – Part 2
 Nagjhari Power House • Takes water from Bommanahalli Pick up Dam : Concrete/masonry/earthen. • Gross Storage Capacity : 97. 25 M cum. • Live Storage Capacity: 83. 9 M cum. • Design Head: 347 m • Design Discharge: 275. 5 cumecs. • Type turbine : Vertical Francis : 3 × 135 + 3 × 150 MW • Rated Speed : 375 rpm
 KHEP Project Flow Chart – Part 3
 Kodasalli & Kadra Electric Projects • Kodasalli Dam : Concrete/earthen. – – – Gross Storage Capacity : 286. 49 cum. Live Storage Capacity: 198. 82 cum. Design Head: 37 m Design Discharge: 369 cumecs. Type turbine : Vertical Kaplan : 3 × 40 MW Rated Speed : 166. 67 rpm • Kadra Dam : Concrete/earthen. – – – Gross Storage Capacity : 388. 92 cum. Live Storage Capacity: 209. 06 cum. Design Head: 32 m Design Discharge: 526. 5 cumecs. Type turbine : Vertical Kaplan: 3× 50 MW Rated Speed : 142. 86 rpm
 Case Studies Sharavathi Hydro Electric Project
 Sharavathi Catchment Area
 Sharavati Project • The river Sharavathi originates at a height of 730 m near Ambuthirtha, in Shimoga district. • It flows in a north-west direction, in its long, 132 -km journey. • The Sharavathi is joined by several tributaries. • It traverses through hilly terrain and dense forests. • After a stretch of 80 km along its course, the river drops down a steep mountain face of 293 m – a visually delightful spectacle known as the Jog Falls. . • From this breathtaking leap, the river continues its journey till it flows into the Arabian Sea near Honnavar. • The total catchment area of the river up to its confluence with the Arabian Sea is 2, 774 sqkm. • The basin receives a rainfall ranging between 5000 -7500 mm. • About 95% of the rainfall is received during the month of June to September
 Jog Falls
 Sharavathi Hydro Electric Project – Flow Chart
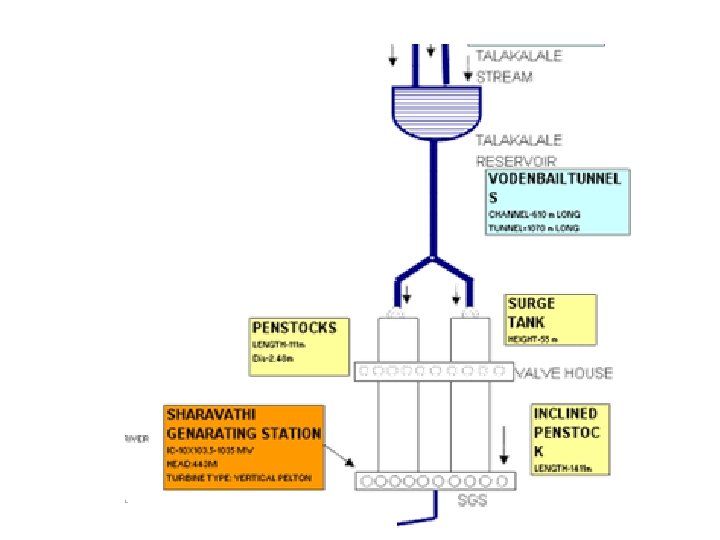
 Sharavati Project : Reservoir & Wheel • • • The name of the reservoir and dam is Linganamakki. This is located 9. 63 km upstream of Jog Falls. The catchment area for the dam is 1991. 71 km 2 Maximum (Average) discharge possible for Power Generation : 315 – 473 Cumecs. Techno-economically feasible discharge : 285 cumecs. The top of the dam is 1819 feet (554 m) above sea level. The area of the dam is 300 km 2 The storage capacity of the Reservoir is : 4, 419. 26 million cubic meters. Submerging 50. 62 km² of wetland 7 km² of dry land, the remaining being forest land wasteland. [
 Sharavati Generating Station • Capacity: 1035 MW. • Head avaialabe: 443 m • Specific Speed: 0. 1231 N MORE ADAPTED TYPE OF TURBINE AS FUNCTION OF THE SPECIFIC SPEED. Specific Speed in r. p. m. Turbine type Jump height in m Until 18 Pelton of an injector 800 From 18 to 25 Pelton of an injector 800 to 400 From 26 to 35 Pelton of an injector 400 to 100 From 26 to 35 Pelton of two injectors 800 to 400 From 36 to 50 Pelton of two injectors 400 to 100 From 51 to 72 Pelton of four injectors 400 to 100
 Final Acceptable design of Sharavati Project • • • Total Available Capacity: 1035 MW. Head availabe: 443 m Techno-economically viable capacity per unit: 103. 5 MW Specific Speed: 0. 01231 N No. of Units : 10 Final Selection: Vertical Pelton
 Sharavathi Power Unit Selection of Wheel: Four Jet Vertical Pelton : rpm 300
 The Hindu News • Dated February 7, 1958: Sharavathi project • Mr. S. K. Patil, Union Minister for Power and Irrigation, inaugurated on February 5 the Rs. 40 -crore Sharavathi Hydro. Electric Project at Linganmakki, five miles from Gerosappa Falls. • Mysore has been the pioneer in generating electricity, her first attempt at power generating dating to 1902. The Sharavathi project is the biggest step taken in the development of power in the State. • The Union Minister paid a tribute to the skill and efficiency of Mysore engineers. • The Chief Minister of Mysore Mr. S. Nijalingappa, who presided, said, “The hydro-electric potential of the river systems in the State is vast and it is estimated that it would be possible to generate as much as three million k. W by harnessing the several rivers and streams. "
 Performance during the year 2009 -2010 • Generation during the year was 26020 MU as against 25080 MU during the previous year. • Turnover during the year was Rs. 4397 crores as against Rs. 4148 crores during the previous year, increase in energy sales in thermal and DG Plant. • Profit before tax during the year was at Rs. 711 crores as against Rs. 392 crores during the previous year.