a66888ac9e7775fe0f2ef7f606c951a9.ppt
- Количество слайдов: 129

HVAC, Building Tune-up, & Commissioning Bruce Dobbs, P. E. Mechanical Systems Engineering

Learning Objectives • Background • Basic Tune-Ups • Benchmarking • In-Depth Tune-Ups • Benefits of Commissioning © 2012 Portland General Electric 2

Levels of Commissioning Basic -Up Tune Full Blown Commissioning Performed By Customer Specialist Required © 2012 Portland General Electric 3

Construction Design Development • Conceptual • Budgeting • Construction Documents • Bid • Value Engineering © 2012 Portland General Electric 4

Mechanical Systems Construction • Priority level varies by project • Owner/Architect need to be educated on system • Affected by project budget © 2012 Portland General Electric 5

Utilities • Cost of Gas • Cost of Electricity • Source of Power © 2012 Portland General Electric 6

Current Energy Trends • Small Carbon Footprint • Net Zero © 2012 Portland General Electric 7

Building tune-ups are best done starting from the outside and working inward © 2012 Portland General Electric 8

Consider changes that have occurred since original design/construction • • • © 2012 Portland General Electric Personal Computers Occupancy Patterns Data Processing Areas Relative cost of utilities Tenant type 9

Basic Tune-Ups © 2012 Portland General Electric 10

Basic Tune-Ups © 2012 Portland General Electric 11

Basic Lighting Tune-Up Measure Light Levels • IESNA recommended foot candle (fc) readings for different occupancies and task types • Orientation and simple visual tasks (3 -10 fc) • Common visual tasks (30 - 100 fc) • Special visual tasks (300 - 1000 fc) • If over lit – wasting energy • If under lit • Safety Issues (OSHA) • Task Lighting can be added • Occupant needs can change over time • Computers, Drafting, Quality Control © 2012 Portland General Electric 12

Basic Lighting Tune-Up Implement a Maintenance Plan Group Re-lamping • Calculators • GE - http: //www. gelighting. com/apo/resources/online_tools/group_relamping. htm • Factors Affecting Relamping Decisions • Lamp type – H. I. D, Fluorescent, Incandescent • Depreciation curve • Labor and material costs • Clean lamps and fixtures © 2012 Portland General Electric 13

Basic Lighting Tune-Up Implement a Maintenance Plan Upgrade Existing T 8 Lamps • Light Quantity – Measure light levels • Light Quality – High-performance T 8 s* • Energy Savings • Reduced-wattage T 8 s* • Delamping (Check Ballast Compatabiltiy) * http: //www. cee 1. org/com-lt/lamps-ballasts. xls © 2012 Portland General Electric 14

Basic Lighting Tune-Up Implement a Maintenance Plan Upgrade Ballasts • Replace older standard electronic with high-performance* • Adjust light levels by choosing correct ballast factor • ~. 7 (low), ~. 9 (normal), ~1. 1+ (high) • Number of lamps per fixture may be reduced • Identify and replace any magnetic ballasts • No longer manufactured • Replace with high-performance electronic ballasts & high-performance T 8 lamps* • Easy to determine using “Discriminator” or “Flicker Checker” * http: //www. cee 1. org/com-lt/lamps-ballasts. xls © 2012 Portland General Electric 15

Basic Lighting Tune-Up Calibrate Controls • Occupancy Sensors • Adjust settings • Use correct type • Time Clocks • Adjust regularly or use astronomical clock • Replace failed photosensors • Sweep Controls • Zoning © 2012 Portland General Electric 16

Basic HVAC Tune-Up © 2012 Portland General Electric 17

Basic HVAC Tune-Up Implement a Maintenance Plan • Change Filters Per Manufacturer Recommendations • Clean Outdoor Condensing Units • Economizer Functioning? • Minimum Air Damper Positioning © 2012 Portland General Electric 18

Basic HVAC Tune-Up Consider Upgrading to Programmable Thermostats • Can save up to 10% on heating and cooling costs (US DOE) • Relatively inexpensive i. e. less than $250 • Payback can easily be less than four years • More comfortable © 2012 Portland General Electric 19

Basic HVAC Tune-Up Enable Efficiency • Set up/Set back • Schedules (thermostats & timers) • Optimum Start • Heat Pumps - Install controls to prevent unnecessary use of resistance heat © 2012 Portland General Electric 20

Basic HVAC Tune-Up Periodically Check Controls • Occupants May Modify • Daylight Savings Time • Replace Batteries (If Applicable) • Hours of operation changing –seasonal or business cycle • Work performed may require lower/higher temperature set points © 2012 Portland General Electric 21

Basic HVAC Tune-Up Relax Temperatures • Heating energy can be reduced by about 3% if the heating set point is dropped 1 ºF. (Energy Star) • Cooling energy can be reduced by about 1% if the cooling set point is raised 1 ºF. (Engineering Estimate) • Keep a 3 ºF or larger dead band. © 2012 Portland General Electric 22 22

A Tale of Three Set Points Building Characteristics: • Retail Occupancy • Total Floor Area of 1, 600 Square Feet HVAC: • Air Flow 1600 CFM • Cooling with 4 Ton Packaged Rooftop • Heating with Gas Furnace in Packaged Rooftop © 2012 Portland General Electric 23

Scenario 1: Fan Always “ON” Thermostat Settings: • Occupied Set Points • Cooling to 73º F • Heating to 70º F • Fan set to ON • Unoccupied Set Points • Cooling to 80º F • Heating to 60º F • Fan set to ON Estimated Annual Energy Consumption: • 25, 600 k. Wh/yr ($2048/yr) • 448 Therms/yr ($358/yr) © 2012 Portland General Electric 24

Scenario 2: Fan Always “AUTO” Thermostat Settings: • Occupied Set Points • Cooling to 73º F • Heating to 70º F • Fan set to AUTO • Unoccupied Set Points • Cooling to 80º F • Heating to 60º F • Fan set to AUTO Estimated Annual Energy Consumption: • 23, 475 k. Wh/yr ($1878/yr) • 320 Therms/yr ($256/yr) © 2012 Portland General Electric 25

Scenario 3: Fan “ON” For Occupancy Thermostat Settings: • Occupied Set Points • Cooling to 73º F • Heating to 70º F • Fan set to ON • Unoccupied Set Points • Cooling to 80º F • Heating to 60º F • Fan set to AUTO Estimated Annual Energy Consumption: • 24, 750 k. Wh/yr ($1980/yr) • 397 Therms/yr ($317/yr) © 2012 Portland General Electric 26

Benchmarking © 2012 Portland General Electric 27

Who Has Time for This? Step 1: Get a copy of your utility bill. Step 2: Enter k. Wh data in a spreadsheet. Step 3: Repeat. Once a month for years. Step 4: (Optional) Dig through files to find past bills. © 2012 Portland General Electric 28

Here’s a Quick Alternative 8100 k. Wh/day x 365 days/yr = 2, 920, 000 k. Wh/yr © 2012 Portland General Electric 29

Compare to Regional Averages Northwest Energy Efficiency Alliance Survey • Occupancy Type • Location • Floor Area • Building Systems © 2012 Portland General Electric 30

Compare to National Averages Overview of Commercial Buildings • Occupancy Type • Census Region • Floor Area • Occupancy Level • Age of Facility • Etc. © 2012 Portland General Electric 31

Benchmarking Combined NEEA and EIA Results (Plus a little tweaking) © 2012 Portland General Electric 32

Benchmarking Using Results 120, 000 k. Wh/yr 6, 200 Square Foot Office = 19. 3 k. Wh/SF/yr Is this good or bad? © 2012 Portland General Electric 33

Benchmarking Another Option Portfolio Manager Overview Portfolio Manager is an interactive energy management tool that allows you to track and assess energy and water of your building(s) online. Portfolio Manager can help you set investment priorities, identify under-performing buildings, verify efficiency improvements, and receive EPA recognition for superior energy performance. © 2012 Portland General Electric 34

Energy Star – Facility Types • • • • Banks/Financial Institutions Courthouses Data Centers Hospitals (Acute Care and Children’s) Hotels/Motels Houses of Worship K-12 Schools Medical Offices Residence Halls/Dormatories Retail Stores Supermarkets/Grocery Stores Warehouses (Refrigerated/Non Refrigerated) © 2012 Portland General Electric 35

Go To www. energystar. gov © 2012 Portland General Electric 36

Energy Star – Energy Performance Indicators Through ENERGY STAR, EPA offers plant energy performance indicators (EPI) to enable energy managers and corporate executives to evaluate the energy efficiency of their plants relative to that of the industry. EPIs are currently available for: • • • Cement Manufacturing Container Glass Manufacturing Plants Cookie and Cracker Bakeries Corn Refining Flat Glass Manufacturing Plants Frozen Fried Potato Processing Plants Juice Processing Plants Motor Vehicle Manufacturing Pharmaceutical Manufacturing Pulp and Paper Manufacturing More Info: www. energystar. gov/index. cfm? c=in_focus. bus_industries_focus#plant © 2012 Portland General Electric 37

Energy Star – General Industrial Information Whether you are on the industrial list or not, EPA also offers plant utility and process improvement resources for: • • • Compressed Air Motors Process Heating Pumping Steam © 2012 Portland General Electric r ffe o n e& y a t c thes enc s ru for ffici y T es y E es g er ntiv erg niti En ce En rtu in er ppo h o ot 38

In-Depth Tune Ups © 2012 Portland General Electric 39

Air Distribution System Diffusers / Grilles • Clean • Balancing dampers set properly • Airflow needs to be adequate for space © 2012 Portland General Electric 40

Determining Proper Airflow • Perform Load Estimate & Calculate Airflow • Measure Existing Airflow & Compare with Load Estimate • Adjust Airflow Accordingly © 2012 Portland General Electric 41

Airflow Rules of Thumb • • • West Zone = 1. 5 – 2. 5 CFM/SF East Zone = 1. 25 – 2. 0 CFM/SF North Zone = 0. 50 – 1. 0 CFM/SF South Zone = 1. 0 – 1. 5 CFM/SF Core Zone = 0. 4 – 0. 75 CFM/SF CFM: Cubic Feet Per Minute SF : Square Feet © 2012 Portland General Electric 42

Ductwork • Can Duct Handle Required Airflow? • Noise • Additional Fan Horse Power (HP) • Tally Sum of Diffuser Airflows to Determine Airflow in Duct • Use ductolator to determine pressure drop in duct (< 0. 15” w. g. /100 ft. ) w. g. : Water Gauge © 2012 Portland General Electric 43

Consequences of Excessive Pressure Drop (PD) in Duct Given • 50 ft duct length • Airflow twice original design • Original PD is 0. 175 New PD = 0. 175 (2)2 = 0. 70” w. g. Additional fan energy operating cost= 0. 747 x 10000 cfm x (0. 70 – 0. 175)/(0. 65 x 6356) x 2000 hr/yr = 1, 900 k. Wh ($127/yr) CFM: Cubic Feet Per Minute © 2012 Portland General Electric w. g. : Water Gauge 44

Keep Return / Supply Duct Clean • Adds Pressure Drop • Fungi / Mold • Odors © 2012 Portland General Electric 45

Fan Systems Static Pressure (SP) Calibration • Set SP at level that will satisfy furthest diffuser • Calibrate sensor once a year © 2012 Portland General Electric 46

Fan Systems Control Tune-ups • • • Tighten VIV/FDD linkages Check for broken /disconnected linkages Check seals of FDD Tighten fan belts Clean filters Clean coils VIV: Variable Inlet Vane FDD: Fan Discharge Damper © 2012 Portland General Electric 47

Dirty Filters and Coils May Increase Fan Energy © 2012 Portland General Electric 48

Example (VAV Only) • AHU with 50, 000 CFM airflow. Dirty filter adds 0. 75” w. g. pressure drop. • Additional Power = (0. 747 x 50, 000 x 0. 75)/(0. 65 x 6, 356) = 6. 8 k. W • Annual Electricity Consumption = 6. 8 x 2500 hrs = 16, 951 k. Wh • Increased operating cost = 16, 951 x $0. 0728/k. Wh = $1, 234 AHU: Air Handling Unit © 2012 Portland General Electric 49

Dirty Coils • PD ≈ V 2 • High velocity uses more HP (VAV only) • Poor Heat Transfer • More pump energy • Poor sensible/latent cooling • Wasted compressor energy PD: Pressure Drop HP: Horse Power VAV: Variable Air Volume © 2012 Portland General Electric 50

Cooling Coils Improperly Functioning Valves • Check Cv • Wasted pump energy • Wasted fan energy Cv: Valve Coefficient © 2012 Portland General Electric 51

Example • AHU with 50, 000 cfm airflow. Dirty cooling coil adds 1” w. g. pressure drop. • Additional Power = (0. 747 x 50, 000 x 1)/(0. 65 x 6, 356) = 9. 0 k. W • Annual Electricity Consumption = 9. 0 x 2500 hrs = 22, 600 k. Wh • Increased operating cost = 22, 600 x $0. 0728/k. Wh = $1, 645 AHU: Air Handling Unit © 2012 Portland General Electric 52

Combined Results Total increase in operating cost due to dirty filters and cooling coil: Operating Cost - $1, 234 + $1, 645 = $2, 879 © 2012 Portland General Electric 53

Not All Fan Control Methods Created Equal Three Main Types • Fan discharge dampers • Variable inlet vanes • Variable speed drives © 2012 Portland General Electric 54

Fan Control Methods Fan Discharge Dampers • Good pressure control • Do not decrease fan energy requirements © 2012 Portland General Electric 55

Fan Control Methods Variable Inlet Vanes • Good flow/pressure control • Marginal decrease in fan energy requirements © 2012 Portland General Electric 56

Fan Control Methods Variable Speed Drives • Good flow/pressure control • High impact on fan power requirements © 2012 Portland General Electric 57

Inadequate Oil Changes • Decreased Cooling Capacity • Increased Energy Consumption © 2012 Portland General Electric 58

Chiller Operation Reset Chilled Water Temperature • For each 1 degree reset, 3% energy savings • Determine maximum supply chilled water temperature necessary to maintain building load • Maintain log and calculate energy savings © 2012 Portland General Electric 59

Supply Air Temperature • Supply Air Temperature (SAT) ≈ 55 o. F • Relative Humidity (RH) ≈ 50% © 2012 Portland General Electric 60

Comfort Conditions Cooling • Room Temp between 74 o. F and 78 o. F • RH between 30% and 60% Heating • Room Temp between 70°F and 74°F • RH between 30% & 50% RH: Relative Humidity © 2012 Portland General Electric 61

Cooling Coils • 2 -way Valves preferable to 3 -way • Valves Usually Not Sized Properly • Poor Cv • Oversized Cv: Valve Coefficient © 2012 Portland General Electric 62

Too Low SAT Creates Issues • Higher reheat energy • Low RH in buildings • Higher electrical and natural gas costs SAT: Supply Air Temperature RH: Relative Humidity © 2012 Portland General Electric 63

Low Delta-T Syndrome Chiller Operating Issues • Short cycling • Loss of building control • Inefficient operation © 2012 Portland General Electric 64

Central Chilled Water Plant © 2012 Portland General Electric 65

Optimizing Chilled Water Plant Operation • Chiller Control • Pump Control • Cooling Tower Control © 2012 Portland General Electric 66

Chiller Control Optimum Chilled Water Temperature • RH is a consideration • 3% savings per 1 degree reset RH: Relative Humidity © 2012 Portland General Electric 67

Chiller Maintenance Condenser Maintenance • Maintain clean tubes § Clean twice/year • Minimize condenser water temperatures § Dependent of chiller type/age © 2012 Portland General Electric 68

Chiller Maintenance Maintain Approach Temperatures • TCW – TR < 9 o. F • Elevated approach temperatures indicate dirty tubes and/or low refrigerant TCW : Condenser Water Temperature TR : Refrigerant Temperature © 2012 Portland General Electric 69

Chiller Operation Evaporator Maintenance • Maintain clean tubes • Maintain adequate refrigerant charge • Maintain adequate oil change © 2012 Portland General Electric 70

Cooling Towers Approach Temperature • Tapp=Tlvg – Twb • Maintain minimum approach temperature possible Tapp : Approach Temperature Tlvg: Condenser Leaving Water Temperature Twb: Outdoor Wet Bulb Temperature © 2012 Portland General Electric 71

Boiler Maintenance Blow Down Control • • Blow down boiler daily No longer than necessary Prevents scaling Safer operation © 2012 Portland General Electric 72

Boiler Maintenance Combustion Air • Excess O 2 levels < 2. 5 – 3% • Excess CO levels < 200 parts/million © 2012 Portland General Electric 73

Boiler Maintenance Water Treatment • Number of cycles should be between 5 and 6 • Primarily intended to reduce scaling on boiler tubes © 2012 Portland General Electric 74

Boiler Maintenance Scaling • Calcium Carbonate creates thin layer of insulation on tubes • Scaling detected by visual inspection and measuring stack temperature © 2012 Portland General Electric 75

Boiler Plant Improvements Stack Economizer • Reheats feedwater to boiler • Reduces boiler consumption by 10 -15% • Works best on boilers operating over 60 PSIG: Pounds Per Square Inch (Gauge) © 2012 Portland General Electric 76

Boiler Plant Improvements Automated Blow Down Control • Measure conductivity Micro MHO’s (m. MHO’s) • Prevents excessive blow down • Serves energy and chemicals © 2012 Portland General Electric 77

Boiler Plant Improvements O 2 Trim Control • Vary combustion air intake as function of excess O 2 levels in stack • Minimizes excess O 2 levels • Improves efficiency by 2 -5% © 2012 Portland General Electric 78

Boilers Oversized Boiler • • Short cycling Cracked refrectory Excessive purging Inefficient burner operation © 2012 Portland General Electric 79

Boilers Should Boiler Be Shut Down or Left On Line • Usually only economical to shut down if burner is high/low/off type • Modulating burners with high turn down should usually be left on line © 2012 Portland General Electric © 2012 PGE 80

Benefits of Commissioning © 2012 Portland General Electric 81

Commissioning A process for improving an existing building’s performance by identifying and implementing relatively low cost operational and maintenance improvements © 2012 Portland General Electric 82

Commissioning ensures that the new building operates initially as the owner intended and that the building staff are prepared to operate and maintain its systems and equipment © 2012 Portland General Electric 83

Commissioning Goals of Retrocommissioning Process • Insure the building is performing efficiently and as expected • Recommend and implement measures that improve equipment performance • Verify that the building owner and staff receive adequate documentation and assistance to implement improvements © 2012 Portland General Electric 84

Key Findings (1 of 3) • Commissioning is arguably the single-most cost-effective strategy for reducing energy, costs, and greenhouse-gas emissions in buildings today • Energy savings tend to persist well over at least a 3 - to 5 -year timeframe, but data over longer time horizons are not available • Median commissioning costs: $0. 30/ft 2 and $1. 16/ft 2 for existing buildings and new construction, respectively (and 0. 4% of total construction costs for new buildings) • Median whole-building energy savings: 16% and 13% • Median payback times: 1. 1 and 4. 2 years • Median benefit-cost ratios: 4. 5 and 1. 1, cash-on-cash returns of 91% and 23% © 2012 Portland General Electric 85

Key Findings (2 of 3) • Large reductions in greenhouse-gas emissions are achieved, at a negative cost of -$110 and -$25/tonne CO 2 equivalent • High-tech buildings particularly cost-effective, and saved large amounts of energy due to their energy-intensiveness • The database incorporates the work of 37 commissioning providers • Projects with a comprehensive approach to commissioning attained nearly twice the overall median level of savings, and five-times the savings of projects with a constrained approach • Non-energy benefits are extensive and often offset part or all of the commissioning cost © 2012 Portland General Electric 86

Key Findings (3 of 3) • Annual energy-savings potential of $30 billion by the year 2030, and 360 MT CO 2 -eq emissions reductions. The corresponding future industry would have a sales volume of $4 billion per year • Approximately 24, 000 jobs need to be created in order to deliver the potential. This is “small” in the context of the number of people currently employed in related trades • Commissioning America” in a decade is an ambitious goal, but “do-able” and very consistent with this country’s aspirations to simultaneously address energy and environmental issues while creating jobs and stimulating economic activity © 2012 Portland General Electric 87

Hall of Shame Exhaust fan hardwired in an “always on” position Zone damper actuator arm broken (no temperature control) Hot water valve motion impeded by piping layout Rust indicates poor anti-condensation heating control setpoints in supermarket refrigeration cabinet © 2012 Portland General Electric Inadequate fan cooling and excessive fan power due to poor fit between the light fixture and ducting, causing significant duct leakage 88

Hall of Shame Damage to brick façade of pool building due to lack of proper sealing and air management Photosensor (for daylight harvesting) shaded by duct © 2012 Portland General Electric Building envelope moisture entry Photosensor “sees” the electric lamps rather than task-plane illumination Air leakage in an underfloor airdistribution system Failed window film applications 89

Common Faults in Commercial Buildings © 2012 Portland General Electric 90

Commissioning • Importance of Retrocommissioning • Most buildings have never been commissioned • Operational “bugs” typically resolved under severe time constraints • High Utility Bills • Excessive equipment repairs • Poor indoor environmental quality © 2012 Portland General Electric 91

Commissioning Retrocommissioning Expectations • Owner’s needs and project requirements brought to the forefront • Optimize energy efficient design features • Well trained staff members with proper building documentation • Identify indoor environmental quality issues © 2012 Portland General Electric 92

Commissioning Preventative Maintenance Issues • Focuses on component-by-component care rather than holistic view • Very little day-to-day monitoring takes place © 2012 Portland General Electric 93

Commissioning Maintenance Tune-ups Aren’t Enough • Tune-ups tend to focus on maintenance of components and equipment • Retrocommissioning looks at operational issues and focuses on systems approach • Why is a piece of equipment operating, not just how it is operating • Looks at entire system operation not just component operation © 2012 Portland General Electric 94

Retrocommissioning Benefits • Include cost savings and improvements to most aspects of O&M Description Value of Energy Savings Value of Non Energy Savings © 2012 Portland General Electric Range of Values 11¢ – 72¢ per sf 10¢ – 45¢ per sf 95

• Building Performance Improvement • Utility bill analysis § Simultaneous heating and cooling? § Poorly operating economizers? § Excessive air and water flows? • Improved Indoor Air Environmental Quality (IEQ) • • • Moisture or mold Inadequate outside air Poor air circulation Inappropriate control of ventilation air Poor air distribution system Improper building pressurization © 2012 Portland General Electric 96

The Cost of Discomfort • Reduced productivity • Tenant retention • Increased liability © 2012 Portland General Electric 97

• Improved Building Documentation • O&M Manuals • Sequence of operation • System diagrams • Preventative Maintenance Program • Recommissioning plan © 2012 Portland General Electric 98

Retrocommissioning Costs Dependent upon size, complexity and scope Description Value of Ranges Total commissioning costs 13¢ – 45¢ per sf Provider fee as percentage of total commissioning costs Average commissioning cost allocation: – Planning and investigation – Implementation – Verification, tracking & reporting 35% - 71% 69% 27% 4% Simple payback time . 2 up to 2. 1 years © 2012 Portland General Electric 99

Reducing Retrocommissioning Costs • Utilize in-house staff § Gather building documentation • • • Appropriate preventative maintenance tasks Diagnostic trending and functional testing Install/remove diagnostic monitoring equipment Repairs and improvements Track measures after implementation © 2012 Portland General Electric 100

Gather Building Documentation • • • • Previous commissioning reports Drawings Operations and Maintenance (O&M) manuals Testing and Balancing (TAB) reports Original design documentation Equipment list Outside service contractors Service contracts Maintenance logs Control system documentation Energy efficient operating strategies Energy bills Water and sewage bills © 2012 Portland General Electric 101

Retrocommissioning Team Members • Commissioning lead § Contract with third party contractor or member of owner’s staff • Building owner or owner’s representative • Building manager and staff • Contractors and manufacturer’s representatives © 2012 Portland General Electric 102

Retrocommissioning Process Planning • Initial planning activities are critical to the success of any retrocommissioning process as they set the objectives and lay the foundation for the project team to move forward • Planning phase activities § § § Select the process of the project Age of building Size of building Building controls In-house staff Building documentation Set building objectives and obtain support Select a commissioning lead Perform an initial site walk-through Develop a commissioning plan Assemble the retrocommissioning team Hold a project kick-off meeting © 2012 Portland General Electric 103

Retrocommissioning Plan • Defines project’s objectives, scope, schedule, documentation requirements, and the roles and responsibilities of team members § § § General building information and contact information Goals and scope of project Brief building and systems descriptions Owner’s operating requirements List of team members Description of the communication reporting and management protocols Schedule Documentation request Investigation scope and methods Implementation phase requirements Hand off activities © 2012 Portland General Electric 104

Investigation • • • Review facility documentation Perform diagnostic monitoring Perform functional testing Perform simple repairs as the project progresses Develop the master list of findings Prioritize and select operational improvements © 2012 Portland General Electric 105

Implementation • Develop an implementation plan • Implement selected operational improvements § Turn-key implementation § In-house staff implementation § Owner-led implementation • Verify results © 2012 Portland General Electric 106

Hand-off • To ensure the building owners and operators have what they need to monitor and maintain implemented procedures, an intentional and thorough project hand-off is essential • Develop the final report • Compile systems manual • Develop a recommissioning plan • Provide training • Hold a close-out meeting • Implement persistence strategy © 2012 Portland General Electric 107

Strategies for Ensuring Persistence of Benefits • • • Building documentation Equipment lists O&M manuals Control system documents System diagrams © 2012 Portland General Electric 108

Building Staff Training • Ongoing training • Preventative operations and maintenance © 2012 Portland General Electric 109

Performance Tracking • • Benchmarking Energy Star Portfolio Manager Utility tracking Performance monitoring © 2012 Portland General Electric 110

Recommissioning Plan Periodic recommissioning helps maintain the benefits of the original commissioning or retrocommissioning process © 2012 Portland General Electric 111
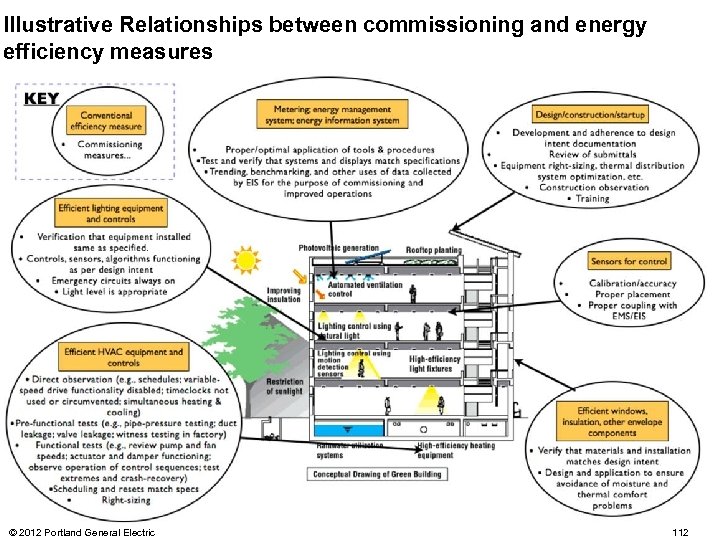
Illustrative Relationships between commissioning and energy efficiency measures © 2012 Portland General Electric 112
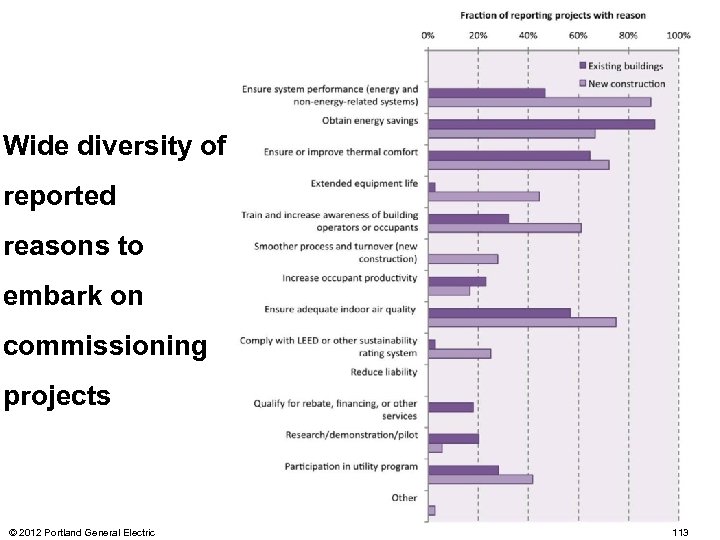
Wide diversity of reported reasons to embark on commissioning projects © 2012 Portland General Electric 113
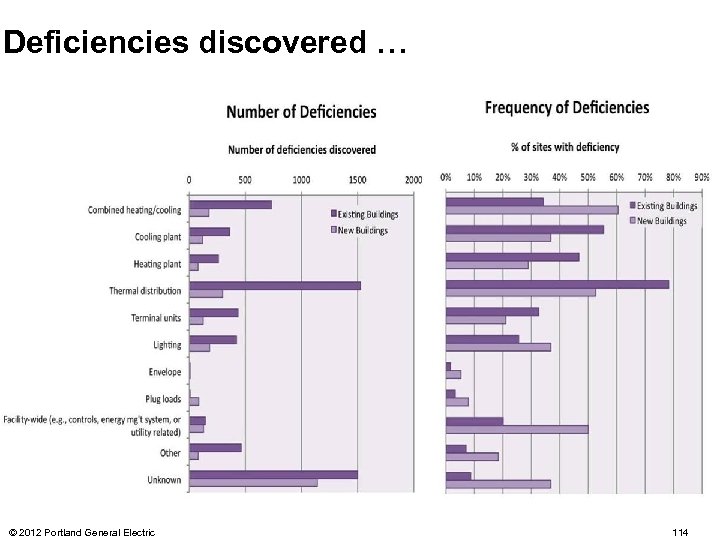
Deficiencies discovered … © 2012 Portland General Electric 114

No correlation between payback time and building size © 2012 Portland General Electric 115
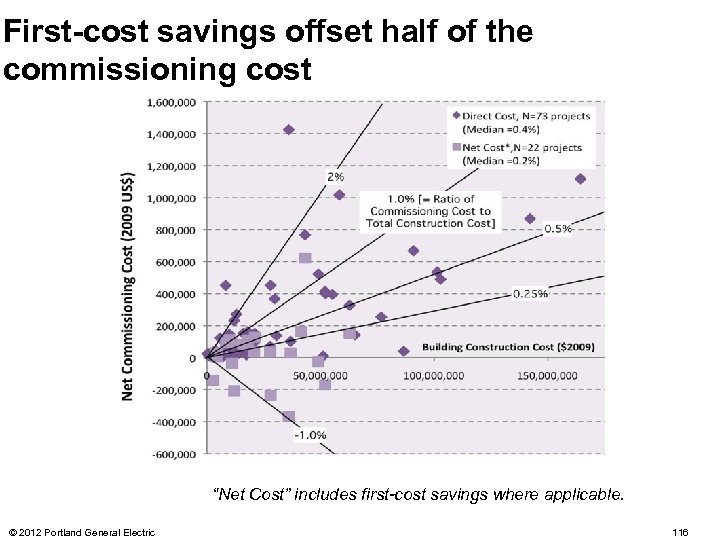
First-cost savings offset half of the commissioning cost “Net Cost” includes first-cost savings where applicable. © 2012 Portland General Electric 116

Excellent outcomes for all building types © 2012 Portland General Electric 117
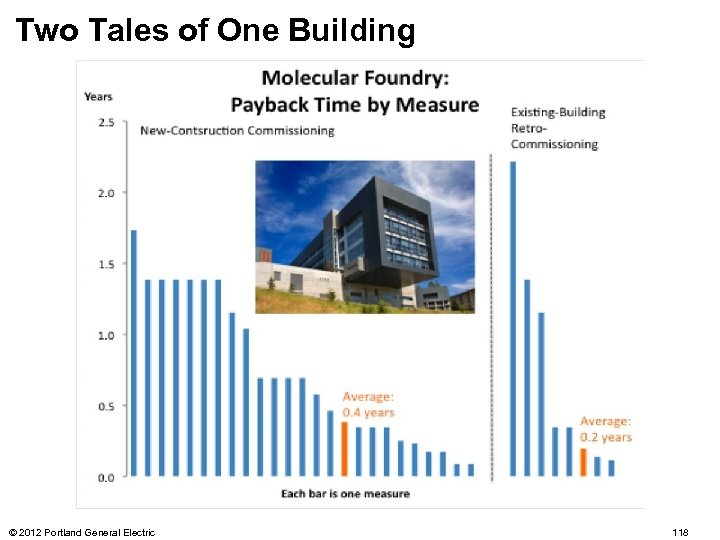
Two Tales of One Building © 2012 Portland General Electric 118
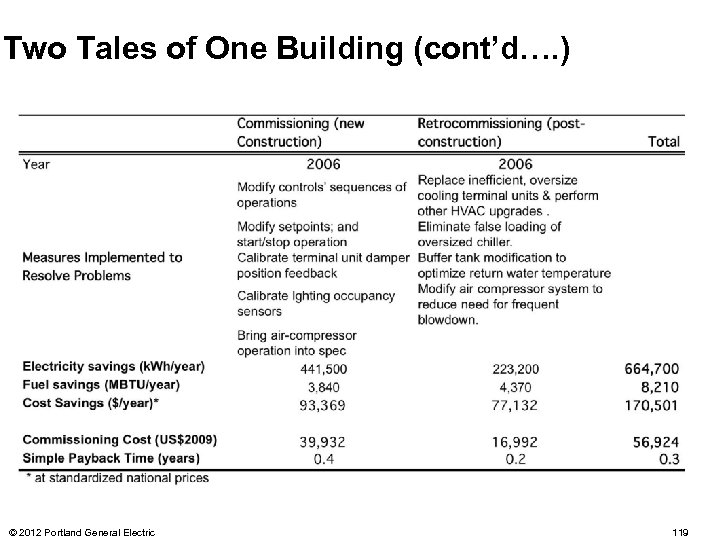
Two Tales of One Building (cont’d…. ) © 2012 Portland General Electric 119
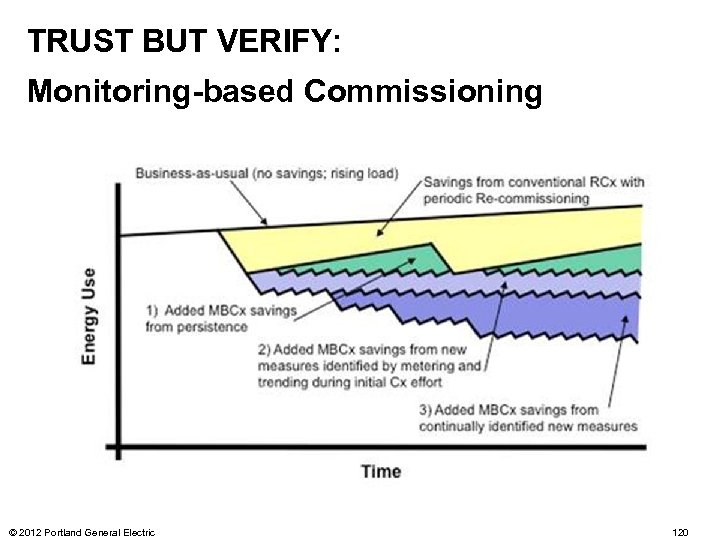
TRUST BUT VERIFY: Monitoring-based Commissioning © 2012 Portland General Electric 120
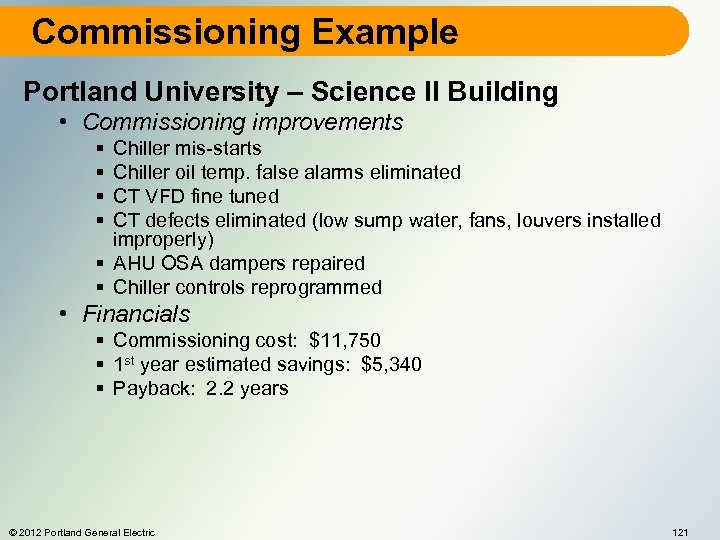
Commissioning Example Portland University – Science II Building • Commissioning improvements § § Chiller mis-starts Chiller oil temp. false alarms eliminated CT VFD fine tuned CT defects eliminated (low sump water, fans, louvers installed improperly) § AHU OSA dampers repaired § Chiller controls reprogrammed • Financials § Commissioning cost: $11, 750 § 1 st year estimated savings: $5, 340 § Payback: 2. 2 years © 2012 Portland General Electric 121
Commissioning Example Department of Administrative Services Bldg • • • Gas-fired boiler inoperable (high temp circuit) Malfunctioning economizers No chilled water reset Malfunctioning daylight dimming controls Financials § Commissioning cost: $20, 900 § 1 st year benefit: $18, 380 § Annual energy savings: $9, 330 © 2012 Portland General Electric 122
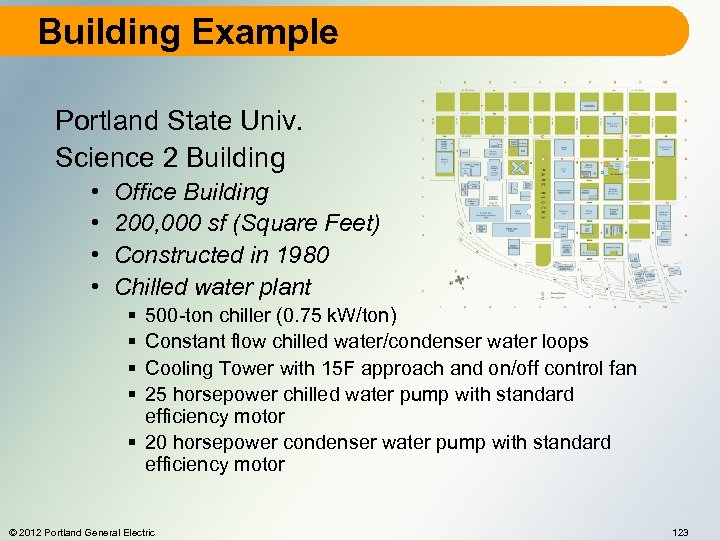
Building Example Portland State Univ. Science 2 Building • • Office Building 200, 000 sf (Square Feet) Constructed in 1980 Chilled water plant § § 500 -ton chiller (0. 75 k. W/ton) Constant flow chilled water/condenser water loops Cooling Tower with 15 F approach and on/off control fan 25 horsepower chilled water pump with standard efficiency motor § 20 horsepower condenser water pump with standard efficiency motor © 2012 Portland General Electric 123

Case Study • Building Description (cont’d) • Boiler plant § (1) cast iron hot water boiler (Eff. = 80%) § Constant flow distribution system § 10 hp hot water pump with standard efficiency motor • Air Distribution System • Constant volume reheat • (4) forward curve fans with capacity of 50, 000 CFM each and 50 hp standard efficiency motors • Bag filter sections on each AHU • Control System • Pneumatic controls © 2012 Portland General Electric 124
Case Study Recommended Building Improvements • EEM-1: Replace chiller with high efficiency rotary screw chiller (0. 52 k. W/ton) with VSD on compressor • EEM-2: Convert chilled water distribution to variable flow • EEM-3: Install VSD and premium efficiency motor on cooling tower fan • EEM-4: Replace existing boiler with condensing boiler (eff. = 92%) • EEM-5: Convert constant flow hot water distribution system to variable flow • EEM-6: Install DDC system to replace existing pneumatic control system EEM: Energy Efficiency Measure © 2012 Portland General Electric 125
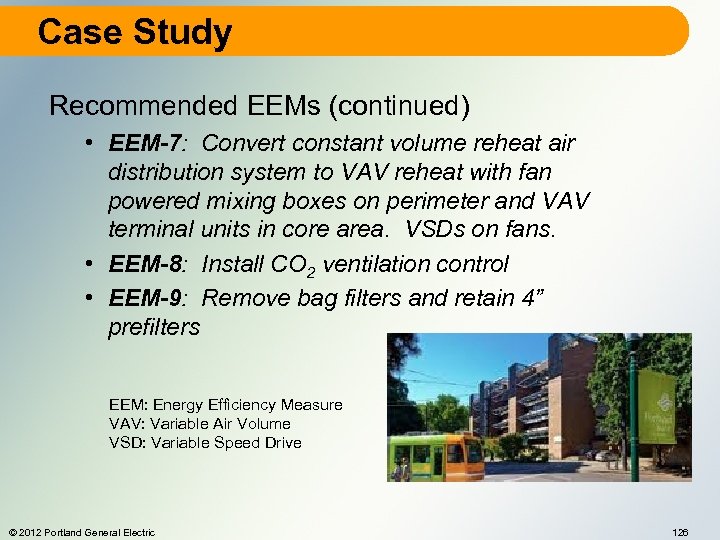
Case Study Recommended EEMs (continued) • EEM-7: Convert constant volume reheat air distribution system to VAV reheat with fan powered mixing boxes on perimeter and VAV terminal units in core area. VSDs on fans. • EEM-8: Install CO 2 ventilation control • EEM-9: Remove bag filters and retain 4” prefilters EEM: Energy Efficiency Measure VAV: Variable Air Volume VSD: Variable Speed Drive © 2012 Portland General Electric 126
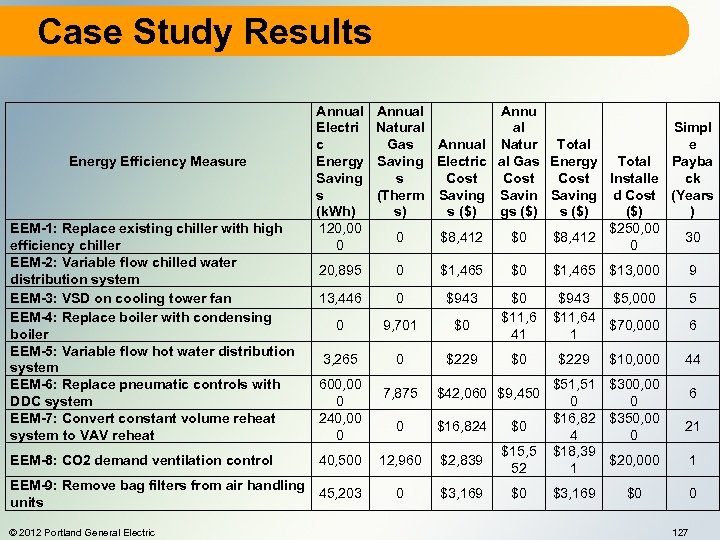
Case Study Results Energy Efficiency Measure EEM-1: Replace existing chiller with high efficiency chiller EEM-2: Variable flow chilled water distribution system EEM-3: VSD on cooling tower fan EEM-4: Replace boiler with condensing boiler EEM-5: Variable flow hot water distribution system EEM-6: Replace pneumatic controls with DDC system EEM-7: Convert constant volume reheat system to VAV reheat EEM-8: CO 2 demand ventilation control Annual Electri c Energy Saving s (k. Wh) 120, 00 0 20, 895 0 $1, 465 $13, 000 9 13, 446 0 $943 9, 701 $0 $943 $5, 000 $11, 64 $70, 000 1 5 0 $0 $11, 6 41 3, 265 0 $229 600, 00 0 240, 00 0 40, 500 EEM-9: Remove bag filters from air handling 45, 203 units © 2012 Portland General Electric Annual Annu Natural al Simpl Gas e Annual Natur Total Saving Electric al Gas Energy Total Payba s Cost Installe ck (Therm Saving d Cost (Years s) s ($) gs ($) ($) ) $250, 00 0 $8, 412 $0 $8, 412 30 0 7, 875 $0 $42, 060 $9, 450 0 $16, 824 $0 12, 960 $2, 839 $15, 5 52 0 $3, 169 $0 $229 $10, 000 6 44 $51, 51 $300, 00 0 0 $16, 82 $350, 00 4 0 $18, 39 $20, 000 1 21 $3, 169 0 $0 6 1 127
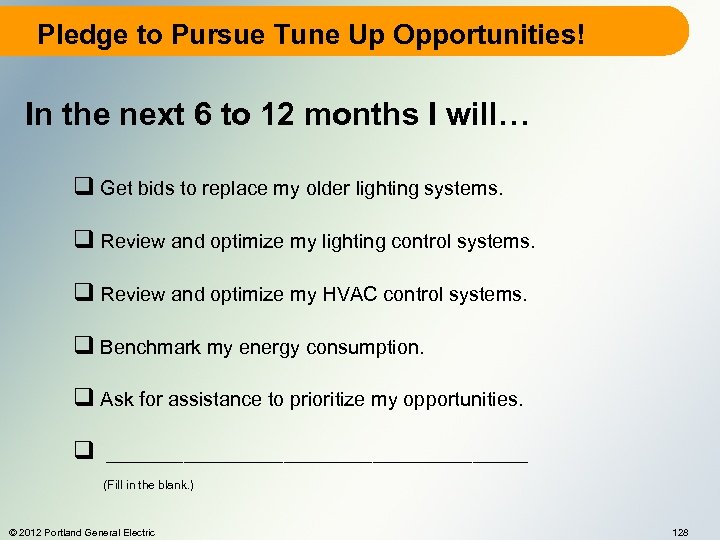
Pledge to Pursue Tune Up Opportunities! In the next 6 to 12 months I will… q Get bids to replace my older lighting systems. q Review and optimize my lighting control systems. q Review and optimize my HVAC control systems. q Benchmark my energy consumption. q Ask for assistance to prioritize my opportunities. q ___________________ (Fill in the blank. ) © 2012 Portland General Electric 128

Thank you Questions? © 2012 Portland General Electric 129
a66888ac9e7775fe0f2ef7f606c951a9.ppt