

f9cabda9f791d181dd7e4db327373611.ppt
- Количество слайдов: 91
 Human Impact on the Atmosphere Chapters 18 and 19 Living in the Environment, 11 th Edition, Miller
. Barron’s How to prepare for") Pollution Thorpe, Gary S. , M. S. , (2002). Barron’s How to prepare for the AP Environmental Science Advanced Placement Exam • The term “Smog” (smoke and fog) was first used in 1905 to describe sulfur dioxide emission • In 1952, severe pollution took the lives of 5000 people in London • “It isn’t pollution that’s harming the environment. It’s the impurities in our air and water that are doing it. ” Former U. S. Vice President Dan Quayle www. aqmd. gov/pubinfo/97 annual. html
Pollution Thorpe, Gary S. , M. S. , (2002). Barron’s How to prepare for the AP Environmental Science Advanced Placement Exam • The term “Smog” (smoke and fog) was first used in 1905 to describe sulfur dioxide emission • In 1952, severe pollution took the lives of 5000 people in London • “It isn’t pollution that’s harming the environment. It’s the impurities in our air and water that are doing it. ” Former U. S. Vice President Dan Quayle www. aqmd. gov/pubinfo/97 annual. html
 Congress found: • Most people now live in urban areas • Growth results in air pollution The • Air pollution endangers living things Clean It decided: Air • Prevention and control at the source was appropriate Act • Such efforts are the responsibility of states and local authorities • Federal funds and leadership are essential for the development of effective programs
 Clean Air Act • Originally signed 1963 – States controlled standards • 1970 – Uniform Standards by Federal Govt. – Criteria Pollutants • Primary – Human health risk • Secondary – Protect materials, crops, climate, visibility, personal comfort
 Clean Air Act • 1990 version – Acid rain, urban smog, toxic air pollutants, ozone depletion, marketing pollution rights, VOC’s • 1997 version – Reduced ambient ozone levels – Cost $15 billion/year -> save 15, 000 lives – Reduce bronchitis cases by 60, 000 per year – Reduce hospital respiratory admission 9000/year
 Clean Air Act President George W. Bush signed rules amending Clean Air Act that allowed power plants and other industries to increase pollution significantly without adopting control measures
 http: //www. cnn. com/2003/LAW/12/24/bush. clean. air. ap/index. html Appeals court blocks Bush clean air changes Wednesday, December 24, 2003 Posted: 2: 10 PM EST (1910 GMT) WASHINGTON (AP) -- A federal appeals court on Wednesday blocked new Bush administration changes to the Clean Air Act from going into effect the next day, in a challenge from state attorneys general and cities that argued they would harm the environment and public health.
 Clean Air Act http: //www. epa. gov/air/oaq_caa. html • Title I - Air Pollution Prevention and Control – Part A - Air Quality and Emission Limitations – Part B - Ozone Protection (replaced by Title VI) – Part C - Prevention of Significant Deterioration of Air Quality – Part D - Plan Requirements for Nonattainment Areas • Title II - Emission Standards for Moving Sources – Part A - Motor Vehicle Emission and Fuel Standards – Part B - Aircraft Emission Standards – Part C - Clean Fuel Vehicles • Title III - General • Title IV - Acid Deposition Control • Title V - Permits
 Outdoor Air Pollution
 Primary Pollutants CO CO 2 SO 2 NO NO 2 Most hydrocarbons Most suspended particles Natural Sources Mobile Secondary Pollutants SO 3 HNO 3 H 2 SO 4 H 2 O 3 PANs – Most NO 3 and SO 2 – salts 4 Stationary
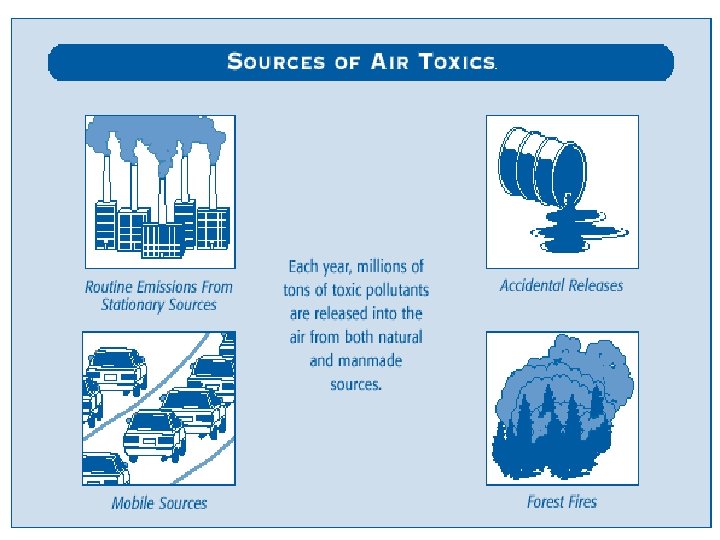
 Major Sources of Primary Pollutants Stationary Sources • Combustion of fuels for power and heat – Power Plants • Other burning such as Wood & crop burning or forest fires • Industrial/ commercial processes • Solvents and aerosols Mobile Sources • Highway: cars, trucks, buses and motorcycles • Off-highway: aircraft, boats, locomotives, farm equipment, RVs, construction machinery, and lawn mowers
 54 million metric tons from mobile sources in 1990
 Human Impact on Atmosphere • Burning Fossil Fuels § Adds CO 2 and O 3 to troposphere § Global Warming § Altering Climates § Produces Acid Rain • Using Nitrogen § Releases NO, NO 2, N 2 O, and NH 3 fertilizers and into troposphere burning fossil fuels § Produces acid rain • Refining petroleum § Releases SO 2 into troposphere and burning fossil fuels § Releases toxic heavy metals (Pb, • Manufacturing Cd, and As) into troposphere www. dr 4. cnrs. fr/gif-2000/air/products. html
 Criteria Air Pollutants EPA uses six "criteria pollutants" as indicators of air quality 1. 2. 3. 4. 5. 6. • Nitrogen Dioxide: NO 2 Ozone: ground level O 3 Carbon monoxide: CO Lead: Pb Particulate Matter: PM 10 (PM 2. 5) Sulfur Dioxide: SO 2 Volatile Organic Compounds: (VOCs) EPA established for each concentrations above which adverse effects on health may occur
 • Properties: reddish brown gas, formed as fuel burnt in") Nitrogen Dioxide (NO 2) • Properties: reddish brown gas, formed as fuel burnt in car, strong oxidizing agent, forms Nitric acid in air • Effects: acid rain, lung and heart problems, decreased visibility (yellow haze), suppresses plant growth • Sources: fossil fuels combustion, power plants, forest fires, volcanoes, bacteria in soil • Class: Nitrogen oxides (NOx) • EPA Standard: 0. 053 ppm
Nitrogen Dioxide (NO 2) • Properties: reddish brown gas, formed as fuel burnt in car, strong oxidizing agent, forms Nitric acid in air • Effects: acid rain, lung and heart problems, decreased visibility (yellow haze), suppresses plant growth • Sources: fossil fuels combustion, power plants, forest fires, volcanoes, bacteria in soil • Class: Nitrogen oxides (NOx) • EPA Standard: 0. 053 ppm
 Mobile Source Emissions: Nitrogen Oxides
 • Properties: colorless, unpleasant odor, major part of photochemical smog •") Ozone (O 3) • Properties: colorless, unpleasant odor, major part of photochemical smog • Effects: lung irritant, damages plants, rubber, fabric, eyes, 0. 1 ppm can lower PSN by 50%, • Sources: Created by sunlight acting on NOx and VOC , photocopiers, cars, industry, gas vapors, chemical solvents, incomplete fuel combustion products • Class: photochemical oxidants
Ozone (O 3) • Properties: colorless, unpleasant odor, major part of photochemical smog • Effects: lung irritant, damages plants, rubber, fabric, eyes, 0. 1 ppm can lower PSN by 50%, • Sources: Created by sunlight acting on NOx and VOC , photocopiers, cars, industry, gas vapors, chemical solvents, incomplete fuel combustion products • Class: photochemical oxidants
 • 10, 000 to 15, 000 people in US admitted to") Ozone (O 3) • 10, 000 to 15, 000 people in US admitted to hospitals each year due to ozone-related illness • Children more susceptible – Airways narrower – More time spent outdoors
Ozone (O 3) • 10, 000 to 15, 000 people in US admitted to hospitals each year due to ozone-related illness • Children more susceptible – Airways narrower – More time spent outdoors
 Mobile Source Emissions: Hydrocarbons – Precursors to Ozone
 • Properties: colorless, odorless, heavier than air, 0. 0036% of atmosphere") Carbon Monoxide (CO) • Properties: colorless, odorless, heavier than air, 0. 0036% of atmosphere • Effects: binds tighter to Hb than O 2, mental functions and visual acuity, even at low levels • Sources: incomplete combustion of fossil fuels 60 - 95% from auto exhaust • Class: carbon oxides (CO 2, CO) • EPA Standard: 9 ppm • 5. 5 billion tons enter atmosphere/year
Carbon Monoxide (CO) • Properties: colorless, odorless, heavier than air, 0. 0036% of atmosphere • Effects: binds tighter to Hb than O 2, mental functions and visual acuity, even at low levels • Sources: incomplete combustion of fossil fuels 60 - 95% from auto exhaust • Class: carbon oxides (CO 2, CO) • EPA Standard: 9 ppm • 5. 5 billion tons enter atmosphere/year
 Mobile Source Emissions - CO
 • Properties: grayish metal • Effects: accumulates in tissue; affects kidneys, liver") Lead (Pb) • Properties: grayish metal • Effects: accumulates in tissue; affects kidneys, liver and nervous system (children most susceptible); mental retardation; possible carcinogen; 20% of inner city kids have [high] • Sources: particulates, smelters, batteries • Class: toxic or heavy metals • EPA Standard: 1. 5 ug/m 3 • 2 million tons enter atmosphere/year
Lead (Pb) • Properties: grayish metal • Effects: accumulates in tissue; affects kidneys, liver and nervous system (children most susceptible); mental retardation; possible carcinogen; 20% of inner city kids have [high] • Sources: particulates, smelters, batteries • Class: toxic or heavy metals • EPA Standard: 1. 5 ug/m 3 • 2 million tons enter atmosphere/year
 • Properties: particles suspended in air (<10 um) •") Suspended Particulate Matter (PM 10) • Properties: particles suspended in air (<10 um) • Effects: lung damage, mutagenic, carcinogenic, teratogenic • Sources: burning coal or diesel, volcanoes, factories, unpaved roads, plowing, lint, pollen, spores, burning fields • Class: SPM: dust, soot, asbestos, lead, PCBs, dioxins, pesticides • EPA Standard: 50 ug/m 3 (annual mean)
Suspended Particulate Matter (PM 10) • Properties: particles suspended in air (<10 um) • Effects: lung damage, mutagenic, carcinogenic, teratogenic • Sources: burning coal or diesel, volcanoes, factories, unpaved roads, plowing, lint, pollen, spores, burning fields • Class: SPM: dust, soot, asbestos, lead, PCBs, dioxins, pesticides • EPA Standard: 50 ug/m 3 (annual mean)
") Mobile Source Emissions: Fine Particulate Matter (PM 2. 5)
Mobile Source Emissions: Fine Particulate Matter (PM 2. 5)
 • Properties: colorless gas with irritating odor • Effects: produces") Sulfur Dioxide (SO 2) • Properties: colorless gas with irritating odor • Effects: produces acid rain (H 2 SO 4), breathing difficulties, eutrophication due to sulfate formation, lichen and moss are indicators • Sources: burning high sulfur coal or oil, smelting or metals, paper manufacture • Class: sulfur oxides • EPA Standard: 0. 3 ppm (annual mean) • Combines with water and NH 4 to increase soil fertility
Sulfur Dioxide (SO 2) • Properties: colorless gas with irritating odor • Effects: produces acid rain (H 2 SO 4), breathing difficulties, eutrophication due to sulfate formation, lichen and moss are indicators • Sources: burning high sulfur coal or oil, smelting or metals, paper manufacture • Class: sulfur oxides • EPA Standard: 0. 3 ppm (annual mean) • Combines with water and NH 4 to increase soil fertility
 • Properties: organic compounds (hydrocarbons) that evaporate easily, usually aromatic") VOCs (Volatile Organic Compounds) • Properties: organic compounds (hydrocarbons) that evaporate easily, usually aromatic • Effects: eye and respiratory irritants; carcinogenic; liver, CNS, or kidney damage; damages plants; lowered visibility due to brown haze; global warming • Sources: vehicles (largest source), evaporation of solvents or fossil fuels, aerosols, paint thinners, dry cleaning • Class: HAPs (Hazardous Air Pollutants) – Methane – Benzene – Chlorofluorocarbons (CFCs), etc. • Concentrations indoors up to 1000 x outdoors
VOCs (Volatile Organic Compounds) • Properties: organic compounds (hydrocarbons) that evaporate easily, usually aromatic • Effects: eye and respiratory irritants; carcinogenic; liver, CNS, or kidney damage; damages plants; lowered visibility due to brown haze; global warming • Sources: vehicles (largest source), evaporation of solvents or fossil fuels, aerosols, paint thinners, dry cleaning • Class: HAPs (Hazardous Air Pollutants) – Methane – Benzene – Chlorofluorocarbons (CFCs), etc. • Concentrations indoors up to 1000 x outdoors
 • • • Other Air Pollutants Carbon dioxide Chloro. Fluoro. Carbons Formaldehyde Benzene Asbestos Manganese Dioxins Cadmium Others not yet fully characterized
 • Topography") Formation & Intensity Factors • Local climate (inversions, air pressure, temperature, humidity) • Topography (hills and mountains) • Population density • Amount of industry • Fuels used by population and industry for heating, manufacturing, transportation, power • Weather: rain, snow, wind • Buildings (slow wind speed) • Mass transit used • Economics
Formation & Intensity Factors • Local climate (inversions, air pressure, temperature, humidity) • Topography (hills and mountains) • Population density • Amount of industry • Fuels used by population and industry for heating, manufacturing, transportation, power • Weather: rain, snow, wind • Buildings (slow wind speed) • Mass transit used • Economics
 warm air •") Thermal Inversion cool air Pollutants cool air warm air (inversion layer) warm air • surface heated by sun • warm air rises (incl. pollutants) • cools off, mixes with air of equal density & disperses • surface cools rapidly (night) • a layer of warm air overlays surface • polluted surface air rises but cannot disperse ⇒ remains trapped
Thermal Inversion cool air Pollutants cool air warm air (inversion layer) warm air • surface heated by sun • warm air rises (incl. pollutants) • cools off, mixes with air of equal density & disperses • surface cools rapidly (night) • a layer of warm air overlays surface • polluted surface air rises but cannot disperse ⇒ remains trapped
 Los") Smog Forms. . . when polluted air is stagnant (weather conditions, geographic location) Los Angeles, CA
Smog Forms. . . when polluted air is stagnant (weather conditions, geographic location) Los Angeles, CA
 Primary Pollutants CO CO 2 SO 2 NO NO 2 Most hydrocarbons Most suspended particles Natural Sources Mobile Secondary Pollutants SO 3 HNO 3 H 2 SO 4 H 2 O 3 PANs – Most NO 3 and SO 2 – salts 4 Stationary
 Photochemical Smog UV radiation Primary Pollutants Secondary Pollutants NO 2 + Hydrocarbons HNO 3 nitric acid ozone H 2 O + O 2 Auto Emissions Photochemical Smog
 Solar radiation Photochemical Smog Ultraviolet radiation NO Nitric oxide NO 2 Nitrogen dioxide H 2 O Water O Atomic oxygen O 2 Molecular oxygen Hydrocarbons PANs Peroxyacyl nitrates HNO 3 Nitric acid Aldehydes (e. g. , formaldehyde) Photochemical Smog O 3 Ozone
 Indoor Air Pollution
 Why is indoor air quality important? • 70 to 90% of time spent indoors, mostly at home • Many significant pollution sources in the home (e. g. gas cookers, paints and glues) • Personal exposure to many common pollutants is driven by indoor exposure • Especially important for susceptible groups – e. g. the sick, old and very young
 Exposure • Time spent in various environments in US and less-developed countries
![House of Commons Select Committee Enquiry on Indoor Air Pollution (1991) • “[There is]](https://present5.com/presentation/f9cabda9f791d181dd7e4db327373611/image-38.jpg "House of Commons Select Committee Enquiry on Indoor Air Pollution (1991) • “[There is]") House of Commons Select Committee Enquiry on Indoor Air Pollution (1991) • “[There is] evidence that 3 million people have asthma in the UK… and this is increasing by 5% per annum. ” • “Overall there appears to be a worryingly large number of health problems which could be connected with indoor pollution and which affect very large numbers of the population. ” • [The Committee recommends that the Government] “develop guidelines and codes of practice for indoor air quality in buildings which specifically identify exposure limits for an extended list of pollutants…”
House of Commons Select Committee Enquiry on Indoor Air Pollution (1991) • “[There is] evidence that 3 million people have asthma in the UK… and this is increasing by 5% per annum. ” • “Overall there appears to be a worryingly large number of health problems which could be connected with indoor pollution and which affect very large numbers of the population. ” • [The Committee recommends that the Government] “develop guidelines and codes of practice for indoor air quality in buildings which specifically identify exposure limits for an extended list of pollutants…”
 Sources of Indoor Air Pollutants • Building materials • Furniture • Furnishings and fabrics • Glues • Cleaning products • Other consumer products • Combustion appliances (cookers and heaters) • Open fires • Tobacco smoking • Cooking • House dust mites, bacteria and moulds • Outdoor air
 Important Indoor Air pollutants • Nitrogen dioxide • Carbon monoxide • Formaldehyde • Volatile Organic Compounds (VOCs) • House dust mites (and other allergens, e. g. from pets) • Environmental tobacco smoke • Fine particles • Chlorinated organic compounds (e. g. pesticides) • Asbestos and man-made mineral fibres • Radon
 Health Effects Nitrogen dioxide • Respiratory irritant • Elevated risk of respiratory illness in children, perhaps resulting from increased susceptibility to respiratory infection; inconsistent evidence for effects in adults • Concentrations in kitchens can readily exceed WHO and EPA standards
 Health Effects Carbon monoxide • An asphyxiant and toxicant • Hazard of acute intoxication, mostly from malfunctioning fuel-burning appliances and inadequate or blocked flues • Possibility of chronic effects of long-term exposure to non- lethal concentrations, particularly amongst susceptible groups
 Health Effects Formaldehyde • Sensory and respiratory irritant and sensitizer • Possible increased risk of asthma and chronic bronchitis in children at higher exposure levels • Individual differences in sensory and other transient responses • Caution over rising indoor concentrations
 • Occur in complex and variable mixtures •") Health Effects Volatile Organic Compounds (VOCs) • Occur in complex and variable mixtures • Main health effects relate to comfort and wellbeing, but benzene (and other VOCs) are carcinogenic • Concern about possible role of VOCs in the aetiology of multiple chemical sensitivity; also implicated in sick building syndrome
Health Effects Volatile Organic Compounds (VOCs) • Occur in complex and variable mixtures • Main health effects relate to comfort and wellbeing, but benzene (and other VOCs) are carcinogenic • Concern about possible role of VOCs in the aetiology of multiple chemical sensitivity; also implicated in sick building syndrome
 Health Effects House dust mites • House dust mites produce Der p 1 allergen, a potent sensitizer • Good evidence of increased risk of sensitization with increasing allergen exposure, but this does not necessarily lead to asthma • Small reductions in exposure will not necessarily lead to reduced incidence and/or symptoms • Indoor humidity is important
 Health Effects Fungi and bacteria • Dampness and mould-growth linked to selfreported respiratory conditions, but little convincing evidence for association between measured airborne fungi and respiratory disease • Insufficient data to relate exposure to (nonpathogenic) bacteria to health effects in the indoor environment
 • • Sudden infant death syndrome Lower respiratory") Health Effects Environmental tobacco smoke (ETS) • • Sudden infant death syndrome Lower respiratory tract illness Middle ear disease Asthma 12 million children exposed to secondhand smoke in homes
Health Effects Environmental tobacco smoke (ETS) • • Sudden infant death syndrome Lower respiratory tract illness Middle ear disease Asthma 12 million children exposed to secondhand smoke in homes
 Health Effects Fine particles • Consistent evidence that exposure to small airborne particles (e. g. PM 10) in ambient air can impact on human health; mechanisms uncertain • Chronic Obstructive Pulmonary Disease and Cardiovascular Disease patients and asthmatics probably at extra risk • Relative importance of indoor sources is unknown
 Health Effects Radon • Can cause lung cancer • Estimated that 7, 000 to 30, 000 Americans die each year from radon-induced lung cancer • Only smoking causes more lung cancer deaths • Smokers more at risk than non-smokers
 Radon Risk: Non-Smoker Radon Level If 1000 people who did not smoke were This risk of cancer from (p. CI/L) exposed to this level over a lifetime. . radon exposure compares About X would get lung cancer to … Being killed in a violent crime What to do: 20 8 10 4 Fix your home 8 3 10 x risk of dying in a plane Fix your home crash 4 2 2 <1 Risk of dying in a home Fix your home fire 1. 3 <1 Average indoor radon level Fix your home 0. 4 <1 Average indoor radon level Fix your home Risk of drowning Fix your home If you are a former smoker, your risk may be higher
 If 1000 people who smoke were exposed") Radon Risk: Smoker Radon Level (p. CI/L) If 1000 people who smoke were exposed to this level over a lifetime. . About X would get lung cancer This risk of cancer from What to do: radon exposure compares Stop smoking and to … … 20 135 100 x risk of drowning 10 71 100 x risk of dying in a home fire 8 57 4 29 2 15 2 x the risk of dying in a car Fix your home crash 1. 3 9 Average indoor radon level Fix your home 0. 4 3 Average indoor radon level Fix your home 100 x risk of dying in a plane crash Fix your home If you are a former smoker, your risk may be lower
Radon Risk: Smoker Radon Level (p. CI/L) If 1000 people who smoke were exposed to this level over a lifetime. . About X would get lung cancer This risk of cancer from What to do: radon exposure compares Stop smoking and to … … 20 135 100 x risk of drowning 10 71 100 x risk of dying in a home fire 8 57 4 29 2 15 2 x the risk of dying in a car Fix your home crash 1. 3 9 Average indoor radon level Fix your home 0. 4 3 Average indoor radon level Fix your home 100 x risk of dying in a plane crash Fix your home If you are a former smoker, your risk may be lower
 Radon • 55% of our exposure to radiation comes from radon • colorless, tasteless, odorless gas • formed from the decay of uranium • found in nearly all soils • levels vary
 Zone p. Ci/L 1 2 3 >4 2") (From: http: //www. epa. gov/iaq/radon/zonemap. html) Zone p. Ci/L 1 2 3 >4 2 -4 <2
(From: http: //www. epa. gov/iaq/radon/zonemap. html) Zone p. Ci/L 1 2 3 >4 2 -4 <2
 Radon: How it Enters Buildings • • • Cracks in solid floors Construction joints Cracks in walls Gaps in suspended floors Gaps around service pipes • Cavities inside walls • The water supply http: //www. epa. gov/iaq/radon/pubs/citguide. html#howdoes
 Radon: Reducing the Risks • Sealing cracks in floors and walls • Simple systems using pipes and fans
 vs Building Related Illness (BRI)") Sick Building Syndrome (SBS) vs Building Related Illness (BRI)
Sick Building Syndrome (SBS) vs Building Related Illness (BRI)
 Sick Building Syndrome • A persistent set of symptoms in > 20% population • Causes(s) not known or recognizable • Complaints/Symptoms relieved after exiting building
 Complaints/Symptoms • • • Headaches Fatigue Reduced Mentation Irritability Eye, nose or throat irritation • • • Dry Skin Nasal Congestion Difficulty Breathing Nose Bleeds Nausea
 Building Related Illness • Clinically Recognized Disease • Exposure to indoor air pollutants • Recognizable Causes
 Clinically Recognized Diseases – Pontiac Fever – Legionella spp. – Legionnaire's Disease – Hypersensitivity Pneumonitis – Humidifier Fever – Asthma – Allergy – Respiratory Disease • Chronic Obstructive Pulmonary Disease
 Ventilation
 Movement of Air Into / Out of Homes • Amount of air available to dilute pollutants – important indicator of the likely contaminant concentration • Indoor air can mix with outside air by three mechanisms – infiltration – natural ventilation – forced ventilation
 Movement of Air Into / Out of Homes • Infiltration – natural air exchange that occurs between a building and its environment when the doors and windows are closed – leakage through holes or openings in the building envelope – pressure induced • due to pressure differentials inside and outside of the building • especially important with cracks and other openings in wall
 Movement of Air Into / Out of Homes • Infiltration – Temperature induced (stack effect) • driven by air movement through holes in floors, ceilings • in winter, warm air in a building wants to rise, exits through cracks in ceiling and draws in
 Movement of Air Into / Out of Homes • Natural ventilation – air exchange that occurs when windows or doors are opened to increase air circulation • Forced ventilation – mechanical air handling systems used to induce air exchange using fans and blowers • Trade-offs – cut infiltration to decrease heating and cooling costs vs. indoor air quality problems
 Movement of Air Into / Out of Homes • Infiltration rates – Influenced by • how fast wind is blowing, pressure differentials • temperature differential between inside and outside of house • location of leaks in building envelope
 Air Pollution Prevention
 Specific Air Pollution Treatment Technology • Traditional – Move factory to remote location – Build taller smokestack so wind blows pollution elsewhere • New – Biofiltration : vapors pumped through soil where microbes degrade – High-energy destruction: high-voltage electricity – Membrane separation: diffusion of organic vapors through membrane – Oxidation: High temperature combustor
 Absorption
 Adsorption
 Combustion
 Cyclone
 Filtration
 Electrostatic Precipitator
 Liquid Scrubber
 Sulfur Dioxide Control http: //www. apt. lanl. gov/projects/cctc/factsheets/puair/adflugasdemo. html
 Air Pollution Results
 Comparison of 1970 and 1999 Emissions
 Number of People Living in Counties with Air Quality Concentrations Above the Level of the National Ambient Air Quality Standards (NAAQS) in 1999
 Trends in Sulfur Dioxide Emissions Following Implementation of Phase I of the Acid Rain Program: Total State-level Utility SO 2 (1980, 1999)
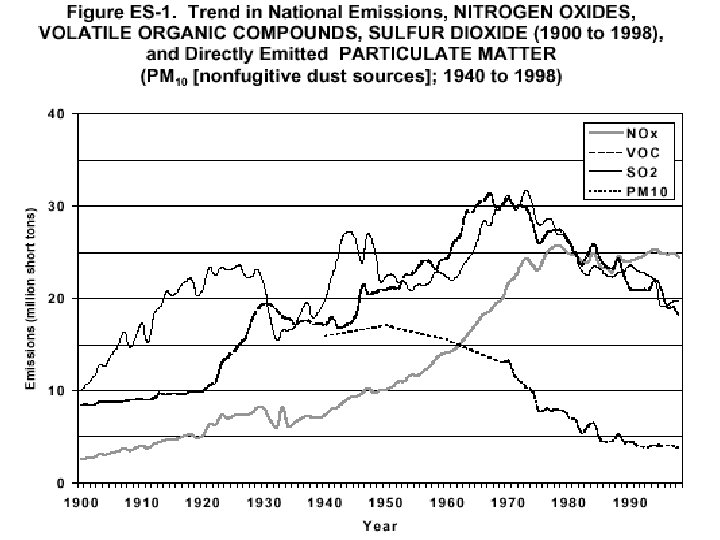
 Fifty Years of Air Pollution Figures are in millions of metric tons per year
 VOCs CO NOx Mobile Sources: The Last Ten Years Percent reductions -8% -10% PM 10 SOx Lead -3% -29% shown are based on estimates of tons/year from mobile sources over the 1981 - 1990 time period -24% -85%
 63 Who is Affected by Air Pollution? Over 74 million people are subjected to high levels of at least one of these pollutants 22 Ozone CO 19 9 1 NO 2 5 PM 10 SO 2 Lead Millions of people living in counties with air quality that exceeds each NAAQS (1990 data)
 1952 - Autos linked to air pollution Milestones in the Control of Automotive Emissions 1963 - Original CAA, PCV valves 1968 - HC & CO exhaust controls 1970 - CAA amendments, EPA formed 1971 - Evaporative controls 1972 - First I/M Program 1973 - NOx exhaust controls 1975 - First catalytic converters 1981 - New cars meet statutory limits 1989 - Volatility limits on gasoline 1990 - New CAA Amendments
 • 1987 Montreal Protocol: CFC emissions should be reduced by 50% by the year 2000 (they had been increasing 3% per year. ) • 1990 London amendments: production of CFCs, CCl 4, and halons should cease entirely by 2000. • 1992 Copenhagen agreements: phaseout accelerated to 1996.
 Goals of Kyoto Protocol Reduction of greenhouse gases to below 1990 levels: 5. 2% world wide reduction on average by 20082012 6% for Canada by 2008 -2012 When sufficient countries ratify the Protocol (at least 55 countries comprising at least 55% of emissions), Protocol comes into effect USA - 25% of emissions
 Kyoto Emissions Agreement