

4ed63200e6baf274b575f9f770428807.ppt
- Количество слайдов: 26
 How well can we measure the vertical profile of aerosol extinction? Aerosol layers over Oklahoma as seen from Twin Otter on May 27, 2003 Photo courtesy of Roy Woods
![B. Schmid [1], R. Ferrare [2], C. Flynn [3], R. Elleman [4], D. Covert](https://present5.com/presentation/4ed63200e6baf274b575f9f770428807/image-2.jpg "B. Schmid [1], R. Ferrare [2], C. Flynn [3], R. Elleman [4], D. Covert") B. Schmid [1], R. Ferrare [2], C. Flynn [3], R. Elleman [4], D. Covert [4], A. Strawa [5], E. Welton [6], J. Barnard [3], M. Bartholomew [7], M. Clayton [8], J. Eilers [5], G. Hallar [5], B. Holben [6], H. Jonsson [9], J. Michalsky [10], J. Redemann [1], K. Ricci [11], A. Smirnov [12], D. Turner [3] [1] Bay Area Environmental Research Institute, Sonoma, CA [2] NASA Langley Research Center, Hampton, VA [3] Pacific Northwest National Laboratory, Richland, WA [4] University of Washington, Seattle, WA [5] NASA Ames Research Center, Moffett Field, CA [6] NASA GSFC, Greenbelt, MD [7] Brookhaven National Laboratory, Upton, NY [8] SAIC/NASA Langley Research Center, Hampton, VA [9] Center for Interdisciplinary Remotely-Piloted Aircraft Studies, Marina, CA [10] NOAA/CMDL, Boulder, CO [11] Los Gatos Research, Mountain View, CA [12] GEST/UMBC/ NASA GSFC, Greenbelt, MD
B. Schmid [1], R. Ferrare [2], C. Flynn [3], R. Elleman [4], D. Covert [4], A. Strawa [5], E. Welton [6], J. Barnard [3], M. Bartholomew [7], M. Clayton [8], J. Eilers [5], G. Hallar [5], B. Holben [6], H. Jonsson [9], J. Michalsky [10], J. Redemann [1], K. Ricci [11], A. Smirnov [12], D. Turner [3] [1] Bay Area Environmental Research Institute, Sonoma, CA [2] NASA Langley Research Center, Hampton, VA [3] Pacific Northwest National Laboratory, Richland, WA [4] University of Washington, Seattle, WA [5] NASA Ames Research Center, Moffett Field, CA [6] NASA GSFC, Greenbelt, MD [7] Brookhaven National Laboratory, Upton, NY [8] SAIC/NASA Langley Research Center, Hampton, VA [9] Center for Interdisciplinary Remotely-Piloted Aircraft Studies, Marina, CA [10] NOAA/CMDL, Boulder, CO [11] Los Gatos Research, Mountain View, CA [12] GEST/UMBC/ NASA GSFC, Greenbelt, MD
 How do we measure the vertical profile of aerosol extinction? Airborne: • Nepehelometer+PSAP • Cavity-Ring-Down (Cadenza) • Sunphotometry (AATS 14) Ground based: • Raman Lidar (CARL) • MPLNET Photo courtesy Yin-Nan Lee, BNL
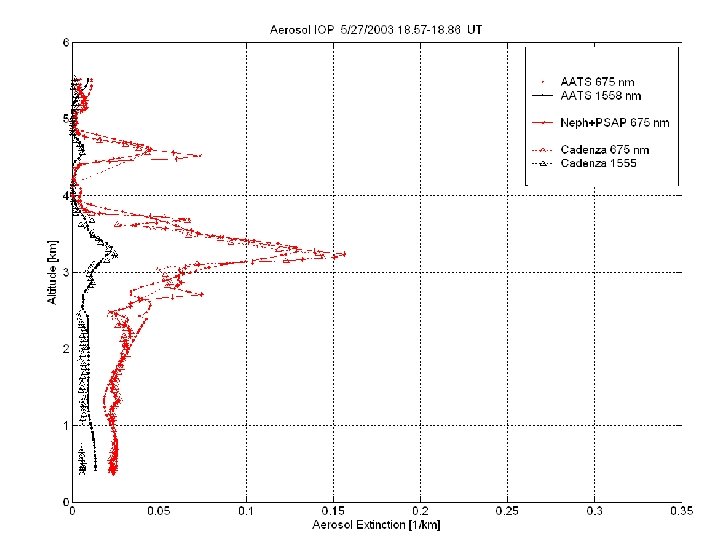
 Airborne in-situ measurement of Extinction = Absorption + Scattering • Particle Soot Absorption • Nephelometers – TSI: l = 450, 550, 700 nm, Photometer (PSAP) low RH § l=467, 530, 660 nm • low RH • Corrections (Bond et al. , 1999, Virkkula et al, 2004) – scattering contribution – loading correction – ambient p, T – RR: l = 540 nm, RH=20, 60, 85% • Corrections (Anderson & Ogren, 1998) – light source – angular truncation (7°-170°) – ambient RH, p, T
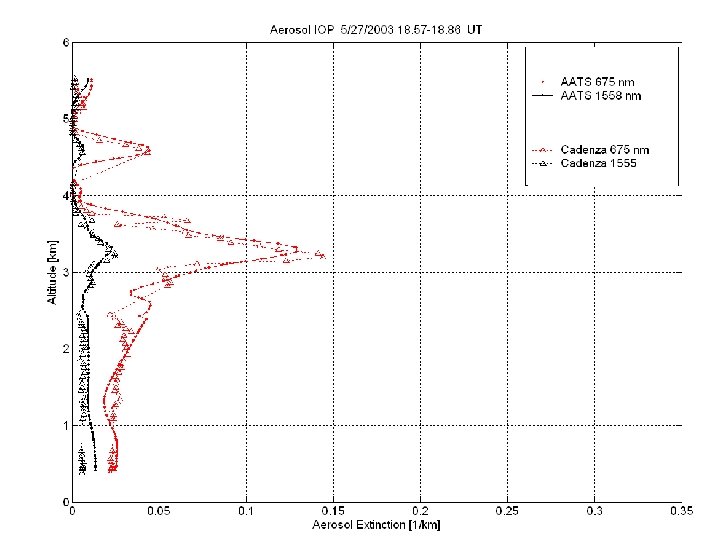
 Iin(t) ring-down cavity time Aerosol was sampled") Extinction from Airborne Cavity Ring-Down System Iout(t) Iin(t) ring-down cavity time Aerosol was sampled at low RH (comparable to TSI) Used RR-Neph measured growth curve to adjust to ambient RH
Extinction from Airborne Cavity Ring-Down System Iout(t) Iin(t) ring-down cavity time Aerosol was sampled at low RH (comparable to TSI) Used RR-Neph measured growth curve to adjust to ambient RH
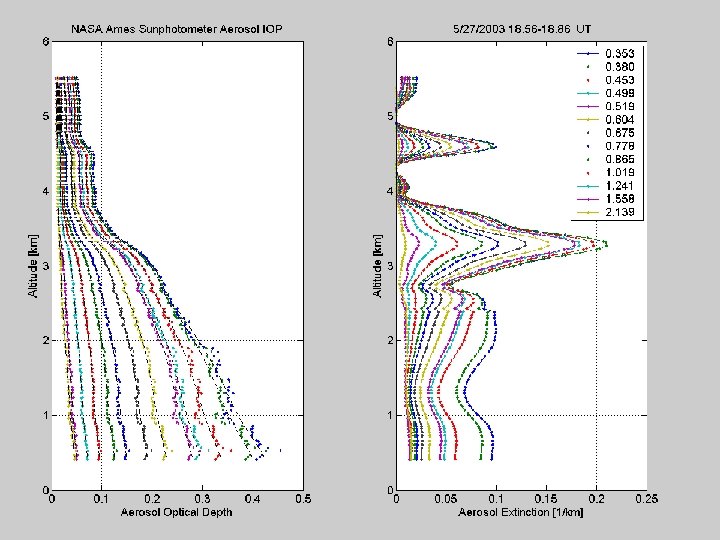
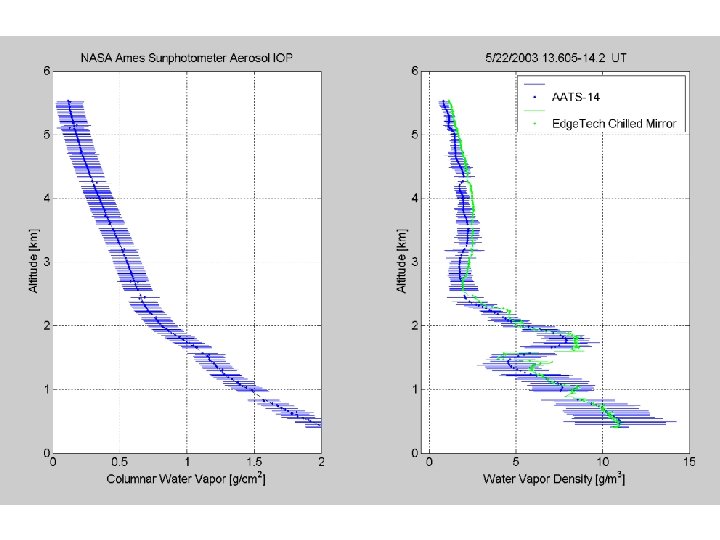
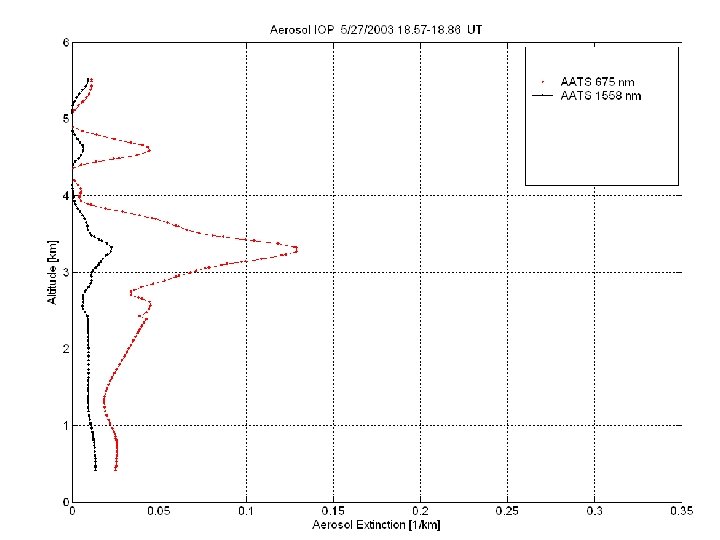
 NASA Ames Airborne Tracking Sunphotometer AATS-14: 354 -2139 nm Aerosol Optical Depth and H 2 O column Aerosol Extinction and H 2 O density in suitable profiles
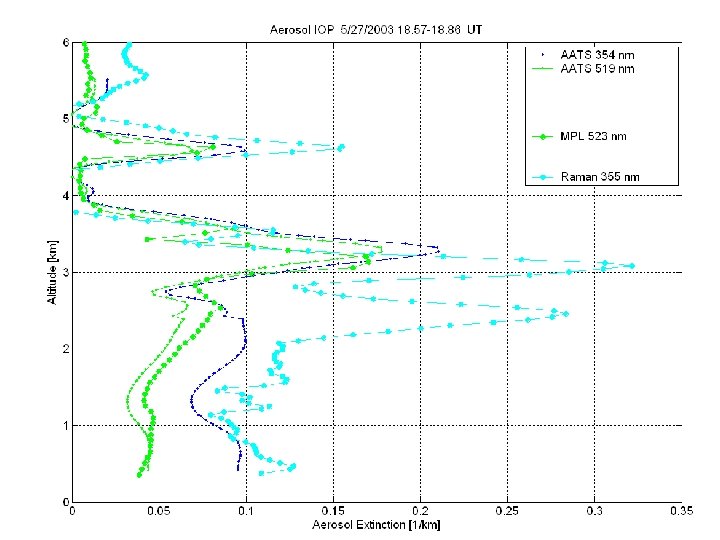
 Raman Lidar • Aerosol Extinction profiles l=355 nm • Unnoticed loss of sensitivity leading up to AIOP • Automated algorithms had to be modified to reduce impact of sensitivity loss. • Significant upgrades/mods were performed after AIOP resulting in significantly better performance than during any other time. Photo courtesy Yin-Nan Lee, BNL
 • Aerosol Extinction") • Backscatter Lidar • Deployed during AIOP (in SMART trailer) • Aerosol Extinction profiles l=523 nm • AOD anchored to AERONET, BER constant with altitude • Level 2. 0 (ext. prof. when valid AERONET AOD) • Periodic overheating problems
• Backscatter Lidar • Deployed during AIOP (in SMART trailer) • Aerosol Extinction profiles l=523 nm • AOD anchored to AERONET, BER constant with altitude • Level 2. 0 (ext. prof. when valid AERONET AOD) • Periodic overheating problems
 MPLARM • Backscatter Lidar • Deployed permanently at SGP • Aerosol Extinction profiles l=523 nm is a new product in b-stage • AOD anchored to NIMFR, BER constant with altitude
 ARM Aerosol IOP – May 2003 CIRPAS Twin Otter Focus on data obtained in vertical profiles over SGP CF Altitudes: ~90 – 5600 m
 Observation # AOD: AERONET minus AATS-14
 Observation # AOD: NIMFR minus AATS-14
 How well did past campaigns do on AATS vs Neph+PSAP comparisons? Eastern Asia, 2001 U. S. East Coast, 1996, Bias -14% (Hegg et al. , 1997, Hartley et al. , 2000) C-130: Bias: +6% Redemann et al. , 2003 Twin Otter: Bias -13% Canary Islands, 1997, Bias -20% Schmid et al. , 2003 (after inlet correction) (Schmid et al. , 2000) U. S. East Coast, 2001, Bias -15% Magi et al. (2004) Aerosol IOP Southern Africa, 2000, Bias -4% (Magi et al. , 2003) Oklahoma, 2003, Bias -14%
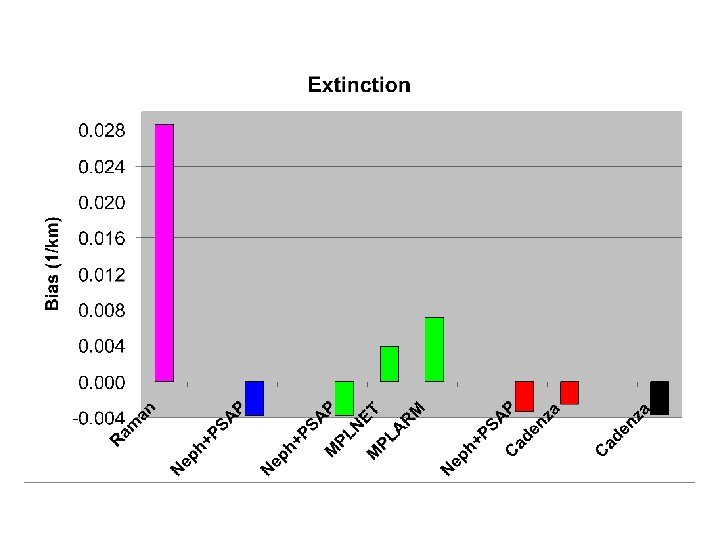
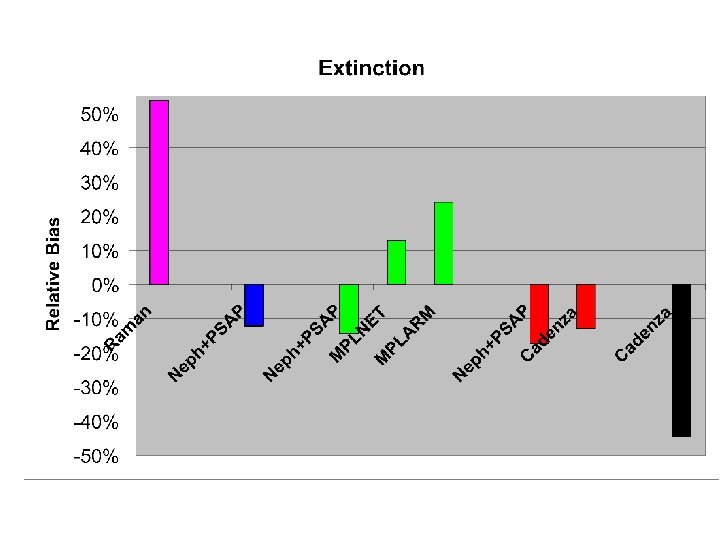
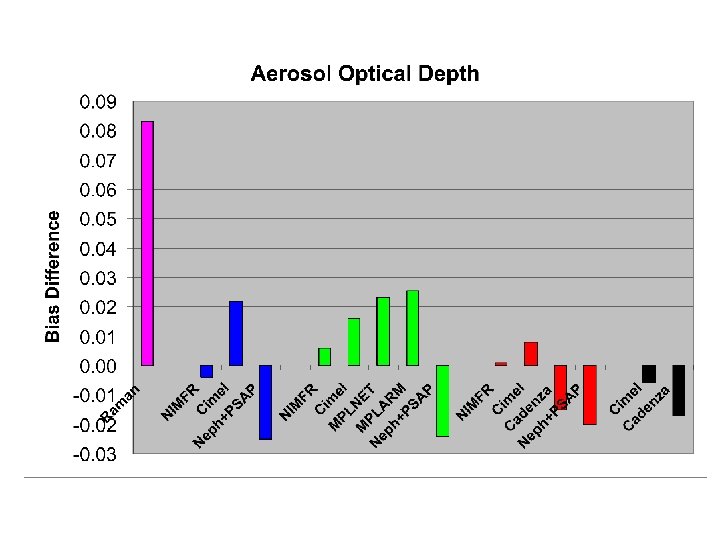
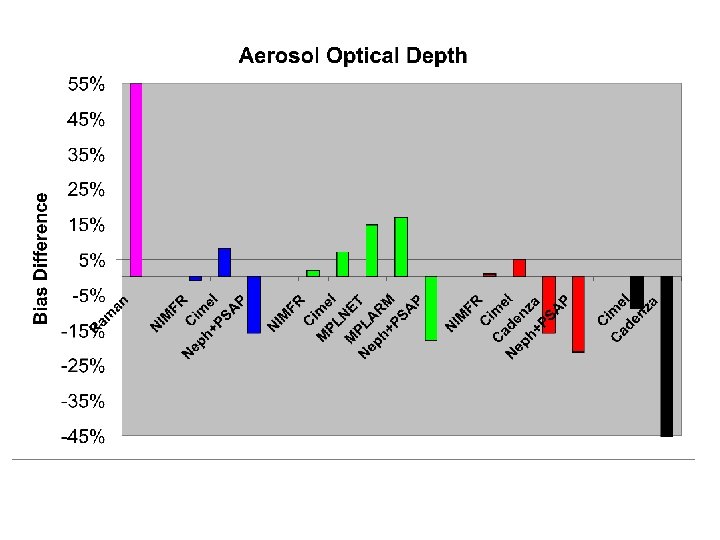
 Conclusions • When compared to airborne sunphotometer extinction, in -situ measurements are biased low (2 - 4 Mm-1 VIS 12 -17%, NIR 45%) • Looking at results from 6 field campaigns, airborne Neph+PSAP measurements of extinction tend to be biased slightly low (<15%, VIS) when compared to airborne sunphotometer extinction. • Micro-Pulse Lidar measurements biased high – MPLNET 4 Mm-1, 13% – MPLARM 7 Mm-1, 24% • Raman Lidar measurements biased high (29 Mm-1 UV 54%). We expect better agreement from a “healthier” Raman lidar.
 Suggestion to AWG • Improved Raman Lidar needs validation • Newly developed MPLARM extinction profile algos need validation • Enhanced IAP plane will need validation With a small amount of flight hours (i. e. AATS-14 on J-31) these objectives could be met in a cost effective way